Viewing product usage
The inventory information retrieved by Inventory from sources such as Configuration Manager and Tachyon includes data on how often products are being used on particular devices. If you're a user interested in the software reclaimer aspects of AppClarity you can focus on reclaiming software based on its usage. There are two ways of viewing product usage in AppClarity:
To view product usage information across all servers and workstations in your network switch toInventory→SLA Inventoryand then Inventory→ ProductUsageto investigate the products you are interested in.
To view usage information for reclaimable software, i.e. software installed on workstations not on servers, switch toAppClarity→Reclaim→Usage Summary. By default, that page also contains a filter to show licensable products only, but you can remove that if you're interested in reclaiming any type of software on workstations.
Note
The reclaimer does not work on server OS. From AppClarity 7.1 software reclaimer works for any device where Server OS does not contain "Server" (ie. only client OS) or Server OS is not NULL. Other types of device are removed from the reclaim reports.
Product usage information is reported through the inventory repository when connected to a Microsoft System Center Configuration Manager or Tachyon data source. If you're interested in the possibilities of reclaiming unused software and thereby reducing license waste and costs, AppClarity provides a way of navigating the products installed on your system and seeing how much they are being used. These investigations can then be used as the basis for defining reclaim policies that will target the right software.
There are two views on product usage. One is in Inventory and the other, geared more towards software reclaim, is in AppClarity.
Inventory Product Usage page
Switch to Inventory→SLA Inventory→Product Usage . This page displays usage information on both Servers and Workstations.
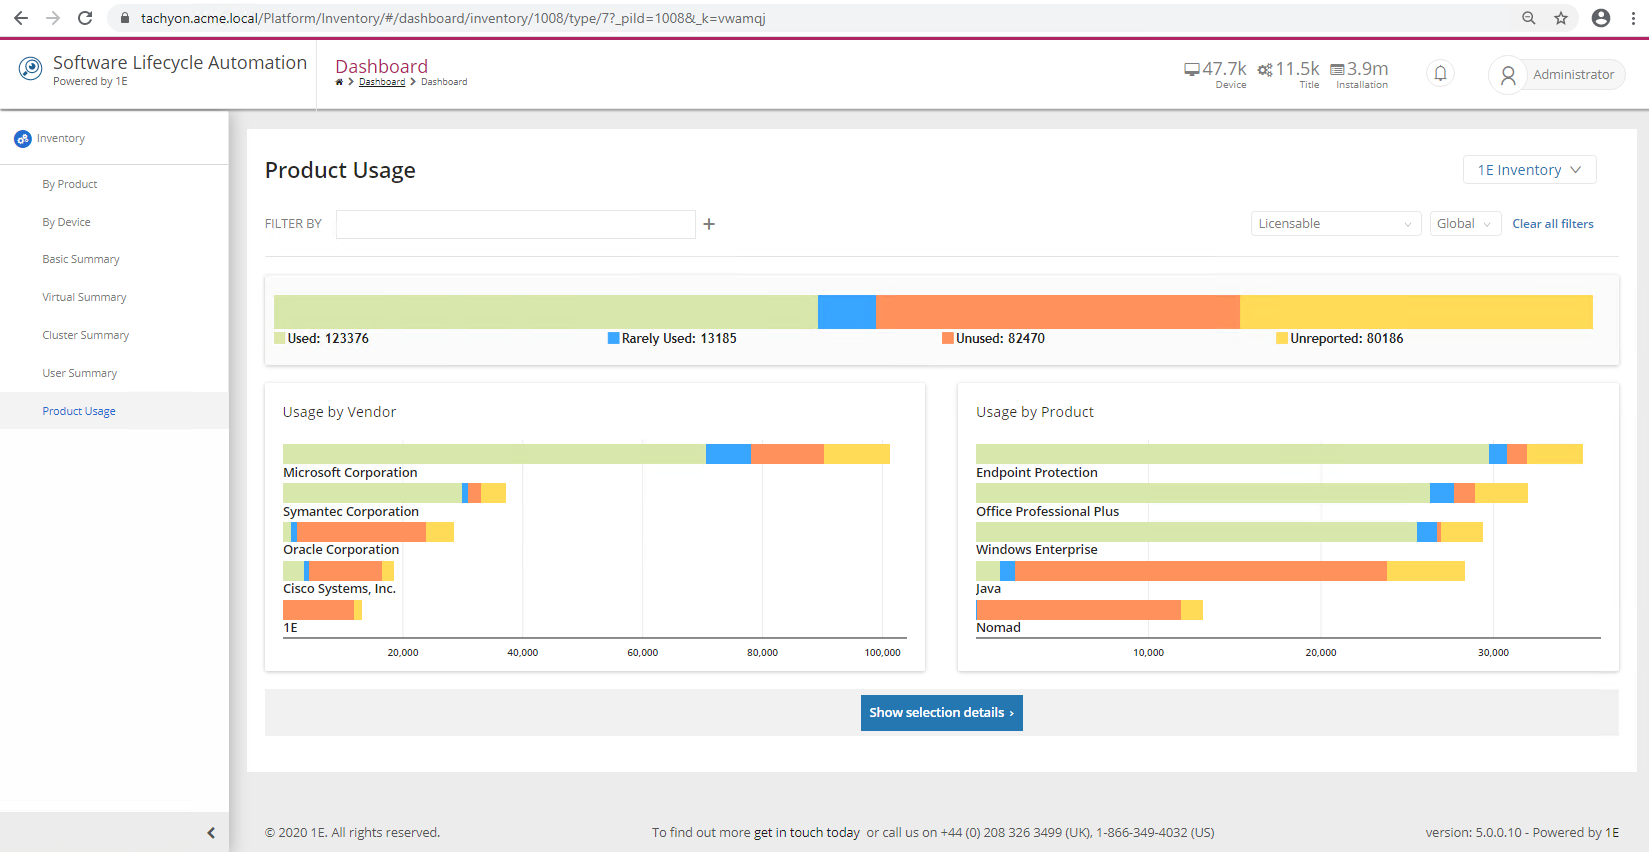
Here you'll see three charts displaying products organized according to their usage categories. The main chart that spans the width of the page displays the overall usage categories and the counts of software in each.
The Usage by Vendor chart on the left shows the vendors that have the most installed products in the environment. For example, Microsoft Corporation, Symantec Corporation and Oracle Corporation.
The Usage by Product chart on the right displays the top five products with the most installations. In our example Endpoint Protection, Office Professional Plus, Windows Enterprise, Java and Nomad.
Hovering over one of the color blocks in the chart displays information for that usage type. For example the blue color block on the Office Professional Plus product shows that there are 1394 rarely used installations the red color block for that product shows that there are 1204 unused installations of Office Professional Plus.
Clicking on a block in the Usage by Product chart drills down to the details for that particular product. In our example by clicking on a block in the Office Professional Plus product.
Doing this displays the Product Usage table for that product. Here you can see the vendor, title, version, colloquial version and edition for the product alongside a total that shows the number of installations for the product. There are also four columns for each of the usage categories. In our example Office Professional Plus version 12.0.6612.1000 has 155installations, 5 of which are unused and 2 are rarely used.
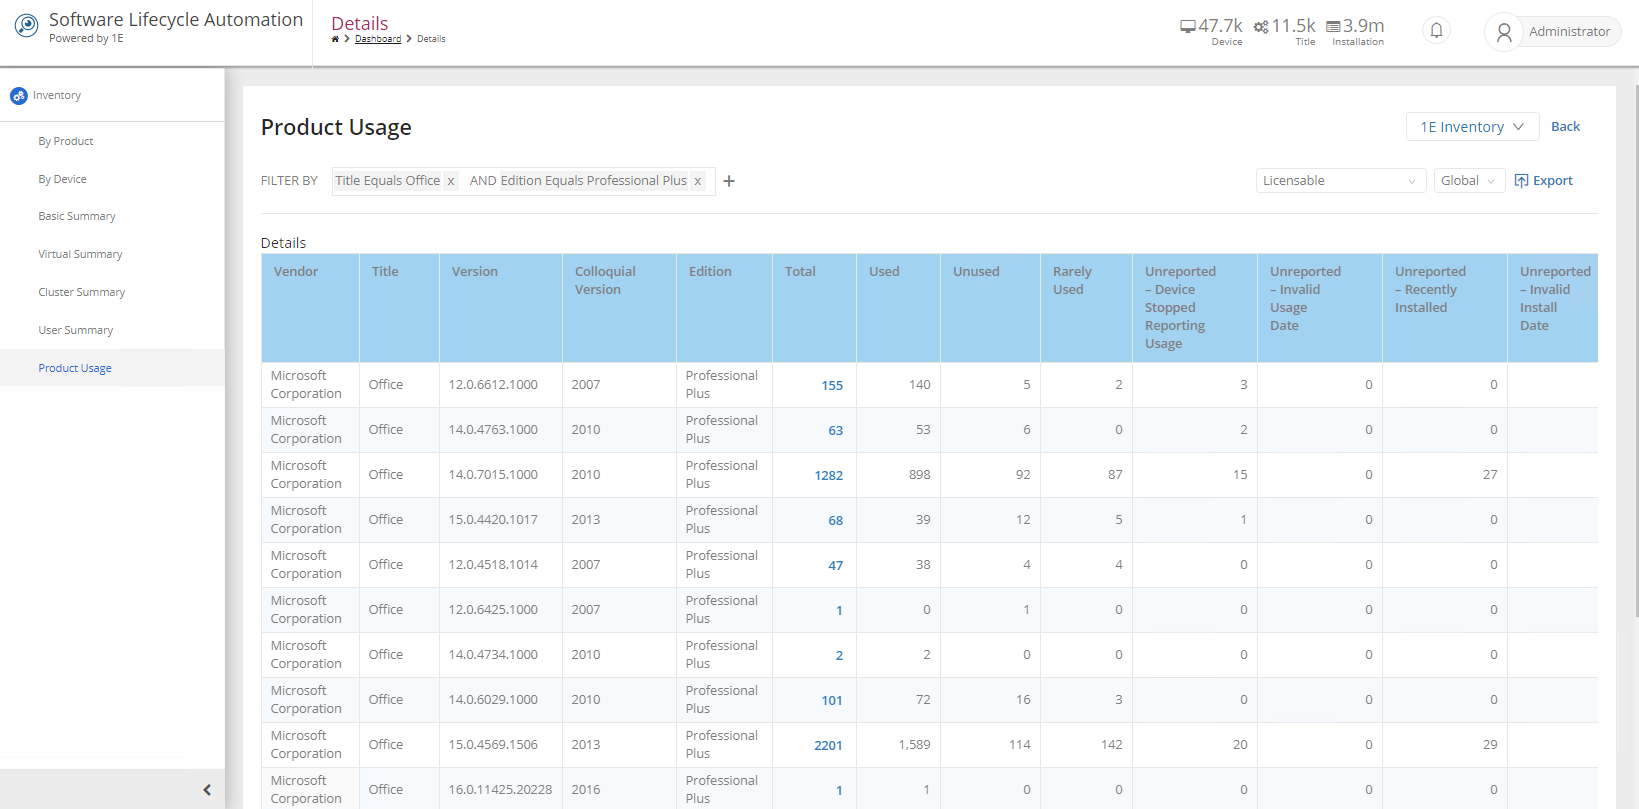
The total column contains a link that, when clicked, displays the Product Details table for the product's installations. In our example we can see that this version of Office Professional Plus is installed on 162 computers. This will be significant later when we compare the Inventory Product Usage page with the AppClarity Product Usage page.
Clicking on the name for a device displays detailed information and all the installations for that device.
We then click Back a few times to return to the top-level Inventory Product Usage page. Fix the totals on this page in your mind to compare them with the AppClarity Product Usage page. In our example there are 140 used, 2 rarely used, 5 unused products.
AppClarity Usage Summary page
Switch to AppClarity→Reclaim→Usage Summary. There's a filter set by default only showing information for the selected management group and only products which are licensable.
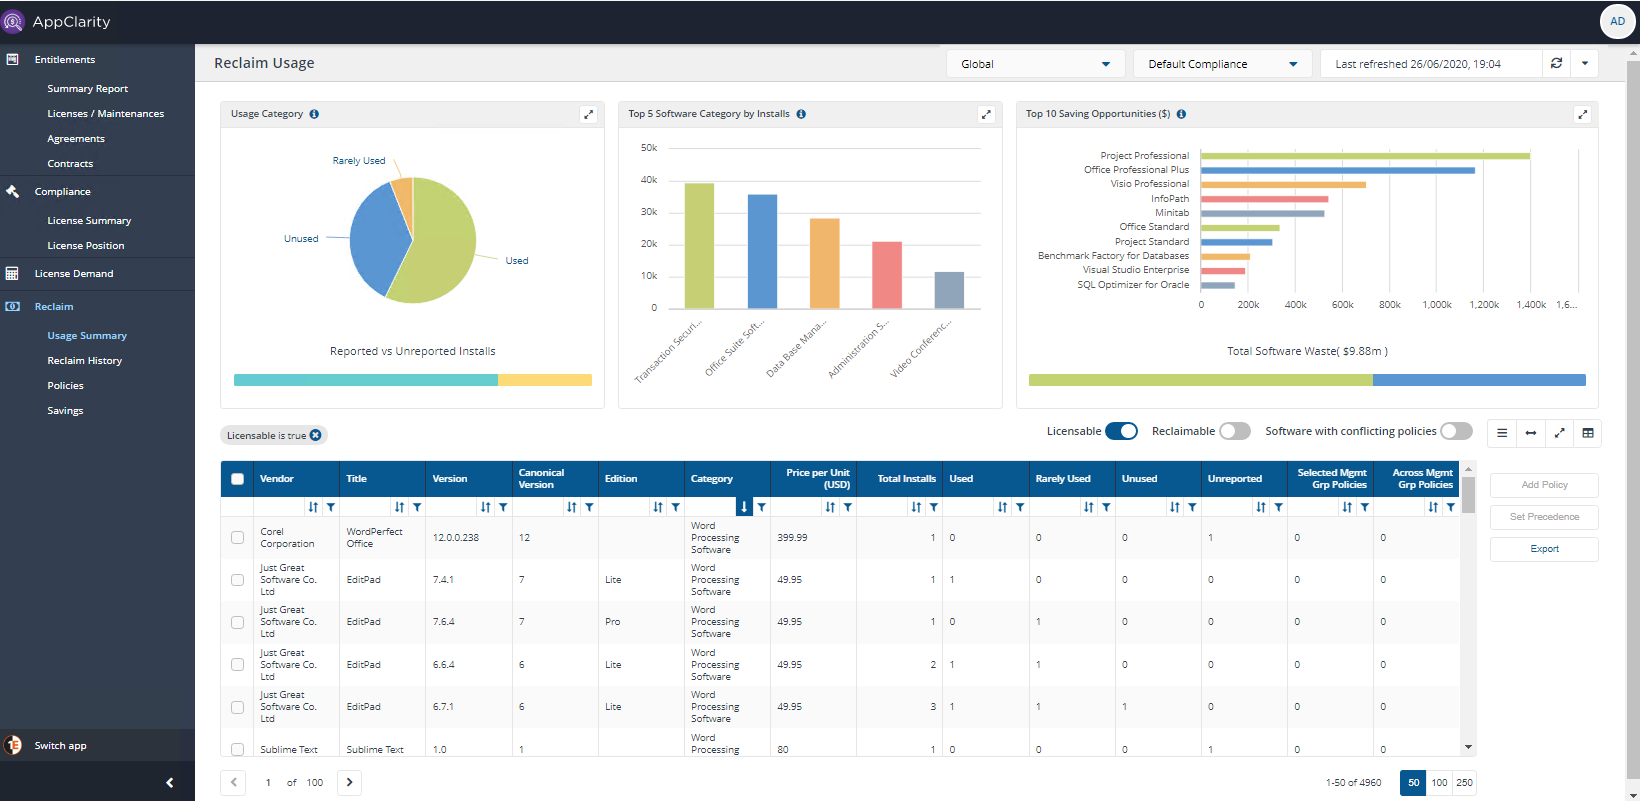
This page also displaysUsage Category and Reported Vs UnReported Installs, Top 5 Software Category by Installs and Top 10 Saving Opportunities ($) and Total Software Waste charts and a table showing vendor, title, version, colloquial version and edition for the product alongside a total that shows the number of installations for the product. There are also four columns for each of the usage categories Used, Rarely Used, Unused and Unreported.
To filter the table by Usage Category, Top 5 Software Category by Installs or byTop 10 Saving Opportunities click on the color bar for the category you're interested in, for example in our case there's 1,711 records in Unused software in Usage Category.
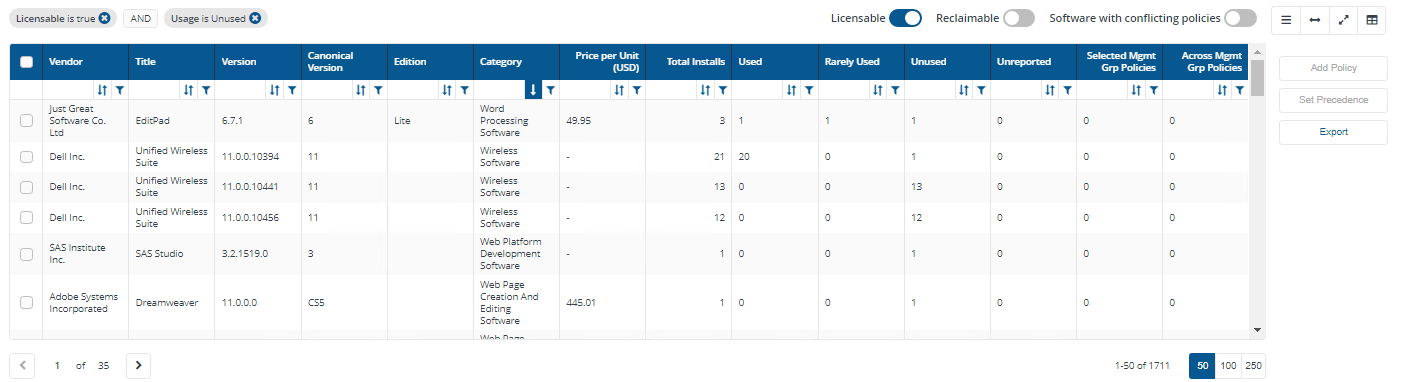
In our example let's investigate Office Professional Plus for example you could do this by filtering the table view by Category containing Office and by Edition containing Plus or if you know the version, by filtering on Version.
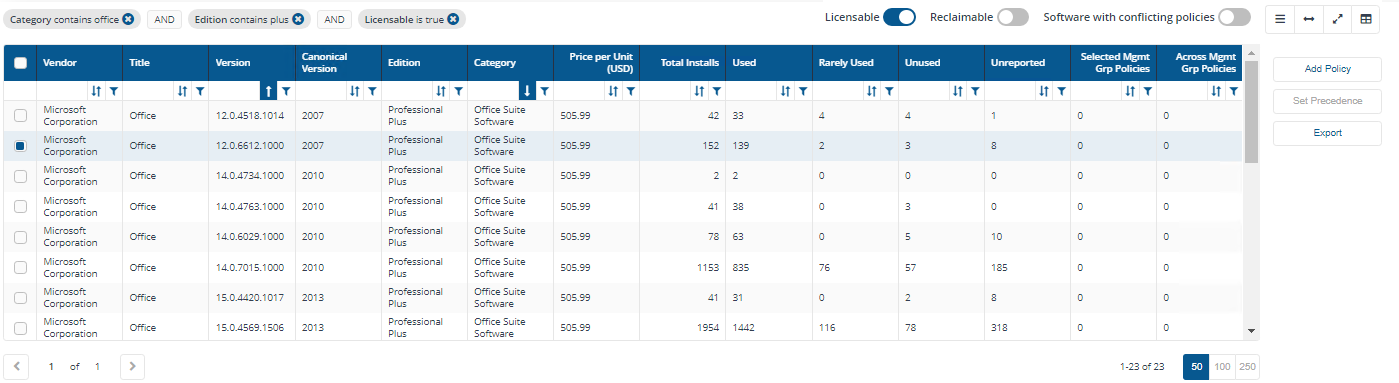
Now notice how there are different values for the usage categories. In our example on this page there are 139 Used, 2 Rarely Used, 3 Unused products. The difference between the two pages is down to the fact that this page displays just the reclaimable software, i.e. the software installed on workstations, and is filtered to display only licensable software on those workstations, whereas the Inventory→SLA Inventory→Product Usage page showed all the software installed on both workstations and servers.
In our example this shows us 3 prime candidates for reclaiming Office Professional Plus. To find out how you can reclaim these, refer to Reclaiming a product based on its usage.
In this example we've investigated product usage data and seen the differences between the SLA Inventory Product Usage and AppClarity Product Usage pages. We've also seen how we can focus on a particular product and investigate its rarely used and unused installations.
Note
You can change the default displayed currency from USD to a currency of your choice, refer to Changing the default currency in AppClarity for details.