Operational best practices
This section focuses on the operation of NightWatchman, providing best practices, tips and tricks from our own consultants and support engineers.
Using a NightWatchman baseline to identify power savings
This page describes the best practice approach and provides instructions to successfully implement a baseline in your NightWatchman Enterprise environment in order to calculate power savings. Every 1E Professional Services engagement consists of a baseline, manage and report phased process. 1E recommends customers use this process as best practice for NightWatchman Enterprise engagements.
Figure 1 – Baseline, manage and report phased methodology
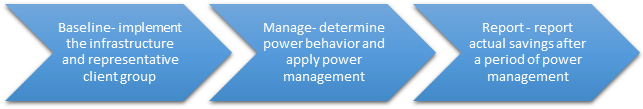
This approach enables you to optimize settings and demonstrate measurable savings as a result of deploying NightWatchman power policies.
A baseline is the average power consumption over a period of time that represents behaviors prior to deploying power policies (best practice is at least one calendar month). An accurate baseline allows savings to be accurately calculated by comparing power consumption after policies have been applied. Without a baseline it is not possible to calculate savings. The first part of your NightWatchman Enterprise implementation plan should be an evaluation of your current estate. This is achieved by installing the NightWatchman infrastructure and deploying agents to create a baseline of existing behaviours. This approach is designed to determine energy consumption without power management, either for all computers or a representative set of computers, reporting for a period of more than two weeks. A baseline of power state percentages is captured for this period.
After the baseline period, a similar length period will follow with power policies applied in order to compare the two periods and calculate savings. The design and negotiation of power policy settings is outside the scope of this guide. This manage phase will initially focus on reviewing the baseline data in order to determine a strategy for the design and deployment of power policies.
The final phase uses NightWatchman reports to demonstrate that NightWatchman is delivering measurable energy and cost reductions.
Baseline
This section gives a broad plan and best practices for implementing the NightWatchman Enterprise solution onto a representative group of computers to enable 1E Agents to report power consumption behavior from their respective hosts and create a baseline. This initial phase focuses on implementing the infrastructure, representative client group and capturing current energy usage without power management. The tasks contained in this phase below are critical for accurate measurement and enable for subsequent phases to be successful.
Baseline Period
The baseline period should be a minimum of two weeks but is typically one month, during which computer power consumption is monitored without any power policies applied. It starts when the NightWatchman agent has been deployed to the baseline group and reporting in. It is important the baseline period does not include holidays, which typically reflect less power usage. Each week included in the baseline should be a full 7 day week in order to capture power behavior during weeks and weekends. Baseline analysis uses detailed power data store in the NightWatchman database. By default, detailed data is automatically removed (groomed) from the database after 90 days leaving summarized data which is used for reporting. If detailed data needs to be kept longer than 90 days this can be extended in the NightWatchman SQL database by changing the ReportConsumption_KeepDays setting to the desired value in the tbNWM_Settings table.
NightWatchman Configuration Settings
Decide which features are necessary for your success to identify the appropriate server side and client side settings for NightWatchman operations (i.e. communications ports, etc.) The 1EAgent is initially deployed in 'reporting only' mode to determine energy consumption without power management enabled and with system tray icon switched off so that users are not aware the agent is installed.
User Communications
While capturing a baseline it is important the NightWatchman Project does not influence existing power behaviors. Users should be unaware of the NightWatchman Project at this stage and should not see the agent has been installed. If users think that NightWatchman is managing their computers they may change their behavior and start switching their computers off when previously they left them on, or leave them on when previously they switched them off. Changes in user behavior will be influenced later in the project when power policies are deployed and publicized.
In-Scope computers
The ability to produce an accurate baseline is often dependent on the ability to deploy the NightWatchman agent.
The scope of which computers should be included in the baseline is normally the same as the computers which will eventually have the NightWatchman agent installed, irrespective of whether they will be eventually managed by power policies.
The Project team should agree what percentage of computers should be reporting in before the baseline period starts. Ideally the agent should be deployed to 100% of computers prior to the start of the baseline period. Irrespective of how good the software deployment tool is, the last few percent always take the longest time to deploy! 1E WakeUp cannot be used to speed up deployment because the Agent has not been deployed.
If the number of computers included in the baseline is significantly smaller than the eventual scope, then it is very important the baseline group(s) are representative of the eventual scope. Consider the following when designing a representative baseline group:
computer Model – try to choose computers that provide the same ratios of computer model as used throughout the entire organization
Working Patterns – try to select several users from each department and role because of the way they use their computers. IT staff are usually not representative of the user population.
Time zones – if your organization has remote sites include some samples from those as well; there may be different behaviors depending on location.
Testing Power Policies
It is often desirable for power policies to be designed, tested, negotiated and piloted during the baseline period, and to test 1E WakeUp. Testing will affect the baseline, therefore number of computers involved should be kept to a minimum or excluded from the baseline. Including or excluding computers from the baseline group is achieved by using the NightWatchman Console location and/or organization groups, as described in section 2.5. It is important that these group structures are established prior to the baseline period to ensure power usage is reported against these groups.
Reporting
An organization may wish to report power usage and savings for different parts of their organization, for example geographic areas, divisions or office types. These different parts can be reflected in the NightWatchman Console location and/or organization structures, as described in section 2.5. It is important that these group structures are established prior to the baseline period to ensure the power usage is reported against these groups. This also makes it possible to create separate baselines for each part of the organization.
If deploying 1EAgent's to computers that will be excluded from power management, then it is good practice to identify these and assign to an Exclusion groups in the NightWatchman Console structure, so that they can be excluded from baseline if so desired. Power data collected from a computer by NightWatchman is permanently assigned to the building and department in which the computer is assigned, and this data is not re-assigned if/when the computer is re-assigned to a different building and/or department.
Development and Production environments
Server components are installed in a test environment and client software is packaged ready for deployment without power management. Sample computers are selected to receive the client software and reporting functionality is validated. This procedure is repeated in the production environment. A baseline can only be created in the production environment. The purpose of the test environment is for testing and validating the implementation before approving changes in the production environment.
Deploy 1E Agents in Reporting Only Mode
The 1EAgent client packages are deployed to the wider estate with an aim to install on 100% of computers.
The following 1EAgent installation parameters settings are relevant when deploying the agent in 'Reporting Mode'.
REPORTINGSERVER=<NWMMCSrv> – should be set to the FQDN or NetBIOS name for the server where NightWatchman Management Center Web Service is installed
REPORTING=ON – turns on reporting on the NightWatchman clients
SYSTEMTRAY=OFF – hides the system tray applet
These settings (apart from ReportingServer) can be modified later using power policies and from the 'Settings' tab in the NightWatchman Management Center Console. These are global settings which will affect all clients. However, Reporting should always be ON and should not be OFF at any point. Therefore if Reporting is set to OFF, no information is sent to the reporting server. This effectively disables the agent on all clients.
Gather Data
At this point, NightWatchman is installed and the 1E Agents have been configured. They will now be reporting power state and other client information back from their local host computers. You will have to leave them for a period of at least 2 weeks, long enough to gather sufficient behavioral information to accurately calculate the power savings that can be managed using NightWatchman.
The reporting only period will begin once all 1E Agents are installed on the representative group and are returning data to NightWatchman Management Center for a period of at least two weeks. The NightWatchman Management Center Analysis Reports Wizard which is run after the reporting only period, will initially search for 28 successive days where the majority of computers in representative group have returned data. So an optimal period would be a full calendar month.
Establish Grouping Structure in NightWatchman Console
Organization and/or Location grouping structures are created in the NightWatchman Console and used to group computers based on relevant criteria. They are used for granular reporting and deploying power policies including identified exclusions.
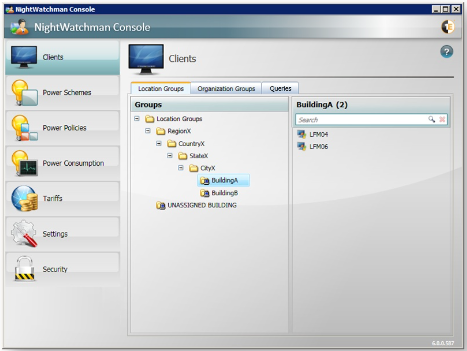
Each structure must have 5 tiers. By default, location tiers are called Region, Country, State, City and Building at the 5th tier. Organization tiers are called Company, Subsidiary, Division, Business Unit and Department at the 5th tier. computers are members of the lowest tiers building and department. The tier names, as they appear in the reports, can be changed as required in the NightWatchman SQL database by editing the values in the tbAFR_Lookup_TierLevel table. Do not modify any other part of this table except for the tier names. Location groups are typically used for reporting purposes and applying power policies based on Building/department according to the NightWatchman structure.
Figure 2 – Example Location Group structure based on Building
Organization groups are typically used to groups computers according to power policy assignment and identified exclusions.
Figure 3 – Example Organization Group structure based on Power Policy
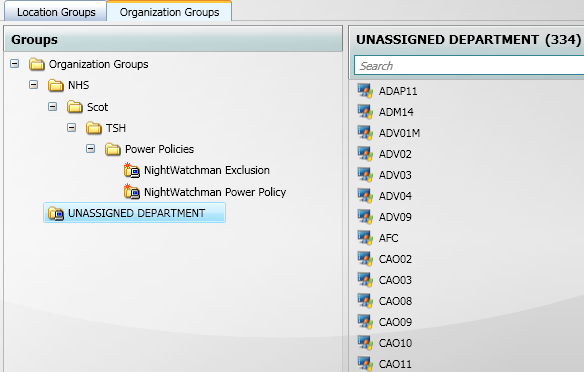
By default, computers appear in the UNASSIGNED BUILDING and UNASSIGNED DEPARTMENT groups. Membership of the tier 5 building and department groups may be managed manually, or automatically using the Group Import Wizard. The Wizard uses scripts to populate the groups based on rules and are capable of querying AD or 3rd party systems. The installation ZIP includes simple scripts for AD OU, AD Site, Subnet and Computername; each script uses a CSV lookup file to map source object to Console group. As part of a 1E Services engagement, custom scripts can be developed for the Wizard to assign computers to groups. To ensure consistency within the NightWatchman database, it is critical the Import Wizard is used when automatically assigning computers to groups, and SQL scripts are not used to directly manipulate group membership.
If a representative group of computers will be used to capture a baseline for the reporting only period then they must be grouped within their own container. The group can be created anywhere in the NightWatchman grouping structure as long as all the representative baseline group computers are contained within that group.
Update Hardware Power Consumption Values
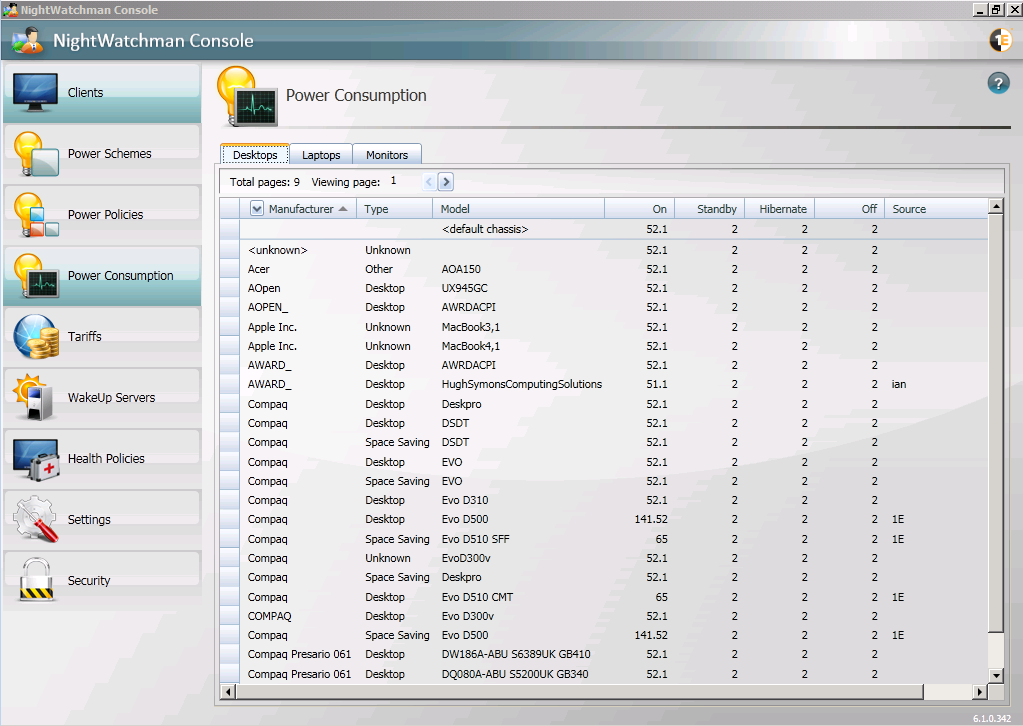
The NightWatchman Console maintains a table of all computer models and their kWh power consumption that is used for reporting of each of the power states and increases the overall accuracy of power, CO2 and cost calculations. By default every model reported has a default value of 52.1 Watts. These must be updated to accurate values before starting the baseline period otherwise when we capture the baseline, the usage data will be skewed because power consumption data will not be accurate but usage of the computers will remain the same.
NightWatchman Enterprise optionally uses ActiveEfficiency to automatically download power consumption values. If ActiveEfficiency is not used, then the values must be manually applied either using the NightWatchman Management Center Console for each computer model, or as a batch using a SQL script obtained from 1E Support. You can get more detailed information on the SQL batch method in "How to Get Power Data from 1E Support".
Note: The following applies when using either of the methods described above. 1E Support has a database that contains power consumption figures for many common computer models. However 1E support will not have details of all the models. The figures have been obtained directly from manufacturer datasheets. 1E Support currently does not provide power figures for monitors. This process should be performed after agents have been deployed to the majority of clients and reported their inventory.
Importing of Model specific power consumption values into the NightWatchman database will help achieve more accurate power, cost and CO2 reporting. Changes to power consumption (Wattage) values are immediately reflected in all kWh, CO2 and Cost reports therefore these values should be changed from their default values before any reports are finalized.
Figure 4 – Example Power Consumption Values for Desktops after Agents Deployed
Configure Tariffs
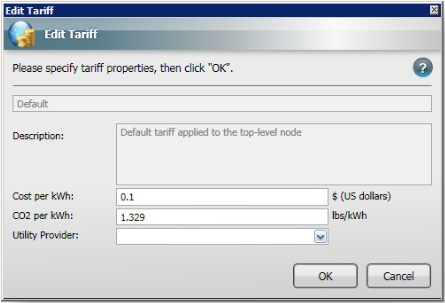
Tariffs define cost and CO2 emissions and apply to location groups to allow more accurate reporting of costs based on local charges. Each tariff consists of a cost and a quantity of CO2 produced per kWh of electricity used and optionally the name of the Utility Provider providing the electricity at that cost. There is a default Tariff that is used in the absence of any other applied Tariff and this is set to 0.1 dollars per kWh and 1.329 lbs per kWh. Modify these values to the values according to your utility provider.
Figure 5 – Default Tariff
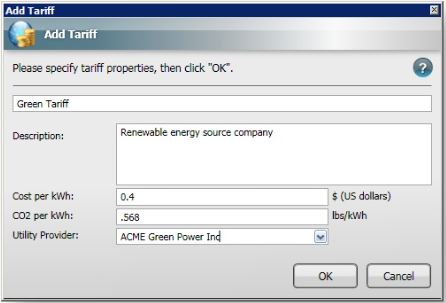
If you have specific locations that use particular providers you can create a tariff which can be applied to the computers in those locations in the grouping structure. For example, the following dialog shows a new Green Tariff being created for the ACME Green Power Inc. Utility Provider whose energy costs 0.4 dollars per kWh and results in 0.568 lbs of CO2 per kWh of electricity generated.
Figure 6 – New Tariff
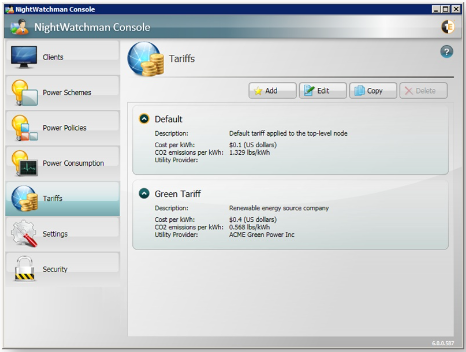
The following illustrates the new and Default Tariffs in the NightWatchman Console.
Figure 7 – New and Default Tariffs
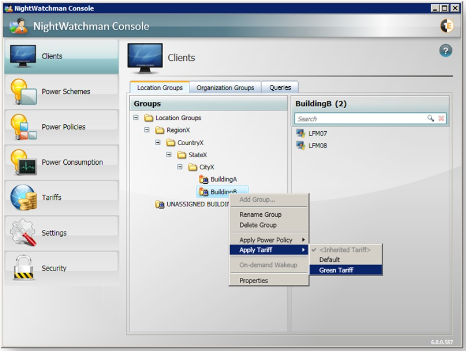
Now the Green Tariff created earlier can be applied to BuildingB. To do this, right-click and select the Tariff from the Apply Tariff sub-menu.
Figure 8 – Apply Tariff to location group
The choice of currency (default $) and quantity (default lbs) are configurable settings in the NightWatchman Management Center Console. These apply to the whole organization and to all tariffs. NightWatchman does not use currency exchange rates, or use different tariffs for different days, therefore costs must be manually calculated and specified in tariffs for different parts of the organization.
NightWatchman does not use tariffs that have different costs at different times of day. If hourly tariffs are being used, then it is good practice to specify an average cost for the period of time you expect computers to be on. For example, if there is a daytime tariff charge of $0.1 per kWh and an evening tariff charge of $0.3 per kWh, the tariff can be averaged out to $0.2 per kWh.
Assess
Whilst current power usage behavior is being gathered during the reporting only period, suitable power policies are being developed ready for deployment in the next phase with a view to determining preferences for scheduled actions and power management policies. Communications are sent out to the business and/or individual users in order to identify any exclusions or any other deltas in normal working patterns. Power policies are applied to test computers (that are outside of the representative baseline group) in order to validate functionality.
Manage
After the baseline period, this phase will initially focus on reviewing and understanding the energy consumption, usage data and power state percentages from the representative baseline group to provide a baseline indication of current power usage without power management. In some cases it may be desirable to have more than one baseline if you want to produce savings reports for different groups instead of the whole organization.
The power management strategy will be implemented by deploying power policies. The design and negotiation of power policy settings is outside the scope of this guide. However, it is best practice to try to keep the number of power policies to as few as possible.
Run the NightWatchman Analysis Reports Wizard
This report is used to estimate potential future savings that could be achieved based on specific conditions such as global shutdown and wakeup times. This report requires that the 1E Agent has been installed in reporting only mode without power policies on the representative baseline group for a period of at least two weeks.
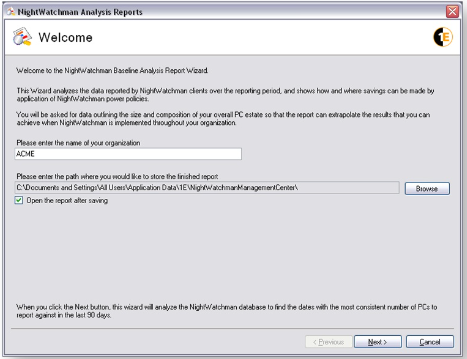
This report uses data returned by the 1E Agents during the reporting only period to generate figures for a report which details estimated savings based on the reporting only period that can be made by implementing an automated nightly power down routine on the represented group of computers. It then extrapolates these findings to cover all of the computers in the network. In the Welcome screen, enter the name for the organization that the report is intended for. Choose the default directory where the file is saved and open the report after it is saved.
Figure 9 – Analysis Reports Wizard Welcome screen
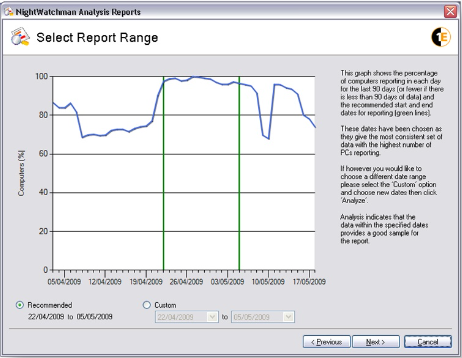
On the Select Report Range screen select a sample of data that represents where the majority of computers on the network reported in with minimal variation on the number of computers reporting. This forms a sound basis for analysis to determine the amount of savings that can be made. By default the wizard searches a period of 28 days; if it cannot find anything that meets the criteria it will search for a period of 21 days. If that fails, 14 days and finally 7 days. If no suitable data set is found, you will need to manually choose the reporting only period.
Figure 10 – Analysis Reports Wizard Select Report Range screen
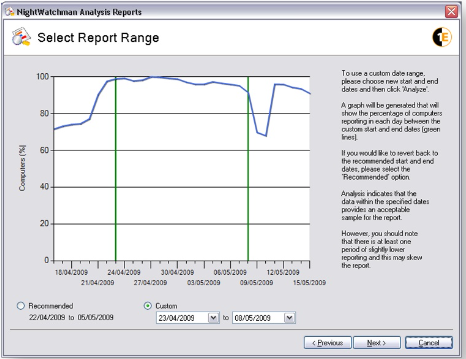
If you need to report on a particular data range, chose Custom, enter the start and end dates for the report and click Analyze. In this example, the data is mostly suitable except for a dip in the number of computers reporting in towards the end of the selected period. The comment in the wizard on the right of the graph mentions that the data is acceptable but the period of slightly lower reporting may skew the results of the report.
Figure 11 – Analysis Reports Wizard Select Report Range screen with Custom date range
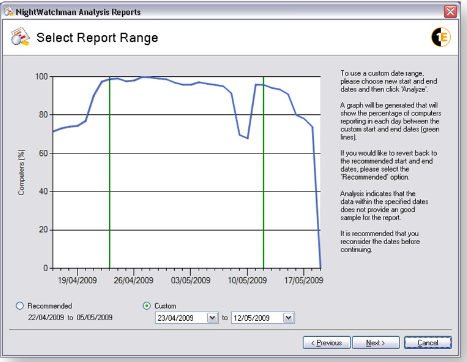
The example below shows a later end data for the report, this time including a more pronounced dip in the number of computers reporting. The analysis warns that this may not be a suitable period to report on and recommends that the data range is modified before continuing.
Figure 12 – Analysis Reports Wizard Select Report Range screen with Custom date range
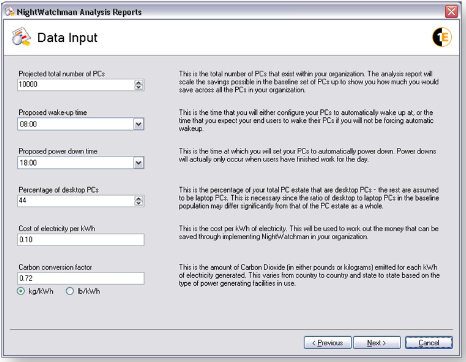
Having selected and analyzed a date range, click Next to go to the next screen. The Data Input screen is where you set the context for the report. By setting the number of computers NightWatchman runs on and how it is used to control power downs for inactive computers, the report generator can calculate the savings made and extrapolate these to the network as a whole. Specifically on the Data Input screen, set the following:
The number of computers in your organization
The proposed wake-up and power down times
The percentage of computers in your network that are desktop computers compared to laptop computers
The cost of electricity per kWh in your locality – this will be marked using the local currency of the computer where the report is being generated
The carbon conversion factor in your locality
The units of carbon conversion, either kg/kWh or lb/kWh
The example below shows a network where there are 10,000 computers running NightWatchman. The wake up and power down times are 8 AM and 6 PM respectively. 44% of computers are desktops. The cost of electricity is 10 cents per kWh and the carbon conversion factor is 0.72 kg/kWh.
The default value that appears for Projected total number of computers is the total number of computers that reported into NightWatchman during the period selected in the Select Report Range screen. The graph in the Select Report Range screen shows the percentage of these computers which reported in each day during that period.
Figure 13 – Analysis Reports Wizard Data Input screen
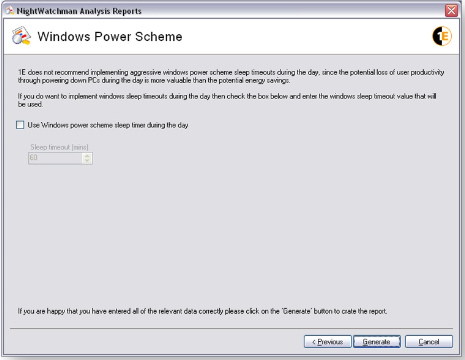
After the inputs for the report, click Next. Next in the Windows Power Scheme screen, choose whether the report should include periods where an aggressive Windows power scheme is set during working hours. One to think about carefully as there is a trade-off between saving extra energy and potential impact on user productivity through having computers powered down during working hours during periods of inactivity. If you check the option and set a timeout for the power scheme an additional heading will appear in the generated report detailing the savings to be made from implementing the scheme.
Figure 14 – Analysis Reports Wizard Windows Power Scheme screen
Once you've entered in all the data, click the Generate button (a Report progress screen is displayed and depending on the amount of data represented in the data set, this can take between one to three minutes). Once the report has been generated review the following information:
Potential annual kWh savings
Potential annual cost savings
Potential annual CO2 savings
Review the report focusing on the User Behavior graphs showing usage behaviour during the working week and weekends along with savings calculations and hardware types. The Potential Savings section contains graphs depicting savings that can be achieved if a scheduled power down occurs given the current user behaviour. This report is from the perspective for the whole organization not just the representative baseline groups.
Creating a Power Behavior
A power behavior is the average proportion of time-in-state over a given date range, split by desktops and laptops, and also by weekend and weekday. A power behavior must be created to represent user behavior for the reporting only period when power management was not in force. It is used by NightWatchman to calculate savings that have been made due to the implementation of power policies by comparing new behavior with old.
The Power Behavior can be created in the NightWatchman Reports Console. Click Savings from the Report Categories menu. Click Weekly NightWatchman Savings from the Savings from Power Behavior menu. In addition to this report, Power Behaviors can be created from within the Yearly NightWatchman Savings and Yearly Utility Provider Savings – kWh reports. Click the Manage Power Behaviors button, click Add. Input the following fields:
In the Name field type a name for the Power Behavior
In the Description field type 'Reporting Only period without power policies'
In the Location Level field ensure that 'All' is selected
*if a representative baseline group has been created then select this group
In the Organization field ensure that 'All' is selected
*if a representative baseline group has been created then select this group
By being able to select different organization and location group, it provides the ability to create multiple baselines but only if you have created the relevant group structures. Therefore it is important to create a group structure according to how you think you will be deploying power policies.
At the Start Date field, select an appropriate date when a large percentage of the representative baseline group had the 1E Agent installed without power policies
*you are limited to profiling 90 days' worth of historical data
At the End Date field, Select an appropriate date at the end of the baseline period when a large percentage of the representative baseline group had the 1E Agent installed without power policies
At the Review power behavior details before saving dialog, check the details for the number of laptops and desktops and compare the weekday to weekend for the time in state details. At the 'Wizard – Manage Power Behaviors' dialog, select the Power Behavior and click the 'Table View' tab to display the calculated figures behind the time in state values.
The example Power Behavior in Figure 15 is based on 111,024 desktops and 41 laptops reporting in power state information from all locations during the period 1st September to 30th September 2013. Figure 15 – Example Power Behavior in Table and Graph view
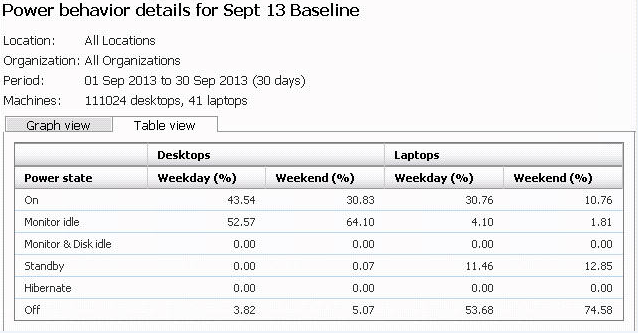
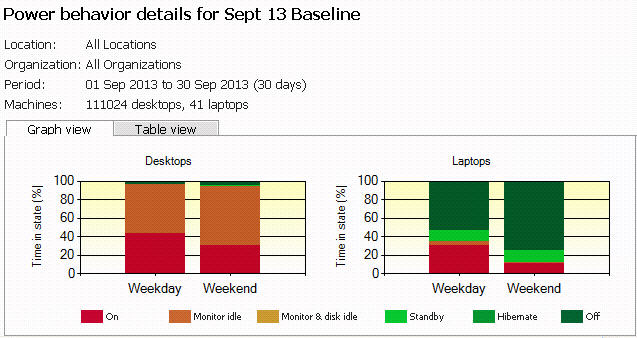
Note: The graph view can be compared with the 'Time in State' report in section 4.2 to understand differences in time in state percentages over different months. Notice how the time in state percentages are also similar to those listed in the time in state report.
The 'monitor idle' power state translates to the computer being powered on but with the monitor in standby. i.e. the computer is on but not being used. The 'monitor idle' state percentage of 53% supports the fact power management was non-existent in the computer estate. The data showed that savings were obtainable by reducing the length of time computers spent in the 'On' power state. It is worth noting that prior to implementing power policies, only a small proportion of the user base already power down their computers when not in use. It can be seen that prior to implementing power policies, desktops were in the 'off' power state for 4% during the week and 5% during weekends.
This Power Behavior gives a feel for how computers are behaving on average in terms of percentage of time spent in power states. One use for this is to determine a baseline (how computers behave before power management is enforced) and then compare this to current behavior to calculate how much power has been saved by using NightWatchman.
Apply NightWatchman power policies to representative group
Power polices are targeted at computers including exclusions where required. Policies are typically rolled out using a phased approach using a small number of pilot computers and then extending to a wider audience when confidence grows. During this phase, policies may be fine-tuned depending on observed behavior and feedback from users'. After policies have been finalized and applied to the whole of the environment (or representative baseline group), a period of more than 2 weeks occurs in order to gather the new energy usage data (best practice is at least one calendar month).
Following completion of these tasks and depending on the progress of agent deployment and the duration that power policies have been active, the final report phase will commence after power management has been applied to the majority of the environment for at least the same period as with the baseline period (best practice is at least one calendar month).
Create and apply power management policies with the desired shutdown time to the representative group with a view to applying to the wider representative group.
Validate that savings start to appear in the standard NightWatchman savings reports ensuring that the Power Behavior is selected. This requires applied power management policies for more than one day to the representative group of computers.
Report
The final phase uses NightWatchman reports to demonstrate that NightWatchman is delivering measurable energy and cost reductions. This phase will commence when power management has been applied to the majority of the environment for at least the same period as with the baseline period (best practice is at least one calendar month).
Comparison
Standard NightWatchman reports are run in order to calculate savings achieved. These use the power behavior created at the start of the manage phase as the measurement for comparison.
Other standard reports are used to understand the behavioral differences including; 'Time in State', 'Successful Shutdowns' and 'Uncompleted Shutdowns' reports.
Time In State Report
The following example report shows observed computer time in state for all computers for the period associated with the NightWatchman implementation. This report is available through the NightWatchman Management Center Report Console.
Figure 16 – Example Yearly Time In State report
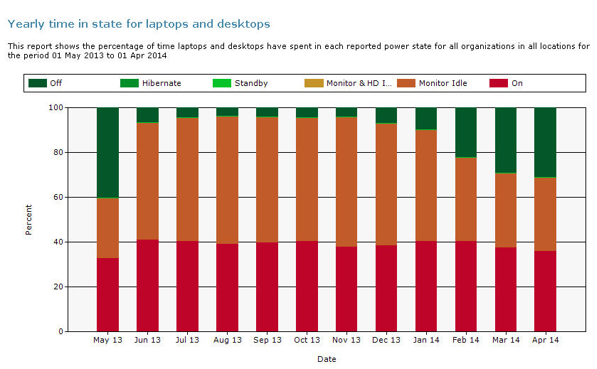
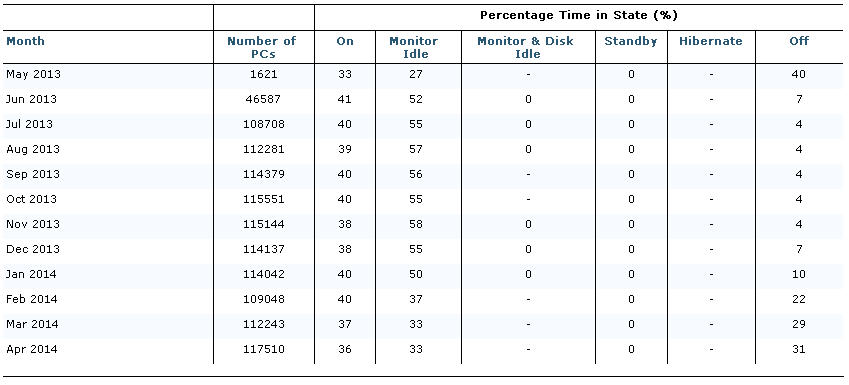
It can be seen that for the month of April 2014 where power policies are being applied across the whole estate, these is an increase in the time computers spend in the 'off' power state from 4% to 31%. Using the associated numbers from the baseline period in September 2013 (where no power policies were applied), and comparing to April 2014 during the manage period (where power policies were applied), there is an increase in the time computers are in the 'off' state (from 4% to 31%).
The 27% increase is a result of applying the various power policies causing computers that were previously in an 'on; state to change to the 'off' state via NightWatchman scheduled action to gracefully shutdown the computer.
Note how the column and percent data for September is similar to the Power Behavior in Figure 15, however the Time In State reports do not differentiate between desktops and laptops or weekdays and weekends.
Weekly Savings NightWatchman Savings Report
The following example report shows savings calculated using the Power Behavior and actual reported energy usage for computers in all locations during the period 28th April to 4th May 2014. This report is available through the NightWatchman Management Center Report Console.
Figure 17 – Example Weekly NightWatchman Savings Report
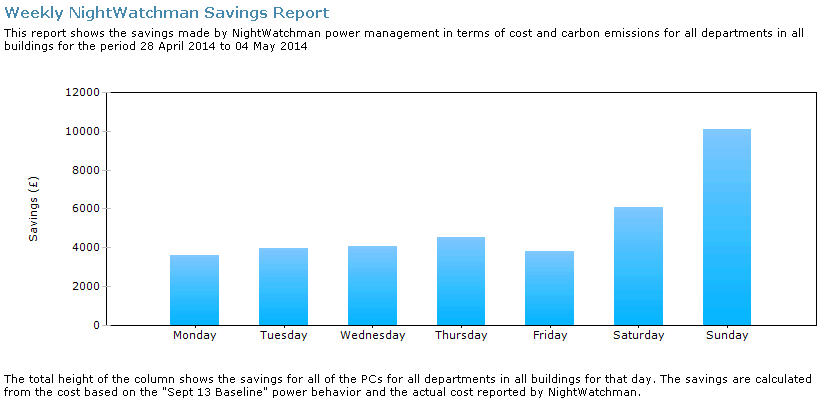
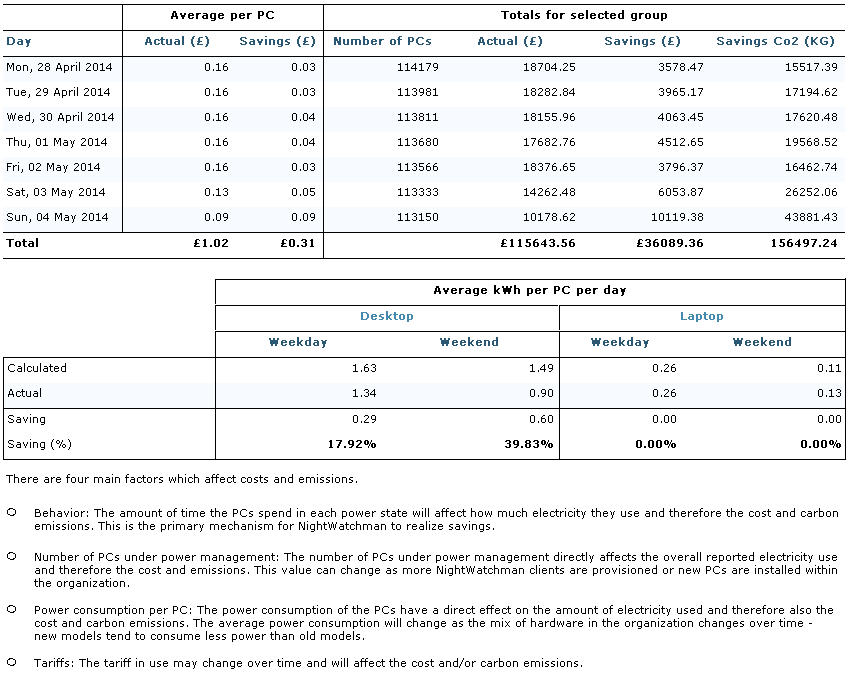
This time period shows weekly savings of £36.089.36 based on approximately 113,671 computers reporting in during this period. This equates to a weekly saving of £0.31 per computer. Breaking this information down into computer type, it can be seen that a higher proportion of savings are achieved during the weekends.
Yearly Savings NightWatchman Savings Report
The following example report shows savings calculated using the Power Behavior and actual energy usage for computers in all locations during the year 2014. This report is available through the NightWatchman Management Center Report Console. The report echoes the power consumption of the computers based on hardware model as well as the electricity Tariff.
Figure 18 – Example Yearly NightWatchman Savings Report
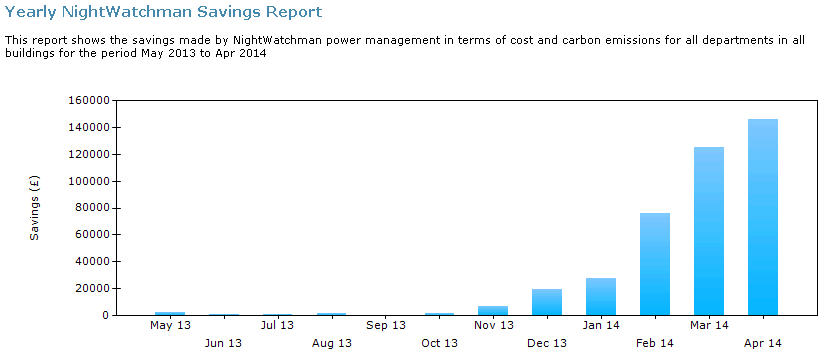
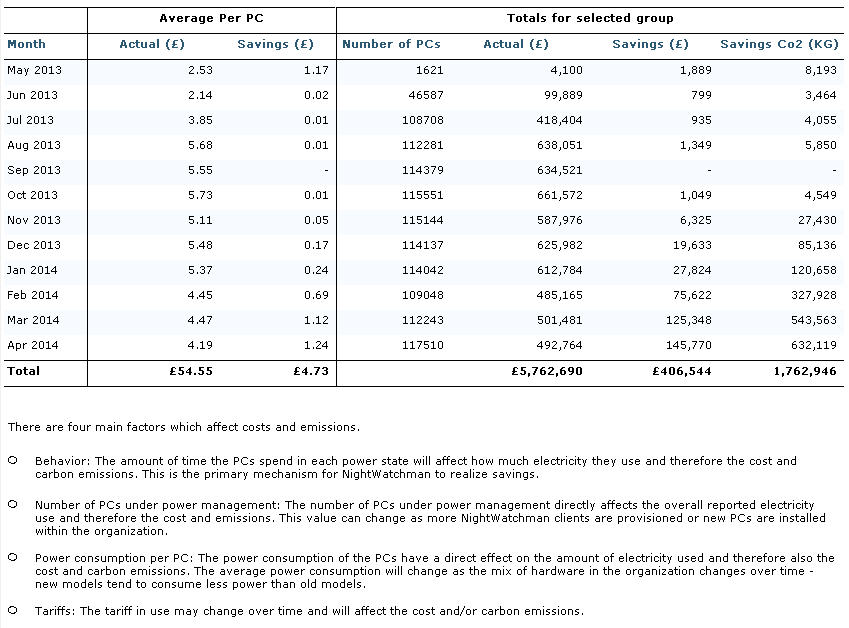
The report shows some savings during January when power policies were beginning to be rolled-out across the production environment, and savings for April where power policies were applied to all computers (except for identified exclusions) for the full calendar month. Savings are based on comparison with the baseline taken in September, which is why September shows zero savings. 'Savings' for earlier months is because the computers reporting in then had a different power behavior to the majority of clients reporting in September.
Using the Reboot Summary report to improve your reboot strategy
Your organization should have a computer reboot strategy in order to:
Balance the urgency of security updates with the importance of user productivity and satisfaction
Ensure that relevant teams have a consensus on how to handle various kinds of security updates and other activities that require reboots
To ensure that tools that manage reboots (such as Microsoft System Center Configuration Manager) are used appropriately
Give your end-users a predictable experience
The NightWatchman Reboot Summary report allows you to improve your reboot strategy by allowing you to understand.
When are your computers being rebooted and how extensively?
Is that the activity level you and the security department expected?
Are users adversely affected by reboots?
How long are those reboots taking?
Are users likely to be disinclined to reboot when asked due to long reboots?
If you allow users to choose when to reboot after you've applied changes (and thus those changes are "pending"), how many reboots are pending now?
How many in the recent past?
How long do reboots pend? Is that acceptable?
By reviewing the Reboot Summary report you can understand your organization's actual reboot experience. Does it match what you would be expect from your reboot strategy? You should review the report with your security department to ensure that reboots pend (and thus security vulnerabilities are still open) according to their expectations. You should review the report with people responsible for the end user experience and productivity to ensure reboots are occurring at an acceptable rate.
The answers to these questions will also vary over time. And some business units or regions might be more cooperative (or more adversely affected) than others. Some computers might be more affected than others. The Reboot Summary report allows you to drill down on the above questions to fine-tune your reboot strategy.
Based on what you and related teams find, you might want to:
Talk to business units or regional coordinators to encourage more rapid reboots by users
Use ConfigMgr or similar tools differently to reboot more or less frequently
Improve your computer startup scripts or similar technical elements involved in the computer reboots
Opportunities to improve to improve your reboot strategy
The following graphs illustrate hypothetical examples of reboot-related activity for 3 months at an organization with over 12,000 clients. On this page we have:
Reboot Clients per Day
Reboot Speed
Pending Reboots
How Long Reboots Pend
Next Steps
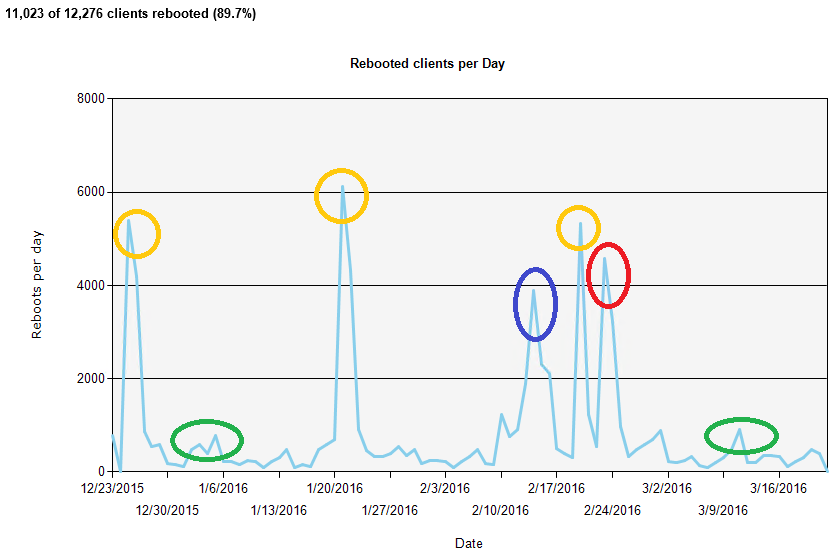
Rebooted clients per day
The organization illustrated in this graph does a week of testing of software updates released on Microsoft's "Patch Tuesday", then installs them on all applicable computers in the organization but allows up to a week for the users to reboot the computers. Some users reboot in that week but many wait for the reboots to be enforced.
The orange circles indicate the peak days when reboots are enforced for Patch Tuesday. In this case the behavior is as expected and is probably acceptable, though it would be good to encourage more users to reboot voluntarily at their convenience.
The red circle indicates a large number of reboots soon after the third Patch Tuesday. This might be surprising and could indicate that some of the changes during that Patch Tuesday induced a second round of rebooting for many users. That was likely frustrating for the users, so it would be ideal to avoid that if possible.
The blue circle indicates a large round of rebooting not related to Patch Tuesday. There was a lot of rebooting in the days before and after the peak, so almost the whole organization was affected. This might have been necessary due to an important company-wide release, but it might have also been due to a poorly configured deployment. The deployment could also have been phased over a longer period in order to spread out the effect on the business unit activities. The event should be reviewed to look for opportunities to improve the reboot strategy.
The green circles indicate other periods of increased reboot activity but are not nearly as concerning as the period highlighted by the blue circle.
 |
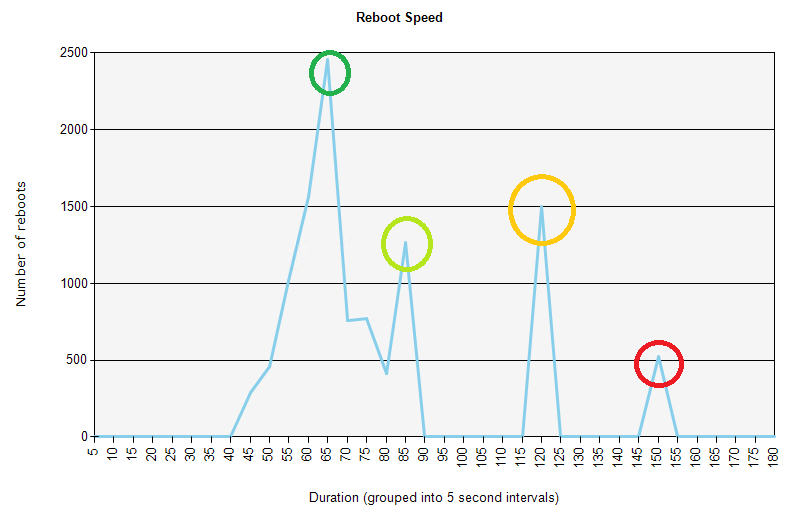
Reboot speed
In this example we can see that most computers reboot in 60 seconds, with a bell curve of some computers rebooting a little faster or a little slower than that. That is reasonable.
There is a large number of computers that are an exception to this and take about 85 seconds to reboot. When you investigate you might find that these are older computers that are due to be replaced anyway.
The orange circle highlights a spike that is a concern in that there are a large number of computers taking two minutes to reboot. That is likely frustrating to users and could discourage them from rebooting when needed for security updates or other reasons. That should be investigated in order to understand why they're taking two minutes and how that can be improved.
The red circle highlights another concern where some computers are taking 2.5 minutes to reboot. The number is much smaller than the issue illustrated by the orange circle but it is also worth investigating.
 |
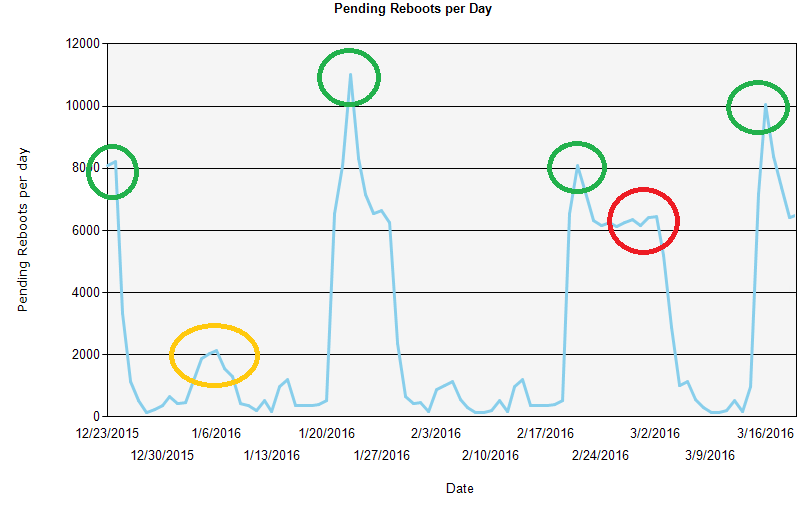
Pending reboots
The pending reboots graph shows how many reboots are currently pending (about 6500) and how many were pending. In this example we see spikes as Patch Tuesday updates are installed. The number quickly decreases for up to a week as some users voluntarily reboot. The number then dramatically decreases as reboots are enforced after one week.
However, Patch Tuesday deployment enforced in late February had pending reboots for much longer than normal (the red circle). This could be a serious failure of the reboot enforcement mechanism. Possibly the deployment was misconfigured.
There was also an unusual spike in pending reboots in January. However, it is not very large, so maybe it was just a special deployment for a subset of computers that needed a particular improvement.
 |
How long reboots pend
Here we can see that many reboots pend for a week (the green circle), which is the period from when the Patch Tuesday patches are installed and reboots are enforced. However, there are also a lot of reboots done right away or in the first 4 days, as seen in the light green circle. Those reboots are done voluntarily by the users at their convenience.
The most concerning issue in this example is that there are a considerable number of reboots that take close to 4 weeks. These are likely unacceptable to the security department and may be enforced by a tool they are using. Work should be done to minimize that spike, such as improving earlier reboot enforcement effectiveness and encouraging better user behavior.
Next steps
To investigate issues such as those illustrated, you should get a list of computers that where affected from the NightWatchman data. You can then check a small subset of those computers to understand the root cause or causes. If all or most of the computers in the subset you check all have one or two root causes, it's reasonable to extrapolate that those are the root causes of the issue as a whole. The size of the subset depends on how consistent the issue is and how comfortable you are with the explanation. Often 5 to 15 computers are enough, but you might want to check 30 or more. Depending on the nature of the issue, you might talk to the affected users, check the event log on their computers, or review the specifications and configuration of their computers.
Using Power Optimization reports to maximize the benefits of battery-enabled devices
Your organization has likely used laptops and ultrabooks for a long time, probably in large numbers. You might also be using tablets, convertibles, two-in-one's, or similar devices. Such computers are intended to be very mobile and thus include batteries for power especially when the user is away from their desk. Generally the battery-related functionality works well but there can be issues. NightWatchman Power Optimization allows you to understand how well such functionality is working and to proactively correct problems.
Issues related to battery-enabled devices include:
Batteries do not last forever - repeated discharging and recharching breaks down their chemistry
Batteries have finite power and thus might not have enough capacity for how your users use the devices
Modern devices can provide a smartphone-like experience (connected even when on standby, very long battery life when on standby, and true instant-on productivity). However, that functionality can have problems:
The device might not be connected to the network when on standby and therefore incoming notifications are missed
Similarly, when the device is turned back on a sync cycle must be done to update the e-mail inbox and similar data sources, delaying the user
Deepest standby might not be achieved and so the battery is drained faster than it should when on standby
Even if the device is connected while on standby, it might check for new data too frequently, draining the battery unnecessarily. Or it might check too infrequently, causing the user to have to sync the device when it's powered on.
Those issues cause problems for your organizations in several ways:
User productivity and satisfaction is decreased. Users cannot be productive when they want to or need to, and could be seriously frustrated
You are not getting full value from the new technologies you're deploying
The helpdesk has to work on issues that should be proactively corrected
You cannot proactively budget to replace batteries (or devices) as the batteries reach end of life
Or you are replacing batteries and devices before they have actually neared end of life.
By using NightWatchman Power Optimization reports you can determine the extent of such problems in your organization. You might find that some problems are more common in some business units or regions, possibly reflecting the special behavior and needs of those users, or the device choices they have made.
You can work with the people responsible for selecting and purchasing devices to ensure they are acquiring the models that you have seen to work best in your organization. They can discontinue the acquisition of devices that are performing poorly. You can also ensure that the finance people have budgeted appropriately based on the battery decline your users' devices are actually experiencing.
Where you find configuration issues, you can work with your organization's technical specialists to update firmware, drivers, or configuration details. You might also identify software that behaves poorly and that should be reconfigured, updated, or replaced.
Note
For computers with multiple batteries, the battery-related statistics reflect the aggregate of the batteries, as opposed to the individual batteries. For example, a computer where one battery got to 40% of capacity for one battery and 75% of capacity for the second battery would not be considered to have gotten to less than 50% of capacity (because the average of the two is 57.5%).
To understand more about battery-enabled devices please refer to Understanding Power Optimization.
Opportunities to improve your battery enabled devices
The following reports illustrate hypothetical examples of battery-enabled issues at an organization with over 12,000 clients. On this page we have:
Power Optimization summary
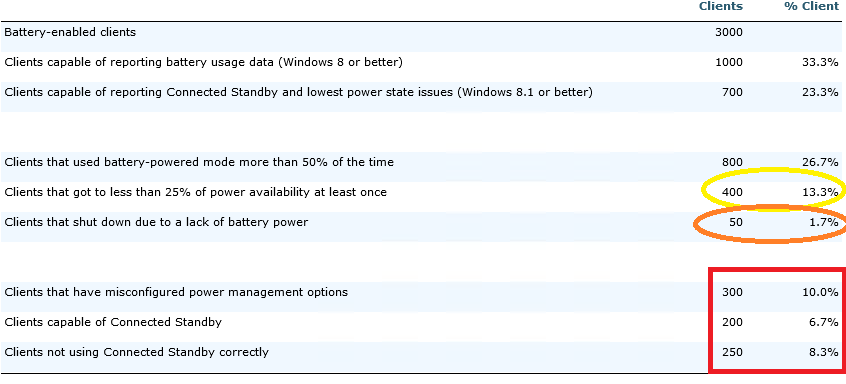
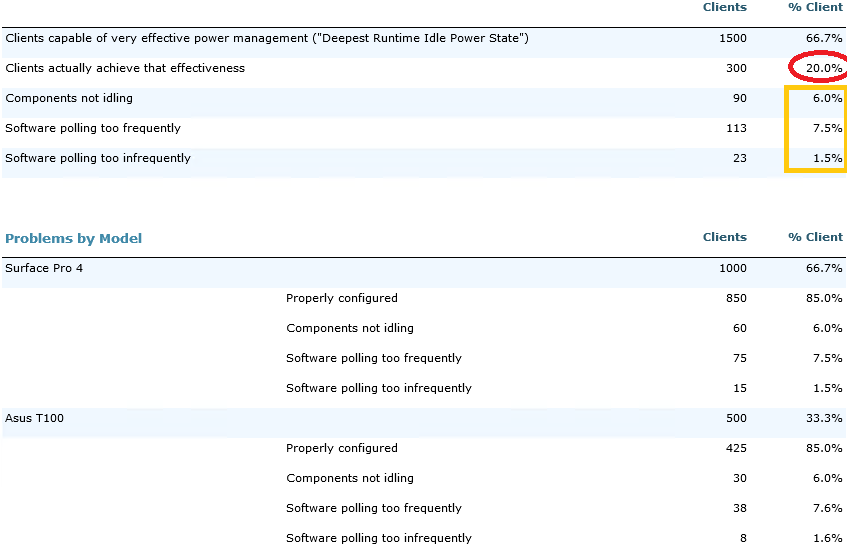
The Power Optimization Summary report shows you a quick summary of your battery-related devices and a quick overview of the issues that your other Power Optimization reports might indicate. It's a good place to start, or to share with people who only need an overview.
In this example we can see that a sizable fraction (26.7%) of this organization's battery-enabled devices are used while on battery over half the time. This organization uses such devices quite substantially and should ensure they regularly review their Power Optimization reports.
We also see that 13.3% of such devices get to less than 25% battery power availability during the week. Thus their users might be spending more time than they should worrying about battery levels and ensuring the devices are charged. Fortunately only 1.7% actually run out of battery each week, which is unfortunate but probably acceptable.
Of their devices that are capable of a smartphone-like experience, they do have substantial fractions experiencing technical problems. Those should be corrected.
 |
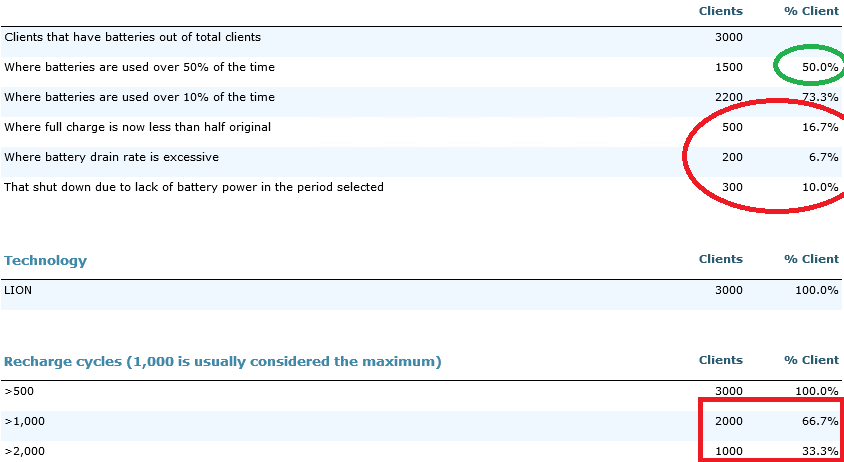
Battery details
In this example we can better understand the batteries being used by laptops, ultrabooks, and devices. In this case we can see that some users do experience battery-related issues, with the worst being that 16.7% of devices are getting less than half their original charge capacity. In other words, computers that used to last 4 hours on a charge now last only 2 hours. That's got to be frustrating and will only get worse in the coming months. They should plan to replace those batteries or devices.
The red box further reinforces that point by demonstrating that very high fractions of computers have batteries that have been cycled (discharged/recharged) more than is usually acceptable.
 |
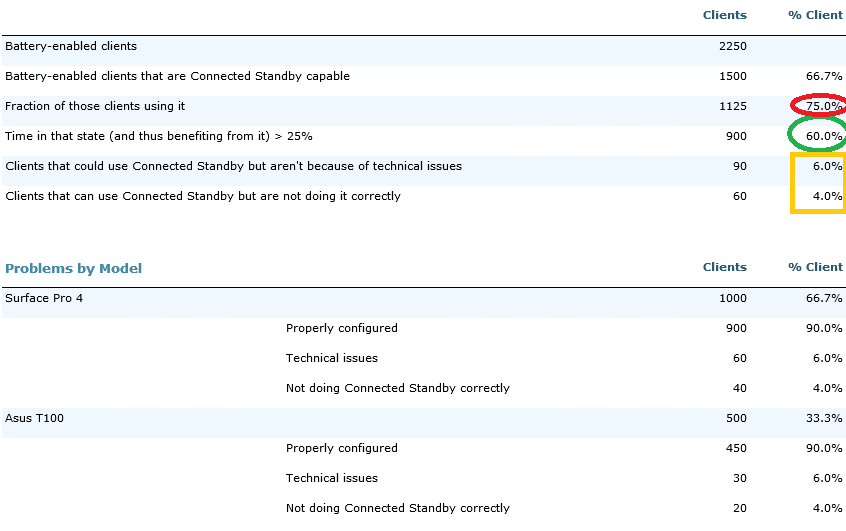
Connected Standby
The following example shows an organization with many 'modern' devices (tablets, 2-in-1's, etc.) and that they are being used that way. However, there are substantial fractions that are having technical issues that should be investigated.
The issues are broken down by model so that they can determine whether certain models work better for this organization than others. In this case only two models are being used, and they're behaving the same. However, in both cases there are clients that aren't able to provide their users with the benefits of connected standby. Those users might be missing Skype calls, instant messages, or similar notifications when they shouldn't. That should be corrected.
We also see that some devices are using connected standby but are connecting too frequently or not frequently enough. Those users either have to sync their devices unnecessarily when they first start them, or the battery is draining faster than it should. The next report will distinguish between those two possibilties.
 |
Lowest power state
The devices that are capable of the lowest power state could use as little as 50 milliamps per hour while in standby (while still being connected) if they are configured properly. That's much better than the typical 300 milliamps per hour than traditional standby uses on them. In this example we see an organization where the lowest power state is almost never being achieved when it should.
We can see in the orange box that some issue is due to components not idling properly. That could be due to bad firmware or device drivers. It could also be due to bad hardware design.
Other devices are either checking for new e-mails etc. while in standby too frequently, causing the battery to drain too fast. Others are checking too infrequently, causing the users to sync e-mail on power up before they can get their latest messages.
 |
Next steps
To investigate issues such as those illustrated, you should get a list of affected computers from the NightWatchman database. This set of SQL queries allows you to do that: Power Optimization Details.sql. You can then check a small subset of those computers to understand the root cause or causes. If all or most of the computers in the subset you check all have one or two root causes, it's reasonable to extrapolate that those are the root causes of the issue as a whole. The size of the subset depends on how consistent the issue is and how comfortable you are with the explanation. Often 5 to 15 computers are enough, but you might want to check 30 or more. Depending on the nature of the issue, you might check the powercfg.exe reports on their computers, look for new device drivers or firmware from the vendors, or review the software and configuration of the computers.
Fast startup versus Wake-on-LAN
Many Windows computers support a boot mode named "Fast Startup". You will often find that such devices do not support wake-on-LAN (though there can be exceptions). If you want both (who wouldn't?), then you might ask what you can do to get both to work. This article provides relevant details and options.
1E expects that in almost all cases, wake-on-LAN is much more valuable than Fast Startup. The only likely exception is very small devices, which are most likely consumer or special-purpose (such as IoT) devices. Therefore the best practice is to disable Fast Startup if your organization benefits from wake-on-LAN.
Fast startup defined
"Fast Startup" sounds promising but we should remember what it does not include:
Faster reboots
Faster resumes from hibernate or standby.
In fact hibernate might not even be an option depending on how you configure Fast Startup. Fast Startup makes things faster only when you shut down the computer and then start it later (not on reboots or resumes).
As Microsoft says, Fast Startup is a "a type of shutdown that uses a hibernation file to speed up the subsequent boot. During this type of shutdown, the user is logged off before the hibernation file is created. Fast Startup allows for a smaller hibernation file, more appropriate for systems with less storage capabilities". So a core reason to provide this feature is to reduce disk consumption. That can be important in some cases (such as small devices).
By default Windows will preallocate disk space equivalent to 40% of the computer's physical memory size for hibernation. You can preallocate more if desired but not less. With Fast Startup on Windows 10, you can allocate only 20% of the computer's physical memory size (but that's when you use the option to use traditional hibernate). If you have a device with 2 GB of memory and 23 GB of disk space, 20% of the memory (400 MB) is 1.7% of the total disk space. If three quarters of the disk is used by the operating system, applications, and data, that 400 MB is 7% of the free space. That could be significant to the user but is likely to be exceptional.
How fast is "fast"?
We should also consider the "fast" part of Fast Startup. How much faster is it? Details will vary by model, but here are a few examples:
Model | Form Factor | Without Fast Startup | With Fast Startup | Delta for Fast Startup | Resume from Hibernate | Resume from Standby |
|---|---|---|---|---|---|---|
HP Compaq Elite 8300 CMT | Desktop | 40 seconds | 15 seconds | 25 seconds | 19 seconds | 3 seconds |
Microsoft Surface Pro 4 | Tablet | 20 | 9 | 11 | 15 | <3 |
Dell XPS 13 | Laptop | 28 | 19 | 9 | 8 | 4 |
Dell Venue 8 Pro | Tablet | 16 | 11 | 5 | 10 | 1 |
Relatively speaking, those are impressive improvements as compared to startup without Fast Startup. However, in terms of absolute time (which is what matters to users), the improvements are small. The exception to that might be if the user was shutting down multiple times per day, but that would be very unusual (although going to standby multiple times per day is not unusual at all). And the times are not significantly different as compared to resume from hibernate or standby.
Manually managing Fast Startup
Fast Startup is enabled by default. If you want to disable it:
Go to Power Options in the Control Panel
Click "Choose what the power buttons do"
Click "Change settings that are current unavailable"
Uncheck "Turn on fast startup"
To test the impact of Fast Startup:
Shut down the computer (do not put it in standby or hibernate)
Start the computer and start a stopwatch
When the log in prompt appears, stop the stopwatch
Record the time
Toggle Fast Startup (enable or disable it)
Repeat steps 1 to 4
Compare the times
To maximize disk savings from Fast Startup (Windows 10 only):
Open an administrator-enabled command prompt
Enter the command: PowerCfg.exe /hibernate /type reduced
PowerCfg.exe tells you how much disk space is allocated for the hibernate file, so you can the compare impact of the options by trying variations on that command (/type reduced, /type full, or /size N)
Note that when the type is "reduced', you lose the ability to hibernate the computer (in the full sense of saving the user state, like standby). Normal hibernate can be used with Fast Startup but then you don't have any disk space savings. Normal hibernate can be re-enabled by changing the type from "reduced" to "full" in the command above. You might also have to re-enable the option to select hibernate in your shutdown menus (that can be done in much the same was Fast Startup was disabled above.
A small consideration is that some people find that Fast Startup can cause system reliability problems. This is commonly due to device driver or firmware issues. Sometimes these can be corrected with device driver or firmware updates.
Wake-on-LAN for connected standby devices
Some devices (tablets and some 2-in-1's, for example) support Connected Standby. Sometimes these kinds of device can have very limited disk space and thus could benefit from Fast Startup. Connected Standby does not support wake-on-LAN and so using Fast Startup might seem a logical choice in these cases. 1E is working on a solution to enable WakeUp for such devices.
Your options
Should your organization use Fast Startup extensively? As with many aspects of computer management, "it depends":
Does your organization commonly shut down computers?
If not, Fast Startup will not help
If you do, have you considered using hibernate or standby? They are also fast and virtually equivalent in power savings
If you are doing shut downs to reset the computers or ensure software updates are applied, you can enforce reboots instead and then hibernate or standby
Will the time savings from using Fast Reboot be significant to (or noticed by) your users?
Is disk space a serious concern?
Are you willing to not be able to use hibernate?
Do your computers commonly have large memory and small disks (especially small free disk space)?
If it's a small fraction of your devices that are problematic, you could replace them, free up space through other means, or choose to not use wake-on-LAN on those devices only
If such devices are very common in your organization, then choosing to use Fast Startup (and not use wake-on-LAN) could be the right choice for your organization
Given those considerations, 1E expects that in almost all cases, wake-on-LAN is much more valuable than Fast Startup. The only likely exception is very small devices, which are most likely consumer or special-purpose (such as IoT) devices. Therefore the best practice is to disable Fast Startup if your organization benefits form wake-on-LAN.
References
Power states as defined by Microsoft: https://learn.microsoft.com/en-gb/windows/win32/power/system-power-states?redirectedfrom=MSDN#soft_off_state__s5
Fast Startup vs. wake from Hibernate: https://msdn.microsoft.com/en-us/library/windows/hardware/jj835779(v=vs.85).aspx
Using Computer Reclaim
Computer Reclaim allows you to identify computers that have not been used in your organization for an extended period of time. It also allows you to identify computers that have only been rarely used. It also identifies computer usage by monitoring keyboard and mouse use. It does not report the specific amount of use but rather whether or not the keyboard or mouse were used at all during periods of time (typically 10 minutes).
Note
In previous versions of NightWatchman, this feature was called Hardware Utilization. NightWatchman 7.2 substantially enhanced Hardware Utilization by making it more obvious, adding rarely used computers, and increasing its accuracy.
Enabling Computer Reclaim
Computer Reclaim is not enabled by default. To enable Computer Reclaim:
Open the NightWatchman console.
Click Settings.
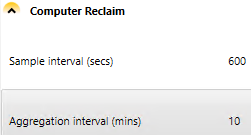
In the Computer Reclaim section, review and define the sample interval – how often it checks for keyboard or mouse input.
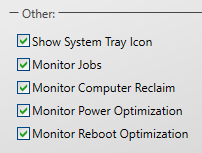
Click Power Policies.
On the General tab under Other, ensure that the Monitor Computer Reclaim checkbox is ticked.
The Computer Reclaim reports
Within Reports, is a Computer Reclaim category which has these reports:
Rarely used computers by location – with this report you can identify specific rarely used computers
Unused computer counts by location, weekly – with this report, you can focus on particular locations or computer types to determine where you have the greatest potential to reclaim computers. It also enables you to maximize the reclaim of rarely used computers by increasing the minutes per days a computer can be used and still be considered recently used. Or you can decrease that threshold if you don't want to reclaim computers that are used except for the smallest amounts of time. By default, computers that are used one day a week but rarely used the rest of the week are considered rarely used. You could decrease or increase that threshold as well. If you are reporting on retail branches or other locations that are open 7 days a week, you could include weekends as well (otherwise weekends don't count toward non-usage of a computer).
Unused computer counts by location, yearly – number of unused computers by location and month for a year
Unused computers by location – if you find that you have unused computers that could be reclaimed, you can list those computers using this report.
These reports list computers for as many weeks as you like up to the number of days such records are available and retained (typically 90 days). In both cases you can see details about the computers including when they were last used or rarely used. You can identify the most likely prospects and then ask local administrators to reclaim the computers.
Considerations for setting Computer Reclaim sample and aggregation intervals
The aggregation interval indicates how often computer reclaim reports the most common findings for the sample intervals
The sample interval must be smaller than or the same size as the aggregation interval
Making the sample interval and aggregation interval small and the same periods enables very granular determination of rarely used computers. For example, 5, 10, or 15 minutes allow you to report on computers that have only be used for those periods of time or less. If you set the period to one hour, you can only report on computers that might have been used for one hour or more
Smaller intervals require more database space but the difference should be insignificant for most organizations
Note
Computers must be occasionally powered on while on the network that NightWatchman manages. Computer Reclaim cannot identify unused computers that are never powered on or that are never connect to the network.