Configuring and managing advanced components
NightWatchman Enterprise provides a number of advanced features that deal with specific scenarios and limitations. The following sections provide details on each of the features.
Configuring the 1E NightWatchman Agent
The NightWatchman Agent has four key areas that can be managed:
Scheduling power-offs
Defining the actions taken to log-off a user
Creating or modifying power-off scripts
Setting the actions taken to power-off the machine
As the administrator, you can schedule the system to shut down at a certain time on certain days of the week. You, or the end-user, can also request an immediate power-off.
If there are users logged on the system when a power-off is initiated, the log-off action takes place. If not, NightWatchman proceeds directly to the power-off stage.
Note
If a computer is already in standby or hibernate mode, it will not be woken to shut it down.
There are three log-off modes that can be set:
Passive – if users are logged on, no attempt will be made to shut down.
Active – users are asked if the power-off is allowed to continue.
Force – users are notified that a power-off is about to take place and will be logged off once the countdown expires.
You can set a countdown for a power-off, so in Active and Force modes, users see a countdown to the event. In Active mode, the user has the option to cancel the power-off or enable the event by clicking OK. If the user postpones the event, NightWatchman can be set to retry again later.
If the modes are Active or Force, NightWatchman runs the power-off scripts. The four scripts which enable administrators to power down computers are:
To learn more about scripting NightWatchman, see configuring NightWatchman scripts and scripting reference.
NightWatchman power schemes and reporting data
NightWatchman automatically configures the power scheme to enable processor speed and voltage to vary automatically with system usage, specifically for machines using Intel speed step processors or AMD Cool n' Quiet processors. This results in enhanced energy saving on machines with low average utilization (most office productivity machines). On Windows 7, this involves the creation of a new NightWatchman power scheme based on the Balanced Power Scheme.
From the point of installation, NightWatchman reports inventory and power state data for its local computer back to the reporting server. The inventory information includes:
the computer name
the computer's domain
IP address and subnet
its network card MAC Address
the chassis model, type and manufacturer.
Power state data shows how long the computer is in a particular power state and is used in conjunction with associated typical power consumption information to calculate how much power the computer is consuming throughout the day. Inventory information helps identify the computer and determine any information related to its type, such as its typical power consumption figures.
The NightWatchman Management Center Console lets you define:
Location groups – enables you to model your company according to the physical location of the computers. You can report on and apply location specific power settings to computers according to where they reside. For example, if you know of a forthcoming national holiday, you can apply a one-off policy that sets particular power settings for that specific location only. You can also use these groups to apply specific localized tariffs that increase the accuracy of power cost reports.
Organization groups – enables you to model your company according to organizational units. You can report on and apply specific power settings to computers according to where they sit in the organization. For example, if you know of an off-site team building exercise for a particular department, you can apply a one-off policy that sets particular power settings for that department only.
NightWatchman pre-event tests
When a scheduled power-down event is triggered (and before the Hibernate, Standby, power-off or Reboot events starts), NightWatchman runs the following tests:
Test | Description |
|---|---|
Passive | If |
Last man standing | Check to see if the computer is set to be last man standing. If so, cancel the scheduled event. NoteWindows only test. |
User activity | Check for user activity, If found, cancel the scheduled event. This test is not performed if:
|
Exception list | Check to see if any processes on the process exception list are currently running. If so, cancel the scheduled event. |
Configuration Manager running jobs | If Configuration Manager client exists and NoteIf the computer is a laptop running on batteries, this test is by-passed and the scheduled event is allowed to proceed regardless. |
Configuration Manager pending jobs | If Configuration Manager client exists and NoteIf the computer is a laptop running on batteries, this test is by-passed and the scheduled event is allowed to proceed regardless |
Nomad in-progress file transfers | Check to see if the computer is acting as the Nomad P2P master. If so, cancel the scheduled event. |
Nomad PBA content found | Check to see if the computer has content that Nomad is holding as part of its Peer-Backup Assistant functionality. If so, cancel the scheduled event. |
Keep active status | Check the Keep Active status on the NightWatchman user interface. If set, cancel the scheduled event. |
Active maintenance window | If a NightWatchman maintenance window is active, cancel the scheduled event. |
Because the 1E Agent will cancel a scheduled power down event when there are pending or running Microsoft Configuration Manager jobs, it is recommended to set logoffaction=FORCE when attempting to power down a computer after successfully running a Configuration Manager software distribution Advertisement.
An alternative would be to use the NightWatchman command-line and set a once-off power down with logoffaction set to ACTIVE or PASSIVE to power down the computer at a specific time and let it retry until the Advertisement has finished running.
NightWatchman events
The following takes place when a NightWatchman event is triggered.
Event | Sequence |
|---|---|
Hibernate or stand-by |
|
Power-off or reboot |
|
Resume from a low-power state |
|
To learn how to configure NightWatchman or modify its scripts, see configuring NightWatchman. To learn about the switches that control NightWatchman functionality, see command-line switches.
End-user actions
When you enable the NightWatchman system tray interface, the end-user can:
Keep their computer active by opting out of passive or active NightWatchman power-offs for a period of time.
Initiate a local power-off.
View the list of files backed-up during the last log-off process.
You may also want to audit end-user interaction with the NightWatchman backup dialog and resolve issues with backups that occasionally do not appear in the backup list. The 1E Agent tracks basic end-user choices when selecting the Save or Reject options in the Backup Dialog.
For each file that the user chooses to accept or reject, an entry is added to NWMAudit.log, which is created in the per-user NightWatchman data folder. for example, C:\Users\joey.malloy\AppData\Local\1E\NightWatchman.
Each entry indicates the time of the operation, the original document name, whether the user chose to Keep or Reject the file and, where applicable, the name of the file that the backup was saved to.
Managing client groups
By supporting the construction and manipulation of location and organization client group hierarchies, NightWatchman Console lets you model your business appropriately. The groups can be used to enables the application of power policies to business units or locations, not just specific computers. To learn more about applying power policies, see using the NightWatchman group hierarchies.
Using NightWatchman Console you can:
Reporting
Location and organization groups can be used in the NightWatchman Agility Framework reports to enable power consumption statistics to be analyzed in terms of their effect on the business. To learn more about reporting, see the NightWatchman Management Center Reporting Guide .
Adding groups
To add a group:
Select either the Location Groups or Organization Groups tab.
Select an existing node in the Groups tree for the new group to be under.
Right-click the node and from the context menu, choose Add Group...
Enter the name for the new group in the Add Group dialog and click OK. The new group appears under the previously selected group node.

Renaming groups
To rename a group:
Select the group node to rename.
Right-click the group node and select the Rename Group option from the context menu.
The group name will turn into an edit field, type in the new name.
Click Enter to accept the change or ESC to cancel.
Deleting groups
To delete a group:
Select the group node to delete.
Right-click the group node and on the context menu, choose Delete.
You are prompted to confirm your actions. Click Yes to confirm or No to cancel. If you previously ticked the Don't ask me again checkbox, you will not be prompted and the group is removed from the NightWatchman Console immediately.
As a precaution, NightWatchman Console prevents the deletion of groups that contain sub-groups.
When a building node gets deleted computers associated with it are reassigned to the UNASSIGNED BUILDING group. Similarly, when a department node gets deleted, computers associated with it are reassigned to the UNASSIGNED DEPARTMENT group.
Note
When groups are deleted, their records persists in the the database but are marked as deleted (soft-delete) and is not displayed in the Nightwatchman Console. Computers associated with that group are re-classified as UNASSIGNED. Reporting data for the deleted groups are not affected.
Assigning computers to departments and buildings
To assign or move computers to specific departments and buildings:
Computers cannot be moved between the Location and Organization group hierarchies. Select which hierarchy you want to modify by clicking either the Location Groups or Organization Groups tab.
In the Groups tree, navigate to the current location of the computers you want to assign. Unassigned computers reside in the UNASSIGNED BUILDING node for Location groups and UNASSIGNED DEPARTMENT for Organization groups.
Select the computers to move to a particular department or building.
Scroll the Groups tree view and expand nodes until the department or building node is visible.
Drag your selection into the new department or building node. You can only drag computers to a building or department group, i.e. one that is at the fifth tier of the organization or location hierarchies.
Removing computers from departments and buildings
To remove computers from specific departments and buildings:
In the Groups tree view, navigate to the building or department you want to remove computers from.
Select the computers to remove.
Right-click and from the context menu, choose Remove from Group.
The selected computers are disassociated from their current node and reassigned the UNASSIGNED BUILDING group or the UNASSIGNED DEPARTMENT group.
Configuring ASP.NET for Windows Server 2012 R2
To configure ASP.NET (must be ASP.NET 4.5 for FIPS compliance) for Windows Server 2012 R2:
Start Server Manager.
From the Manage menu (top-right menu bar), select Add Roles and Features.
On the Before you begin, page click Next.
On the Installation Type page, ensure Role-based or feature-based installation is selected and click Next.
On the Server Selection page, ensure the local server is selected and click Next.
On the Server Roles page, check the Web Server (IIS) server role.
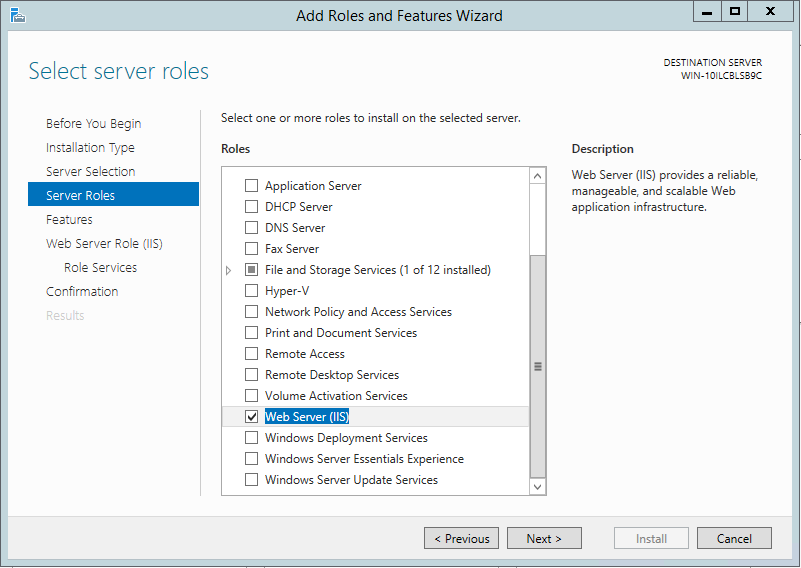
In the dialog, click Add Features to add the features required for Web Server (IIS).

The Web Server Role (IIS) page is added after the Web Server (IIS) is checked on the Server Roles page.
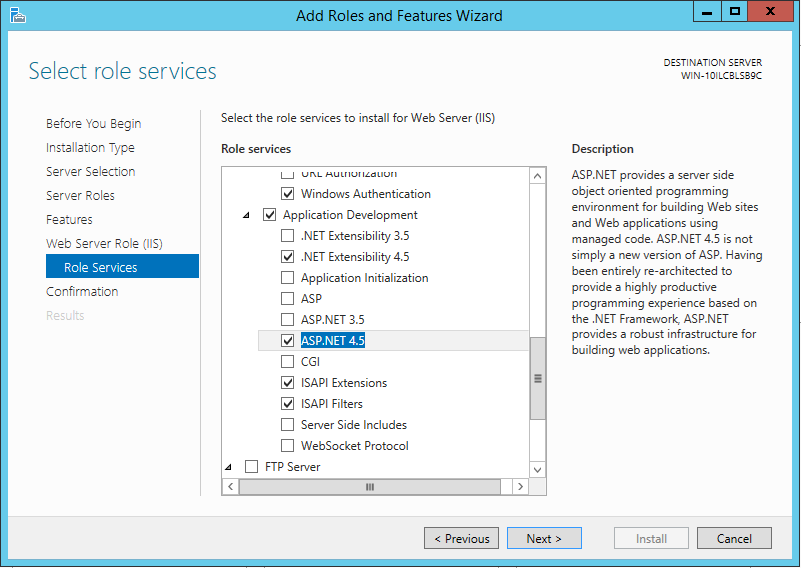
On the Role Services page under Web Server Role (IIS), expand the Security node and check Windows Authentication.
Expand Application Development and check the ASP.NET 4.5 node (this also checks a number of other options, such as ISAPI Extensions and ISAPI Filters).
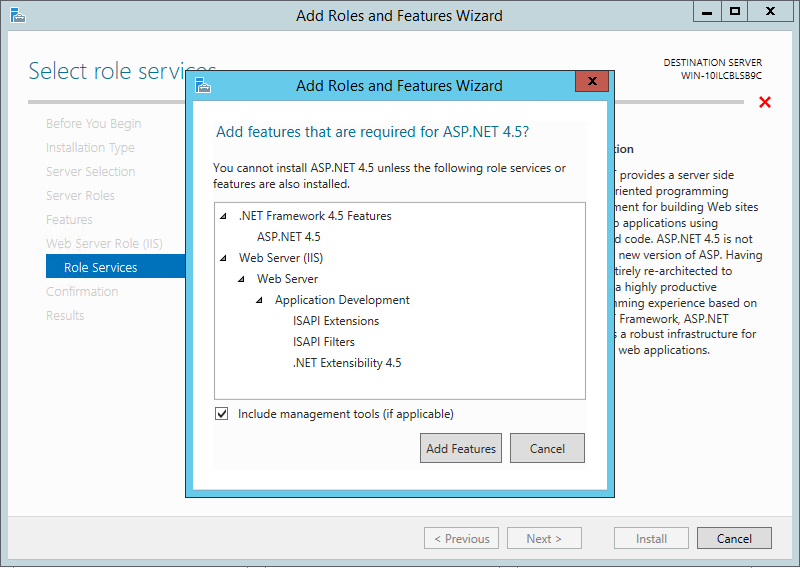
When you select ASP.NET 4.5 you will be prompted to add features related to that role. Click Add Features in the dialog to add all the features.
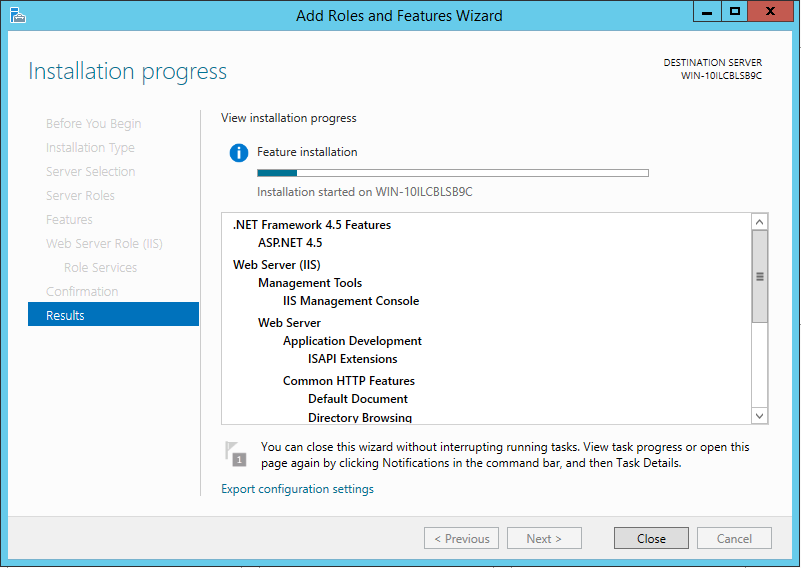
After you have made the necessary changes, click Install to begin the role installation. Installation progress is displayed while the components are being installed.
Customizing Enterprise View
To illustrate how to customize Enterprise View, we are going to show you how to get the data from a database and display it as a chart as well as a table. Our example (ACME Corporation) uses a database that holds employee, customer and investor satisfaction ratings – the Happy table contains the following columns and data:
Happy states | Employees | Customers | Investors |
|---|---|---|---|
Ecstatic | 543 | 123 | 58 |
Extremely Happy | 400 | 700 | 158 |
Happy | 390 | 323 | 89 |
Mildly Unhappy | 243 | 23 | 58 |
Extremely Unhappy | 143 | 12 | 38 |
Outraged | 0 | 1 | 4 |
Note
Enterprise View ships with a set of XSD (XML schema defintion) files, which can be used when customizing tiles to validate the content and structure of the tile definition.
Displaying data as a chart
To display your data as a chart:
Define an SQL data source in the
DataSources.xmlfile located in the Enterprise View\Dashboard.Web\Source folder.<DataSource Name="ACME"> <ConnectionProperties DataProvider="SQL"> <Value> <![CDATA[Server=(local); Database=ACME; Trusted_Connection=True; pooling=false]]> </Value> </ConnectionProperties> </DataSource>Create a tile definition XML file in the
EnterpriseView\Dashboard.Web\Source\Tilesdirectory and add aDashboardTileelement with command and presentation sections, the namespace used for the components and other attributes for the tile. For example, we create the following XML tile definition to display:
<?xml version="1.0" encoding="unicode" ?>
<DashboardTile xmlns="http://www.1e.com/2009/DashboardTile.xsd"
               xmlns:chart=http://www.1e.com/2009/StandardChart.xsd
   Type="Standard"
   Title="ACME Happy Tile"
   ThumbnailSource="columnchart.png"
   Description=" The ACME employees, customers and investors happiness index"
   RefreshFrequencyMins="60"
   Activator="StandardChartActivator">
where:
Typemust be Standard for all user-defined tilesTitleis the label for the tileThumbnailSourceis the location of image for the tileDescriptionis a description for the tileRefreshFrequencyMinsis the interval to refresh the tile – 60 minutes in our exampleActivatorisStandardChartActivatorwhich tells Enterprise View to retrieve the data in the correct format for the chart presentation
Create the query to retrieve data for the chart. In our example, (ACME datasource, defined in step 1) the ACMESAT identifier is used in the presentation section.
<CommandCollection>
   <Command DataSource="ACME" Identifier="ACMESAT">
      <Text><![CDATA[SELECT Happiness, Employees, Customers, Investors FROM dbo.Happy]]></Text>
   </Command>
</CommandCollection>
You can have one or more commands each defined in the
<Command></Command>.Note
SQL data sources can also be used to run stored procedures to retrieve the required data, which is generally safer than running arbitrary SQL.
We are going to chart the number of people and their ratings for ACME Corporation using a series for each of the Employees, Customers and Investors data:
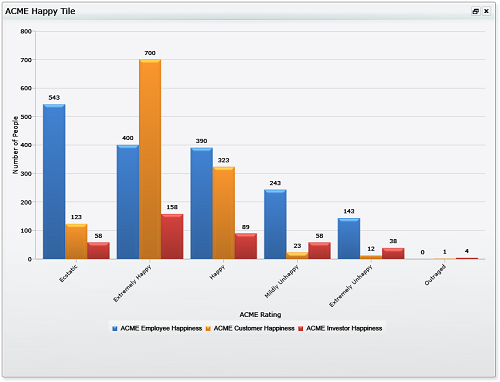
<Presentation>
   <chart:StandardChart LegendEnabled="true"
          AxisYTitle="Number of People"
          AxisXTitle="ACME Rating">
      <chart:SeriesCollection>
         <chart:Series Type="Column"
                LabelEnabled="true"
                LegendText="ACME Employee Happiness">
            <chart:DataPoint CommandIdentifier="ACMESAT"
                   YValueBinding="Employees"
                   AxisXLabelBinding="Happiness"/>
         </chart:Series>
         <chart:Series Type="Column"
                LabelEnabled="true"
                LegendText="ACME Customer Happiness">
            <chart:DataPoint CommandIdentifier="ACMESAT"
                   YValueBinding="Customers"
                   AxisXLabelBinding="Happiness"/>
         </chart:Series>
         <chart:Series Type="Column"
                LabelEnabled="true"
                LegendText="ACME Investor Happiness">
            <chart:DataPoint CommandIdentifier="ACMESAT"
                   YValueBinding="Investors"
                    AxisXLabelBinding="Happiness"/>
         </chart:Series>
      </chart:SeriesCollection>
   </chart:StandardChart>
</Presentation>
The Y axis is labeled Number of People and the X axis ACME Rating. The chart uses the Column type.
The ACMESAT identifier (defined in step 3) is used to retrieve the data, with the Y value binding set to the Employees, Customers and Investors columns for each series and the X value set to the Happiness rating
The legend for each series is set to ACME Employee Happiness, ACME Customer Happiness and ACME Investor Happiness respectively.
Displaying data in a table
To display your data in a table:
Typemust be Standard for all user-defined tablesTitleis the title for the tableThumbnailSourceis the location of image for the tableDescriptionis a description for the tableRefreshFrequencyMinsis the interval to refresh the table – 60 minutes in our exampleActivatorisStandardListViewActivatorwhich tells Enterprise View to retrieve the data in the correct format for the table presentation
We are going to use the data source you prepiously created for the chart.
Create the table definition XML file in the
EnterpriseView\Dashboard.Web\Source\Tilesdirectory and add aDashboardTileelement with command and presentation sections, the namespace used for the components and other attributes for the tile.<?xml version="1.0" encoding="unicode" ?> <DashboardTile xmlns="http://www.1e.com/2009/DashboardTile.xsd" xmlns:res="http://www.1e.com/2009/DashboardResources.xsd" xmlns:para="http://www.1e.com/2009/StandardParagraph.xsd" xmlns:table="http://www.1e.com/2009/StandardTable.xsd" Type="Standard" Title="ACME Happy Table" ThumbnailSource="table.png" Description="This table lets you know the ACME approval rating!" RefreshFrequencyMins="60" Activator="StandardListViewActivator">where:
Create the query to retrieve data from the table. We are going to use the query already created for the chart.
We are going to display the data for the number of people and their ratings for ACME Corporation using a columns and rows:
Creating a table
The following example sets the namespaces required for a table tile.
The type for all user-defined tiles must be set to Standard.
The title that appears on the banner for the tile and on the tile configuration page is set to ACME Happy Table.
The thumbnail and description that appear on the tile configuration page are set to
table.pngand a suitable description for the tile.The
RefreshFrequencyMinsis set to 60 so the tile will be updated every hour.The activator is set to the
StandardListViewActivatorwhich tells Enterprise View to retrieve the data from the data sources in the correct format for the table presentation type.
<?xml version="1.0" encoding="unicode" ?>
<DashboardTile xmlns="http://www.1e.com/2009/DashboardTile.xsd"
               xmlns:res="http://www.1e.com/2009/DashboardResources.xsd"
               xmlns:para="http://www.1e.com/2009/StandardParagraph.xsd"
               xmlns:table="http://www.1e.com/2009/StandardTable.xsd"
   Type="Standard"
   Title="ACME Happy Table"
   ThumbnailSource="table.png"
   Description="This table lets you know the ACME approval rating!"
   RefreshFrequencyMins="60"
Activator="StandardListViewActivator">Commands
The example can use exactly the same command used in the previous chart tile example.
<CommandCollection>
   <Command DataSource="ACME" Identifier="ACMESAT">
      <Text><![CDATA[SELECT Happiness, Employees, Customers, Investors FROM dbo.Happy]]></Text>
   </Command>
</CommandCollection>
Presentation
The <Presentation> tag this time contains a single <table:StandardTable> definition, where table is an object name declared in a namespace definition in the tile's <DashboardTile> tag. The <table:ColumnCollection> tag defines general parameters for the table and holds the individual <table:Column> tag definitions.
The <table:ColumnCollection> tag sets the ACMESAT command to populate the table, turns off displaying of the column headings and sets the background color for the table to a green/blue color.
Note
The ShowColumnHeader parameter is set to false. In this version the column headings do not support text formatting so it is usually best to not display them.
<Presentation>
   <table:StandardTable >
      <table:ColumnCollection CommandIdentifier="ACMESAT"
                              ShowColumnHeader="false"
                              BackgroundColor="#FF008888">
The following <table:Column> tag sets the data that will be displayed in the column using the Binding parameter. It also sets the column title, the column width and height and the height of the column heading.
The type of the column is set to html this allows HTML formatting to be applied to the contents of the column using the <table:FormatString> tag.
The Happiness binding is referenced in the format string using the {parameter} syntax. This substitutes the value for the binding into that location in the format string so in this example the column will display the Happiness value with a font size of 24 and with the emphasis style.
The CDATA syntax is used to allow the format string to contain characters that would normally require escape characters in XML.
<table:Column  Binding="Happiness"
       Title="Happy"
       Width="300" ContentHeight="60" Type="html">
   <table:FormatString>
      <![CDATA[<font size="24"><em>{Happiness}</em></font>]]>
   </table:FormatString>
</table:Column >
The following column definitions complete the table column collection.
<table:Column Binding="Employees" Title="Employees" Type="html" Width="300" ContentHeight="60" >
<table:FormatString>
<![CDATA[<font size="24">{Employees}</font>]]>
</table:FormatString>
</table:Column >
<table:Column Binding="Customers" Title="Customers" Type="html" Width="300" ContentHeight="60" >
<table:FormatString>
<![CDATA[<font size="24">{Customers}</font>]]>
</table:FormatString>
</table:Column >
<table:Column Binding="Investors" Title="Investors" Type="html" Width="300" ContentHeight="60" >
<table:FormatString>
<![CDATA[<font size="24">{Investors}</font>]]>
</table:FormatString>
</table:Column >
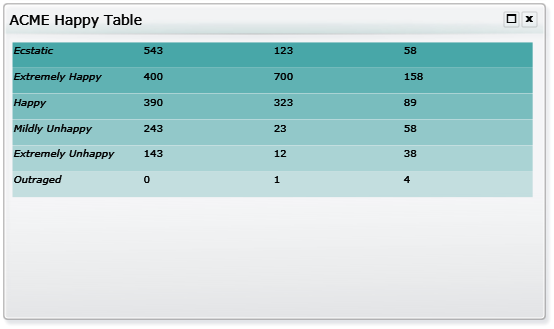
</table:ColumnCollection>In this example we also include a <StandardParagraph> tag that will display some descriptive text when the tile is maximized. This tag must be placed inside the <table:StandardTable> tag and only one is allowed.
<para:StandardParagraph>
   <para:Paragraph>
      <![CDATA[This table shows the happiness factor for the ACME corporation from the perspective of employees, customers and investors.]]>
   </para:Paragraph>
</para:StandardParagraph>
</table:StandardTable>
    </Presentation>
</DashboardTile>
Using the same data as in the previous chart example, this table definition results in the tile.
|