Page reference
A reference for the fields and tables on the pages in the Patch Insights application.
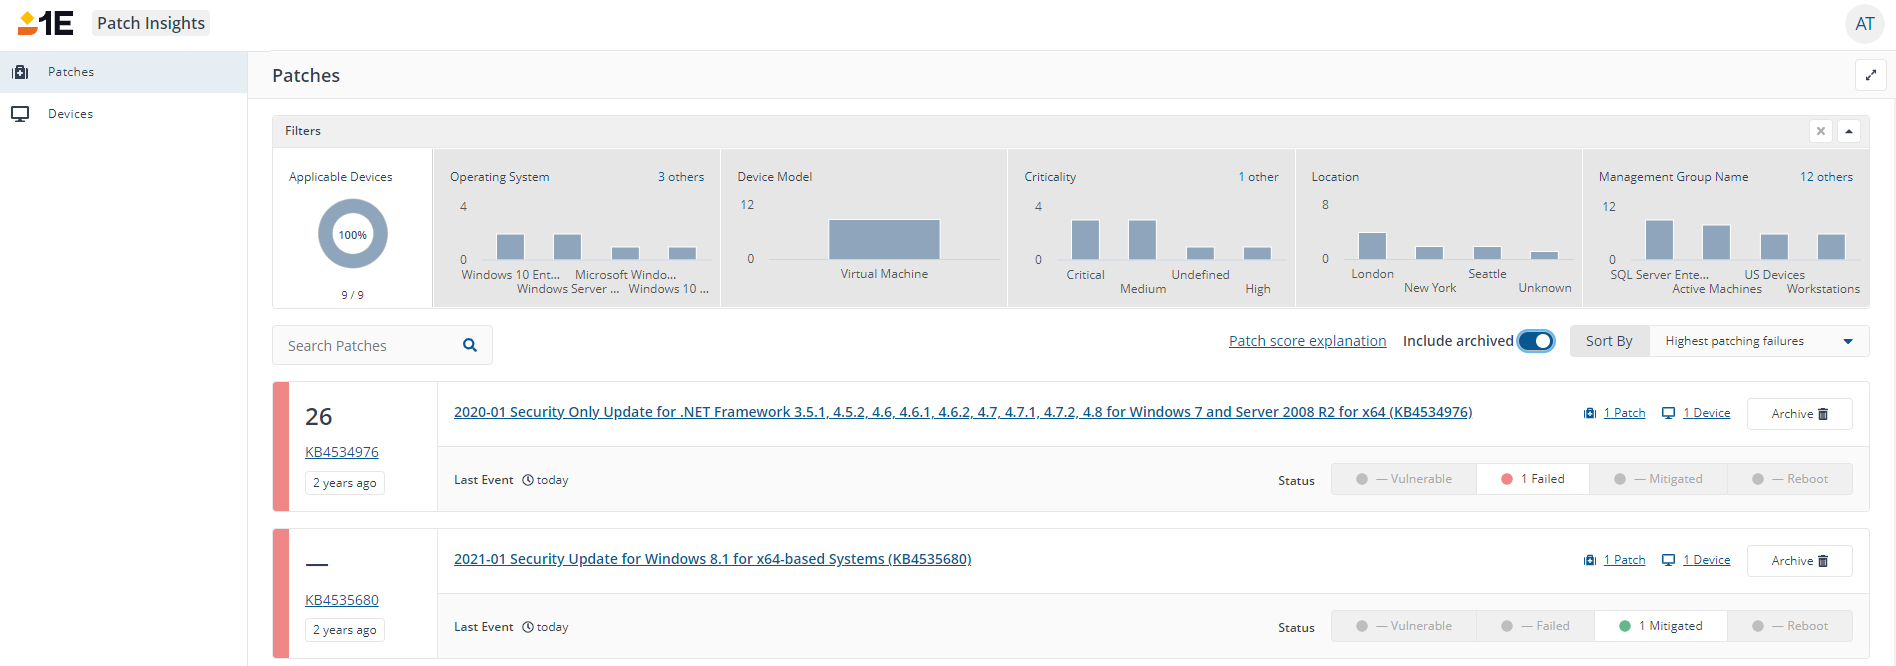
Patches page
Shows a dashboard of the patches within the environment. It has a number of tiles displayed.
Page description
Filters
The first row are the Filters available on the page, these are discussed here: Filters.
Search and sort
The next row provides the functionality to be able to search for a particular Patch, to remove or include any archived patches by use of the Include archived slider, or to sort the patches by:
Highest impact score
Lowest impact score
Highest patching failures
Lowest patching failures
Newest
Oldest

Patches and status
The final rows are the actual Patches that devices have reported as having at least one of the following statuses:
Vulnerabilities - Count of vulnerabilities for the environment
Failed - Count of failures for the environment
Mitigated - Count of mitigations for the environment
Reboot - Count of reboots required for patches deployed to the environment
The columns displayed are:
The Impact score the calculation of which is discussed here: The Impact Score. The column also shows the KB number and the age of the patch.
The remaining column is then sub divided into two rows, the top row shows:
The title of the patch and its KB and Definition and Version (where available) To the right of the patch title is a count of the number of patches under this KB, the number of devices which report a requirement for this, and the option to Archive the patch if it is not of interest.
The bottom row shows:
The last patching event reported by a device, and to the right is the Status for the patch, the categories were listed earlier.
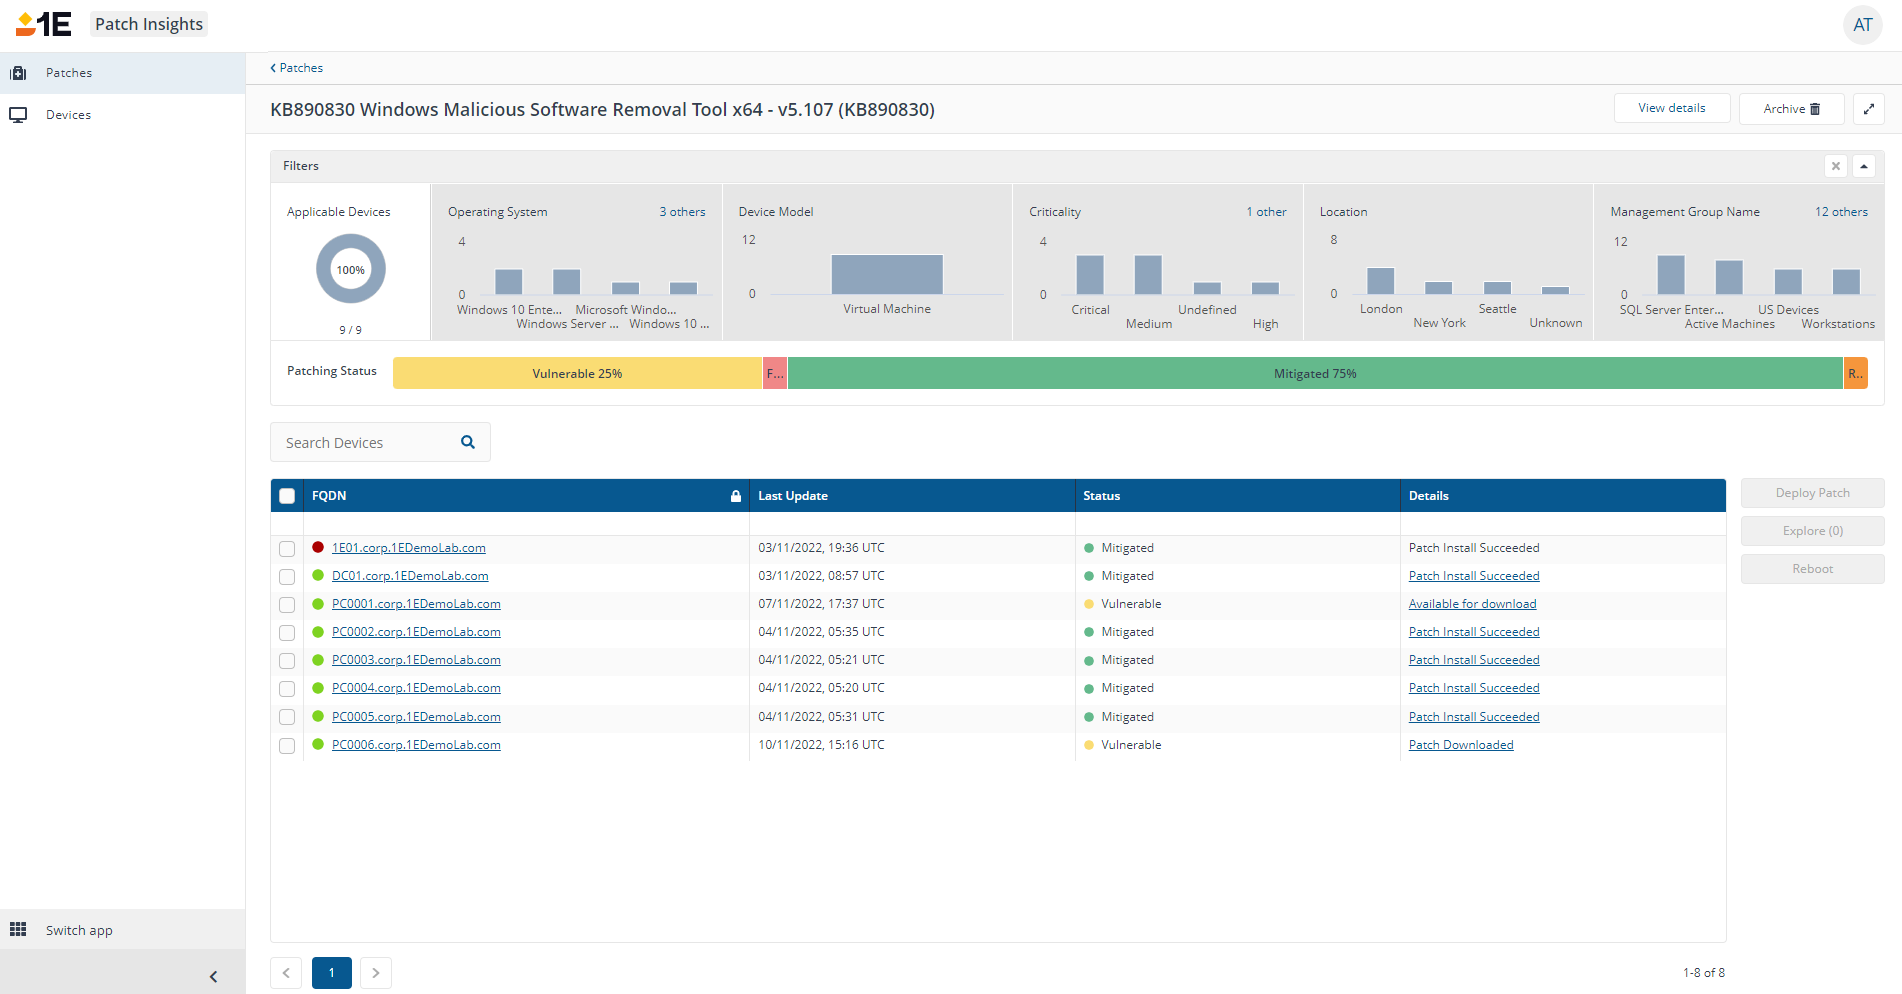
Drilling into the data
It is possible to drill down into the data to get a more granular view of where the patch has been deployed, and what state it is in on devices. Following any of the links in the row, apart from the  opens the page screenshot displayed which shows the patching status as a percentage in colored bars. And the devices with their status in a table, with the Details listed this can include the error code, the last status or mitigated.
If the user has the relevant role then once a selection is made in the checkboxes the Deploy Patch, Explore and Reboot buttons become enabled.
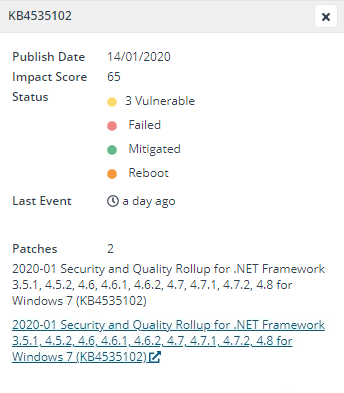
Selecting the link opens the drawer which displays to the right of the screen, and is displayed here for reference. This shows the information about the selected patch, with a link to the Microsoft support page for the patch, which opens in a new browser tab.
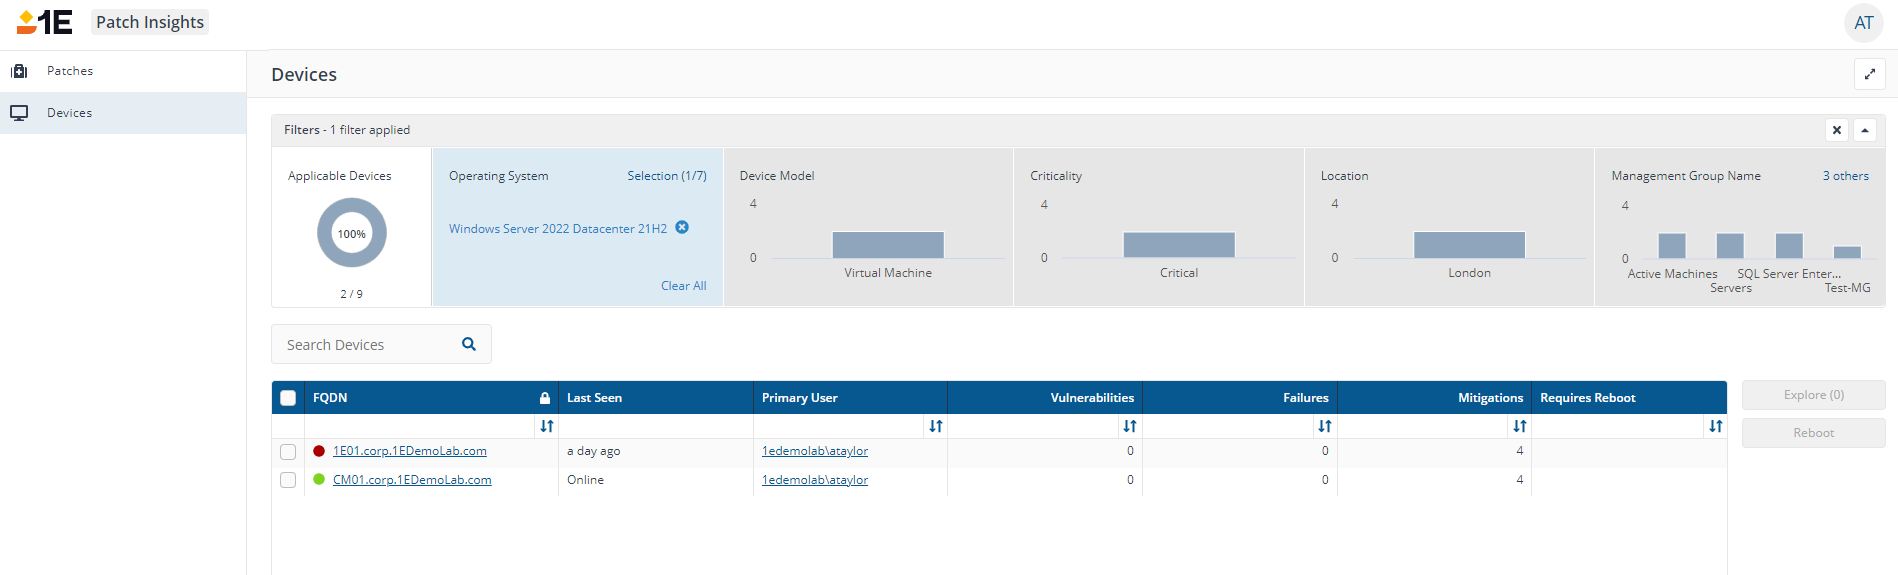
Devices page
Shows a dashboard of the devices within the environment, with categories relating to the device and also for the Patch status.
Page description
Filters
The first row of tiles shows the Filters available on the page, these are discussed here: Filters.
Categories
The next row has a number of columns relating to the device and the patch status, these are:
Device:
FQDN - The FQDN of the device
Last Seen - The last time the device was seen by 1E
Primary User - The primary user of the device
Patch:
Vulnerabilities - Count of vulnerabilities for the device
Failures - Count of failures for the device
Mitigations - Count of mitigations for the device
Requires Reboot - Count of reboots required for patches deployed to the device
If the user has the relevant role then once a selection is made in the checkboxes the Explore and Reboot buttons become enabled.
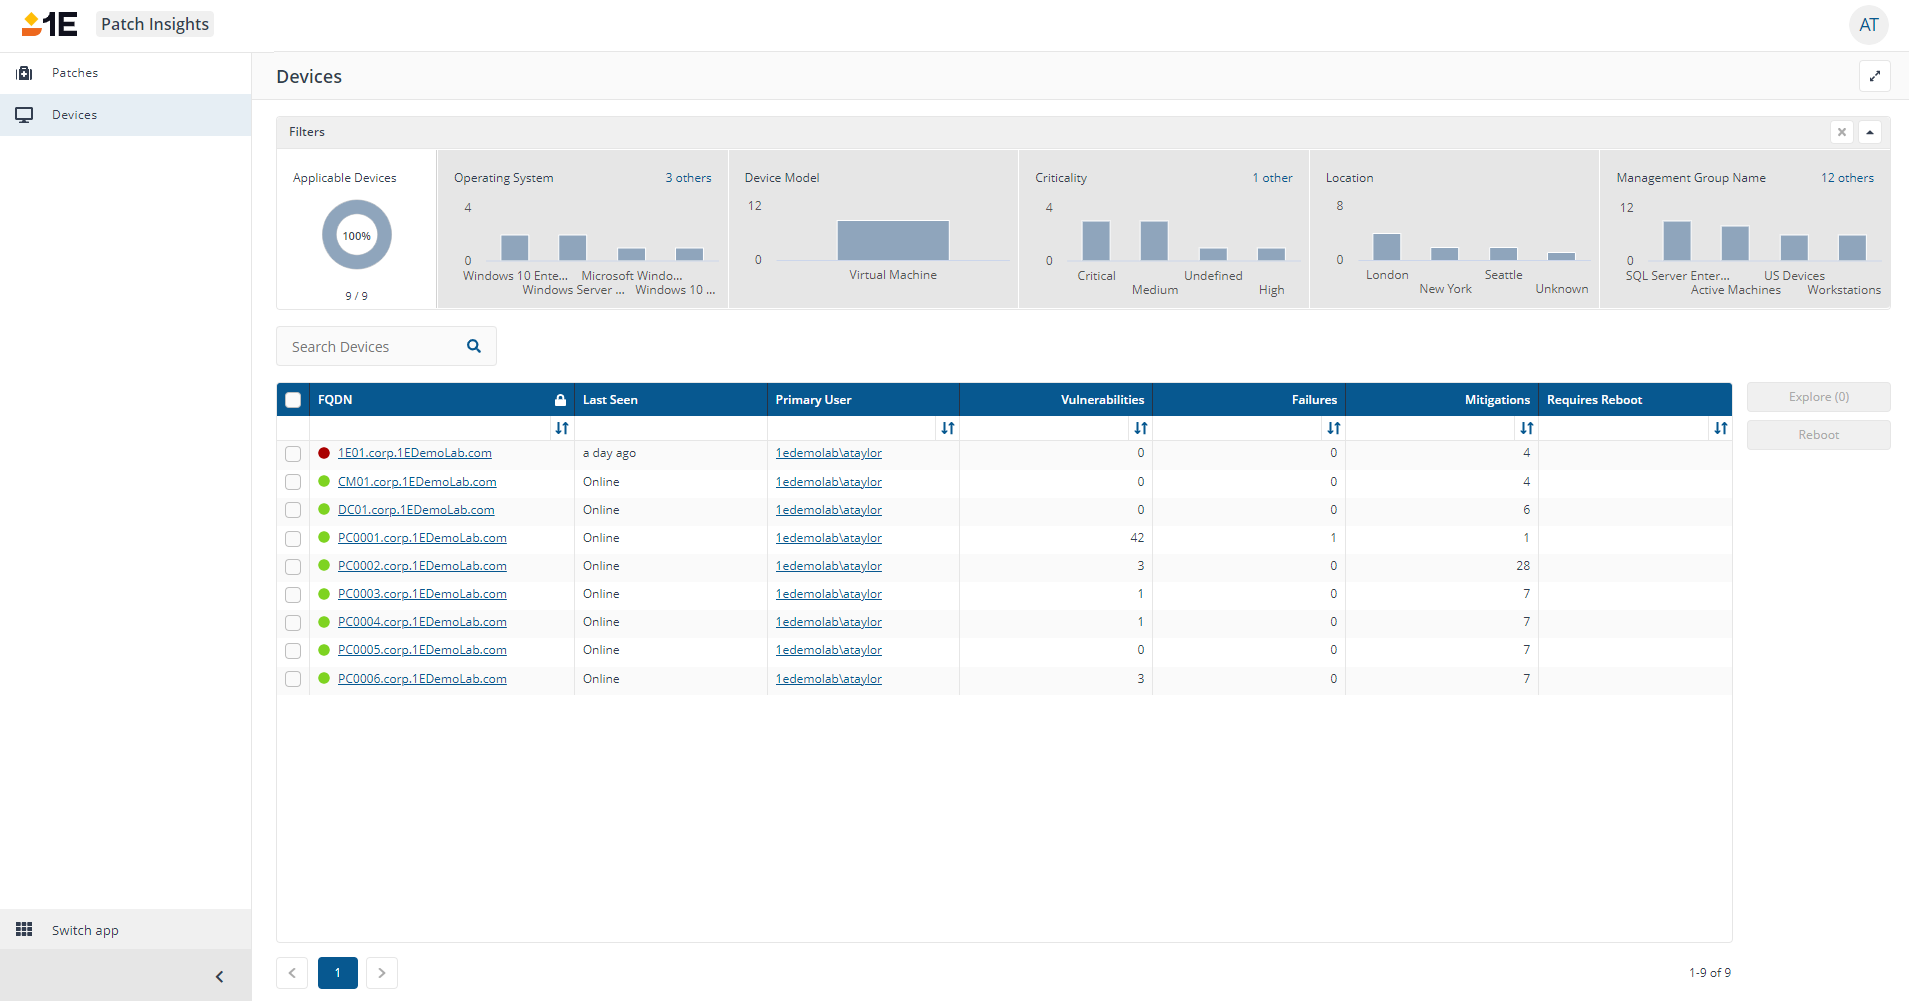
Drilling into the data
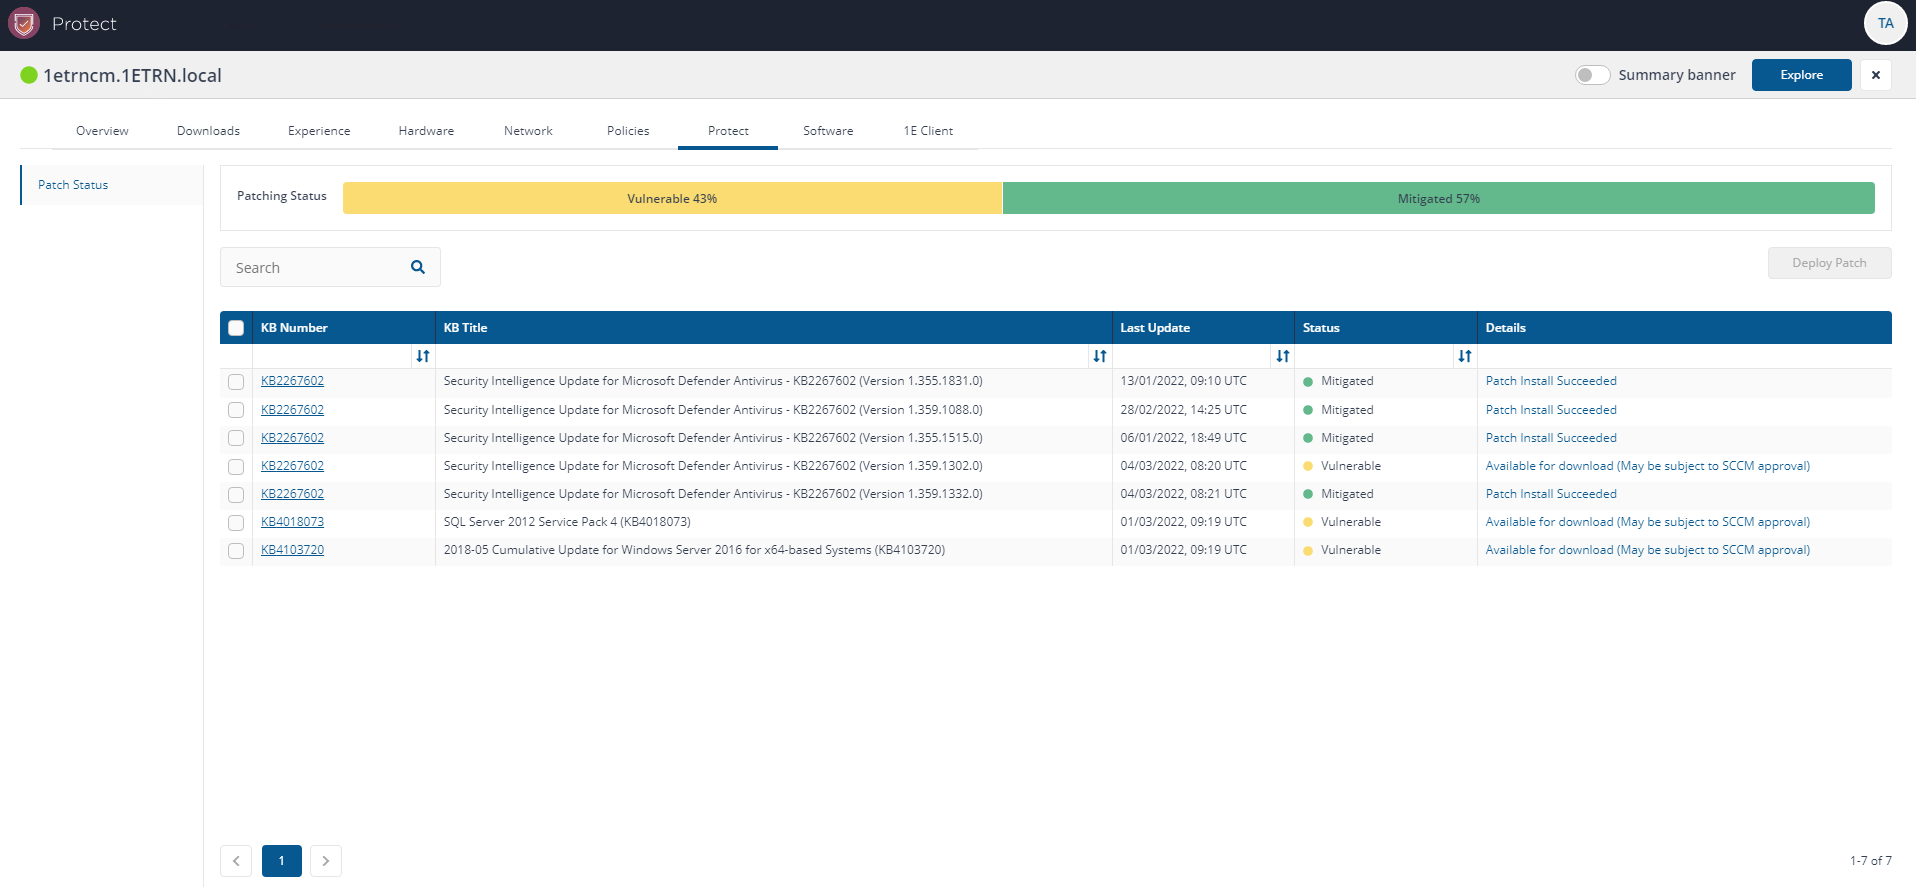
It is possible to drill into the data to get a more granular view of the status of patches on a specific device, clicking on the link in the FQDN column opens the screen to the right.
This shows the patching status as a percentage in colored bars. And the patches with their status in a table, with the Details listed, this can include the error code, the last status or mitigated.
The KB Number is also a link which will take you to the Patches page within Patch Insights.
From this page a user with appropriate permissions can click on the Explore button in the top right to open 1E Endpoint Troubleshooting and run any instructions they are permissioned to use. Or once a selection is made in the checkbox to the right of the KB number the Deploy Patch button will become enabled.
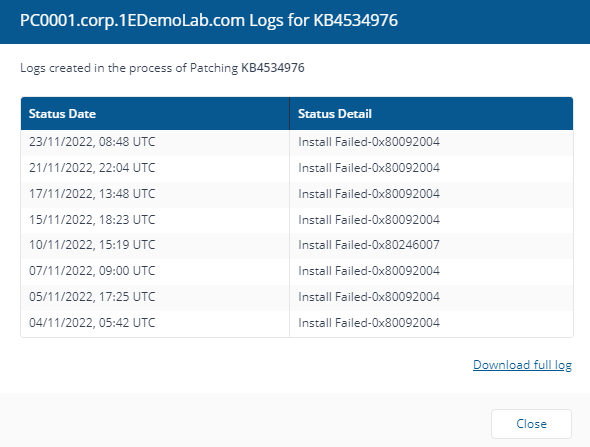
Clicking on the link in the Details column displays the events that have occurred on the device for the relevant patch. Shown to the right, it lists the machine fqdn and the logs for the KB article, with the Status Date and Detail showing, this log can be downloaded by clicking the Download full log link at the bottom of the screen.
Filters
Information about how to use the Filters bar that appears at the top of Patch Insights pages.
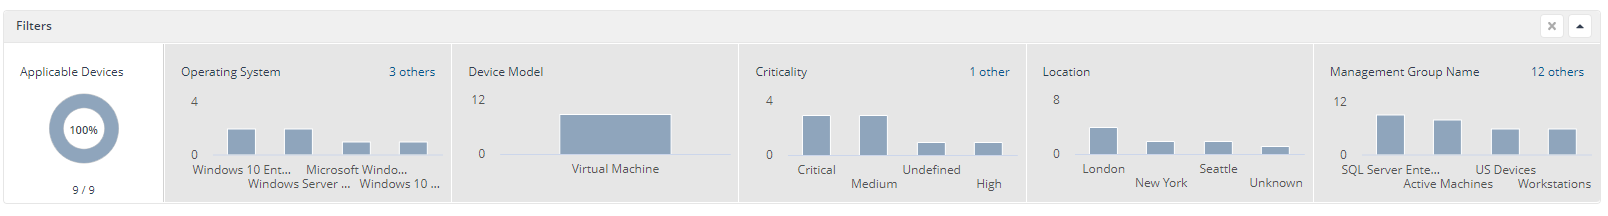
Patch Insights Filters
The Filters bar appears at the top of the pages in Patch Insights. Each section in the Filters bar allows a user to quickly and easily filter based on different categories. When a filter is set it applies to all the tiles on the page.
The Filters bar
The following sections are displayed on the Filters bar:
Section | Description |
|---|---|
Applicable Devices | This section shows the total number of devices that have been selected for the current view and the percentage of the environment those devices comprise. If no filtering is selected, the applicable devices will be 100% of the environment and will display the total number. |
Operating System | This section will allow you to create a filter based on the Operating System. The bars represent the different operating systems that make up the environment. |
Device Model | This section will allow you to create a filter based on the Model. The bars represent all the models that are in the environment. |
Criticality | This section will allow you to create a filter based on the Criticality setting of the devices. Criticality is set using an instruction. The details on setting Criticality can be found here Using Device Criticality . |
Location | This section will allow you to create a filter based on the Location setting of the devices. Location is set using an instruction. The details on setting Location can be found here Using Location . |
Management Group | This section will allow you to create a filter based on the Management Group membership(s) of the devices. Each bar represents a Management Group in 1E. The details on Management Groups can be found here Management Groups page . |
Collapse/Expand | The Up or Down Arrow on the far right of the Filters and Breakdown bar allows you to collapse or expand the bar. Collapsing removes the details from view and leaves only the title of the bar. This allows you to focus on the details of the data when you have the filter of your choice created. |
Using the Filters Bar
The Filters bar can be used to immediately apply filters and, to the data that is displayed.
The Filters selector lets you choose from:
Operating System
Device Model
Criticality
Location
Management Group
Here the Operating System filter has been selected and the screen has refreshed to show only servers.