Using Virtual Desktop Experience
This section contains an overview of Virtual Desktop Experience application features. For more information about VDX and platform features in this release, refer to 1E release information.
Infrastructure overview
The Infrastructure page contains several main areas. These are metrics and KPIs, option dropdowns, infrastructure topology, and the alerts drawer.
Metrics and KPI
At the top of the page are four main KPIs useful for VDI, these are:
Sessions
VDX Score
Average Logon Duration
Average Roundtrip Time.
You can hover over the  in the UI to understand more how these KPIs are defined.

Infrastructure Overview page options
There are a number of options available at the top of the page, these are:
Option | Description |
|---|---|
Site | You can select which Citrix Site you are viewing the VDI deployment for. |
Time | Use the Time dropdown to view the infrastructure topology at a previous moment in time. NoteThe Time option allows you to go back up to 7 days. |
Refresh | The Refresh button can be used to refresh the page. |
Fullscreen | The Fullscreen button can be used to maximize the view, removing the page header and left-hand navigation bar from view. 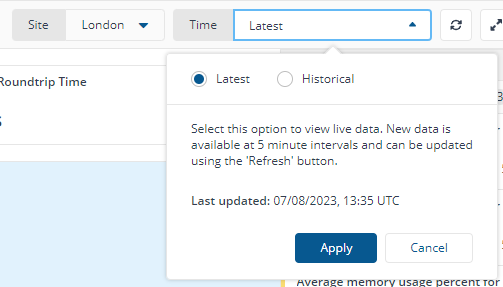 |
Infrastructure topology
This provides end-to-end visibility of your VDI deployment, including:
Connecting Devices
Note
This includes Managed - devices with the 1E Client installed - and Unmanaged Devices. Refer to Introducing 1E Client for details.
Storefronts
Delivery Controllers
Databases.
You can also click on nodes for more information, for example to view the number of user sessions associated with that node.
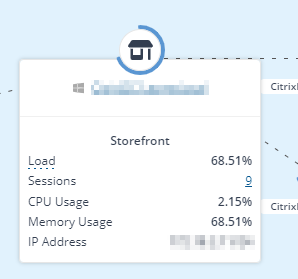
If the 1E Client is installed on the above, you will be able to navigate directly to their Device Pillar and seamlessly leverage other capabilities of the 1E platform. In addition, the following data will display:
Load, generated from a combination of CPU and Memory usage
CPU Usage
Memory Usage
IP Address.
Alerts drawer
The Alerts draw displays alerts raised for your Citrix Site. This feature requires the following:
The 1E Client installed on the relevant nodes of your VDI deployment for alerting to function on those devices.
The Alerting DEX pack be enabled in 1E Endpoint Automation. This pack enabled automatically when VDX is switched on.
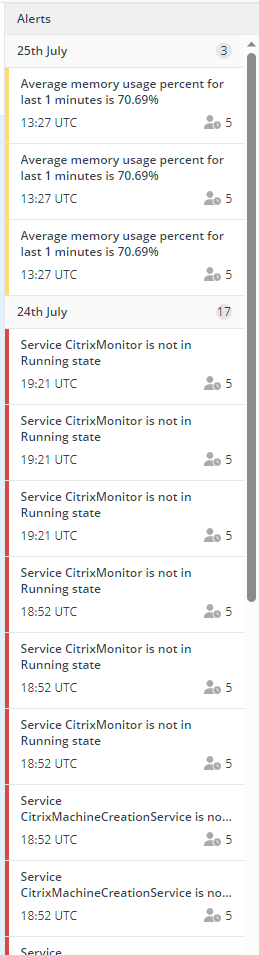
You can drill into alerts in the drawer to see additional details. Alerts raised in the last 24 hours will also display as badges on relevant nodes on the infrastructure topology.
User sessions
The User Sessions page displays high level details around all sessions, as well as the ability to filter and sort based on different parameters, and then view individual sessions.
Metrics and KPI
At the top of the page are four main KPIs useful for VDI, these are:
Sessions
VDX Score
Average Logon Duration
Average Roundtrip Time.
You can hover over the in the UI to understand more how these KPIs are defined.
Page options
There are a number of options available at the top of the page, these are:
Option | Description |
|---|---|
Site | You can select which Citrix Site you are viewing the VDI deployment for. |
Time | Use the Time dropdown to view the infrastructure topology at a previous moment in time. NoteThe Time option allows you to go back up to 7 days. |
Refresh | The Refresh button can be used to refresh the page. |
Fullscreen | The Fullscreen button can be used to maximise the view, removing the page header and left-hand navigation bar from view. |
Sessions Status | Use Sessions Status to filter the entire page by the status of that session. 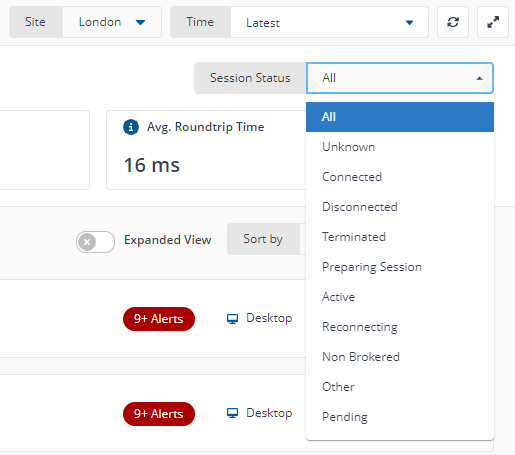 |
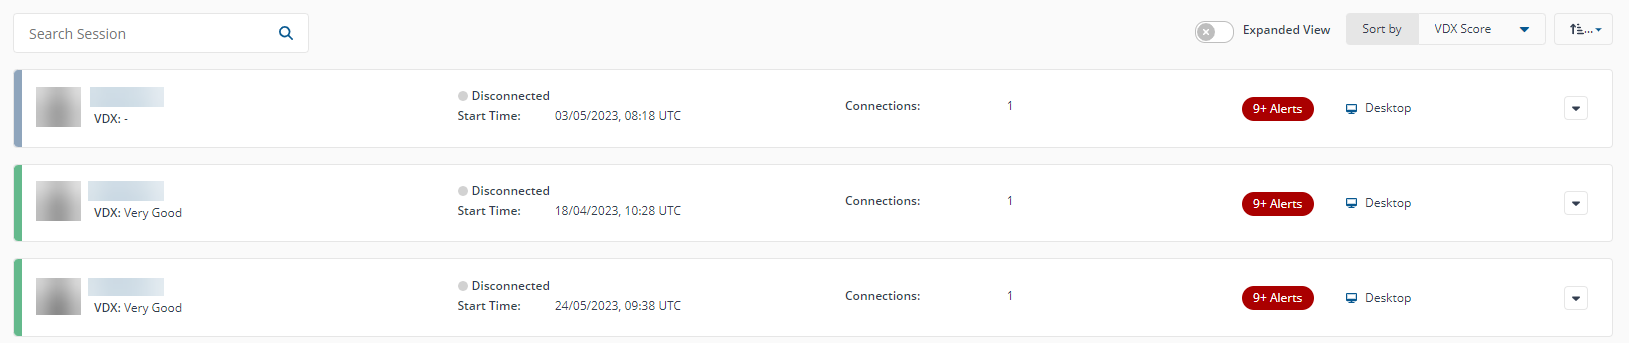
User sessions list
In this section you can view a list of sessions. You can filter, sort and access the following options:
Search - you can search for sessions using the name of the user, and FQDN
Expand View - you can expand the view to show additional detail per session on the list
Sort By - you can sort by numerous options including VDX Score, Start Time, Session Duration, Connections, Logon Duration, Roundtrip Time
Sort Ascending/Descending - use this button to sort the above ascending or descending.
Below these options, you can view a the list of user sessions. This includes numerous key bits of information, including visibility of alerts. Click into a row to view that session in detail in its own page.
User session page
This page shows additional information around a specific user session, including the VDX score, Desktop Group, when the session started, it’s duration, logon duration, and roundtrip time.
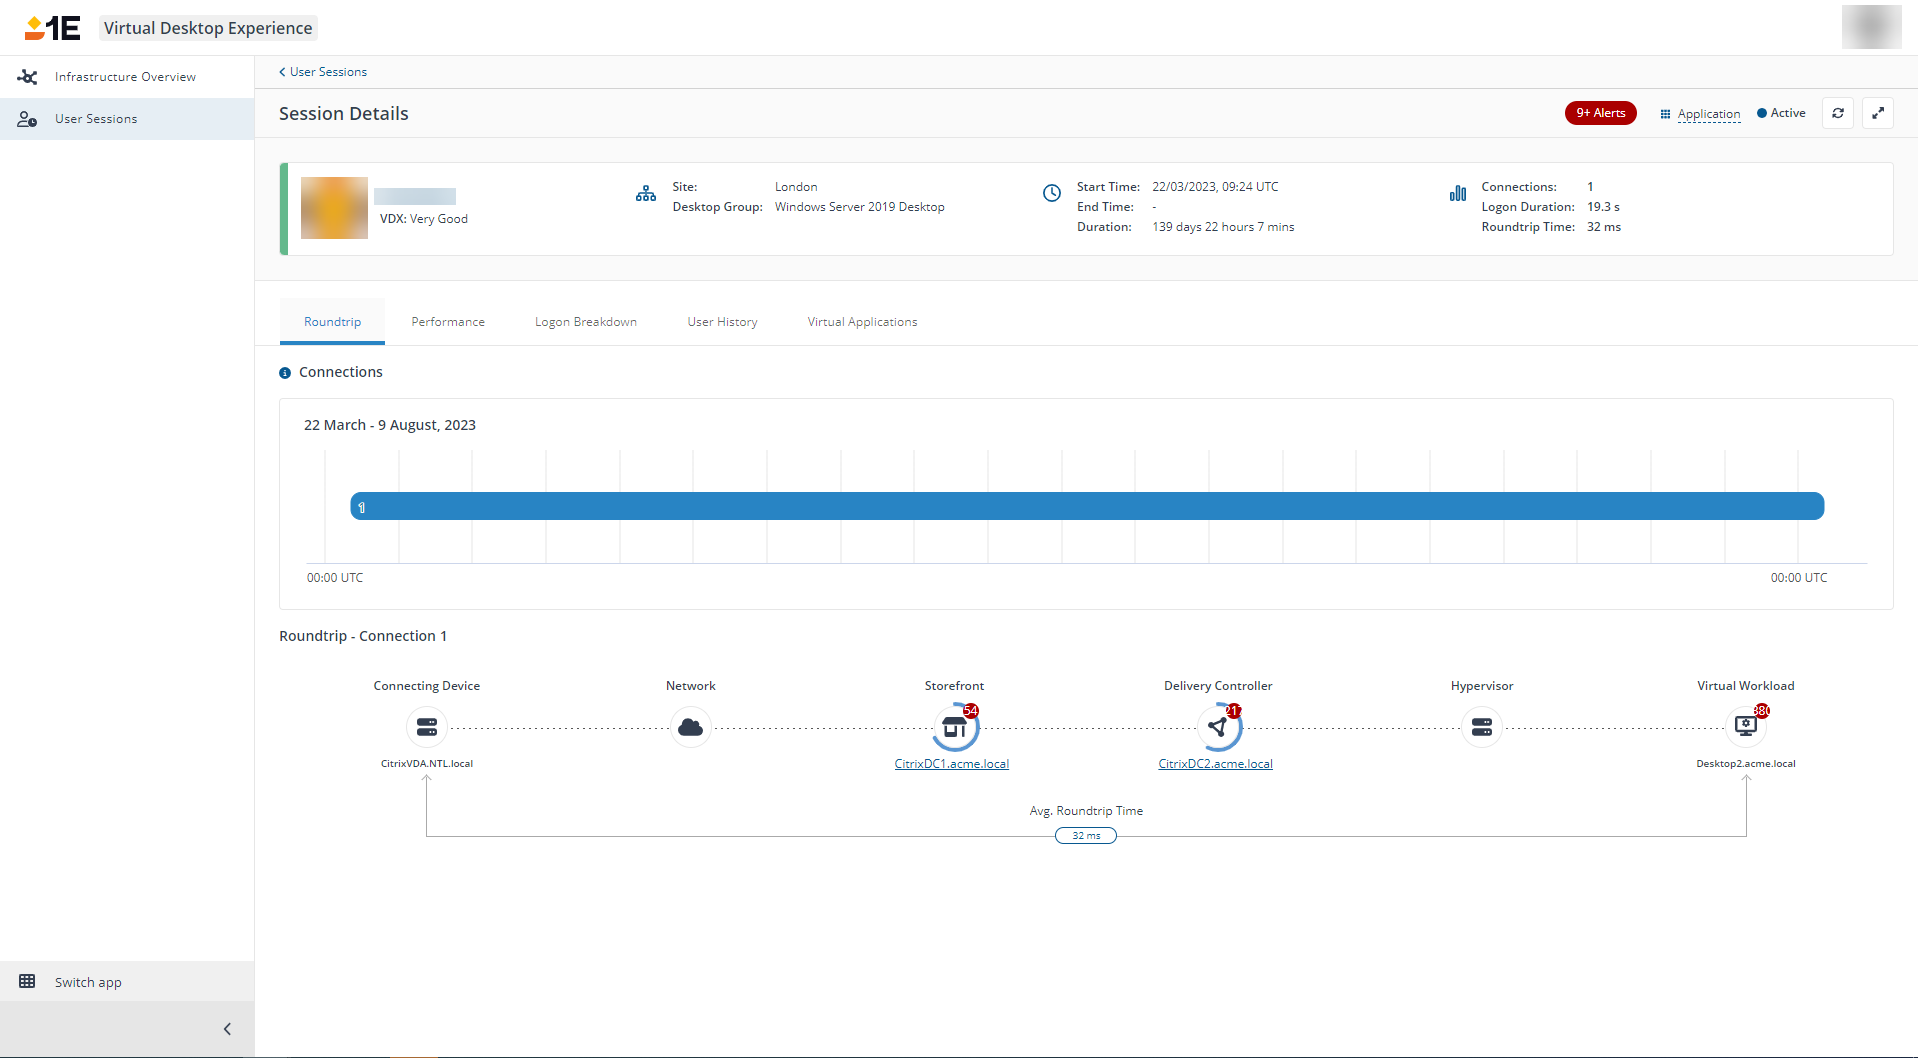
It also includes number of tabs with additional information:
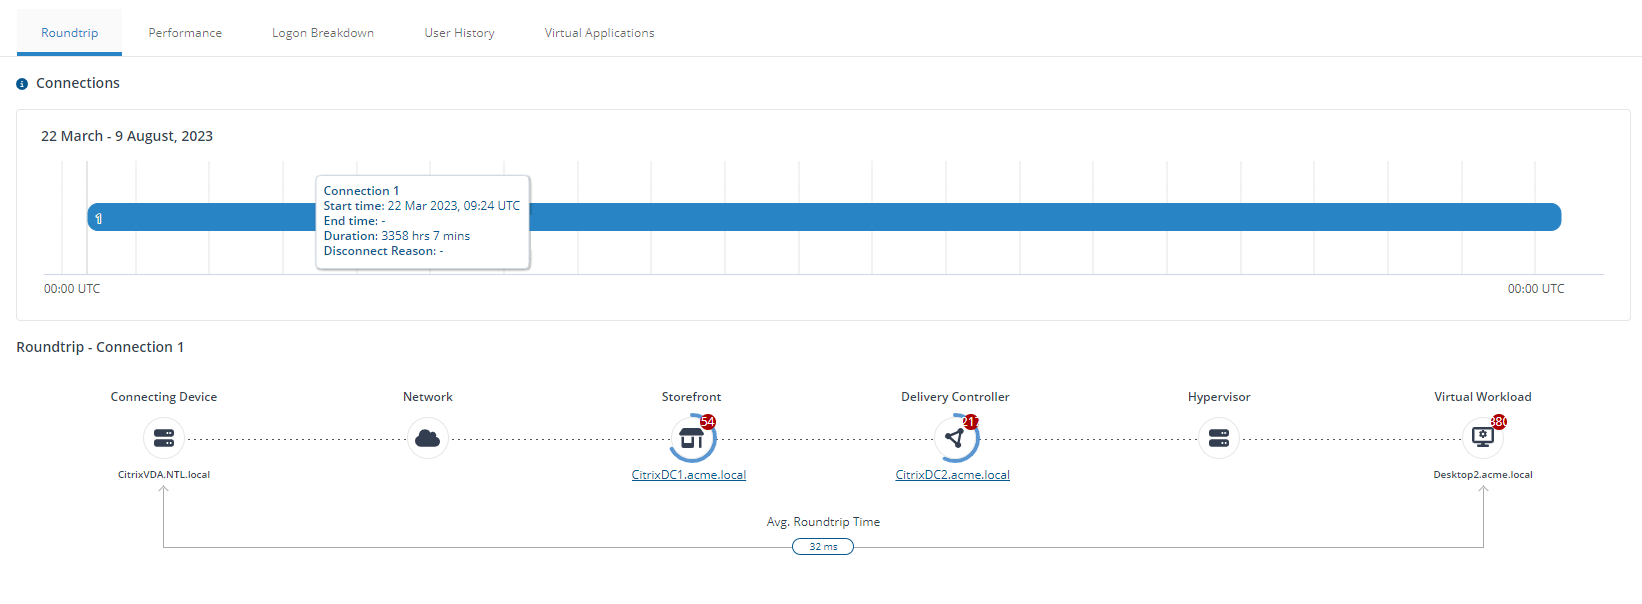
Roundtrip - displays all the relevant parts of the VDI used to broker that user session
Performance - displays time series charts showing VDX score, round trip time, and virtual workload (CPU and Memory) data. Any alerts generated will also display overlaid over the graph for Virtual Workload.
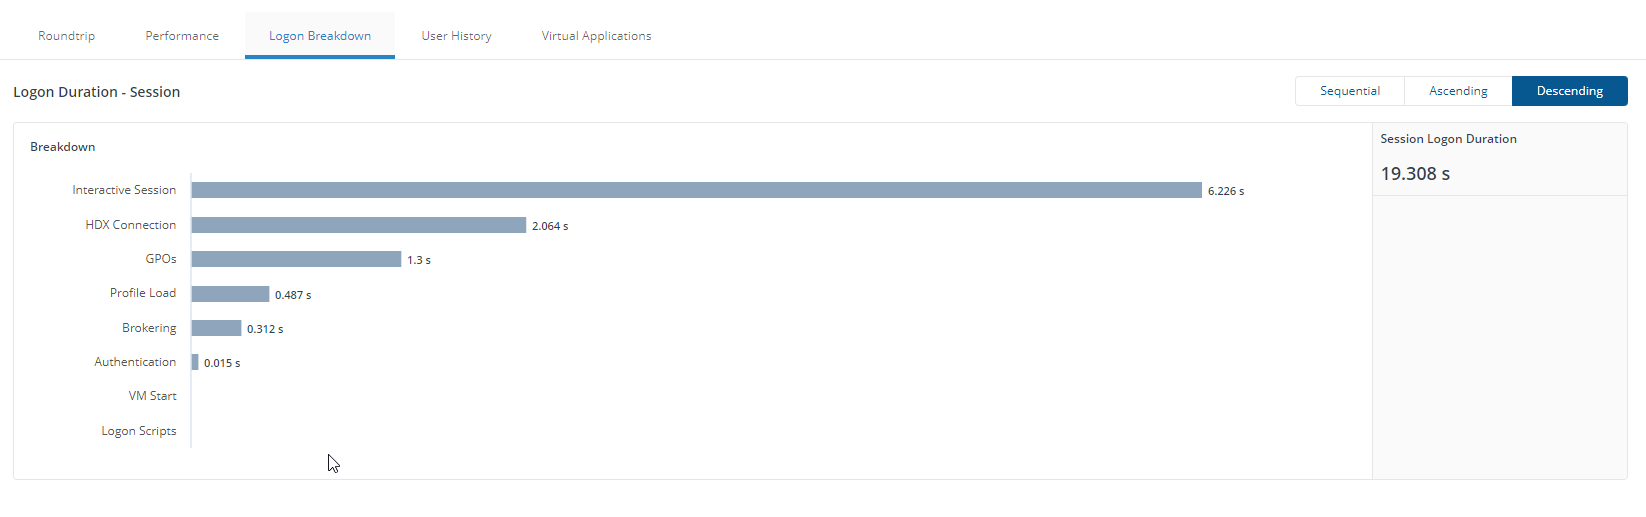
Logon Breakdown - shows the breakdown of how long different elements of the logon process took. For example GPOs, profile load, authentication, and more.
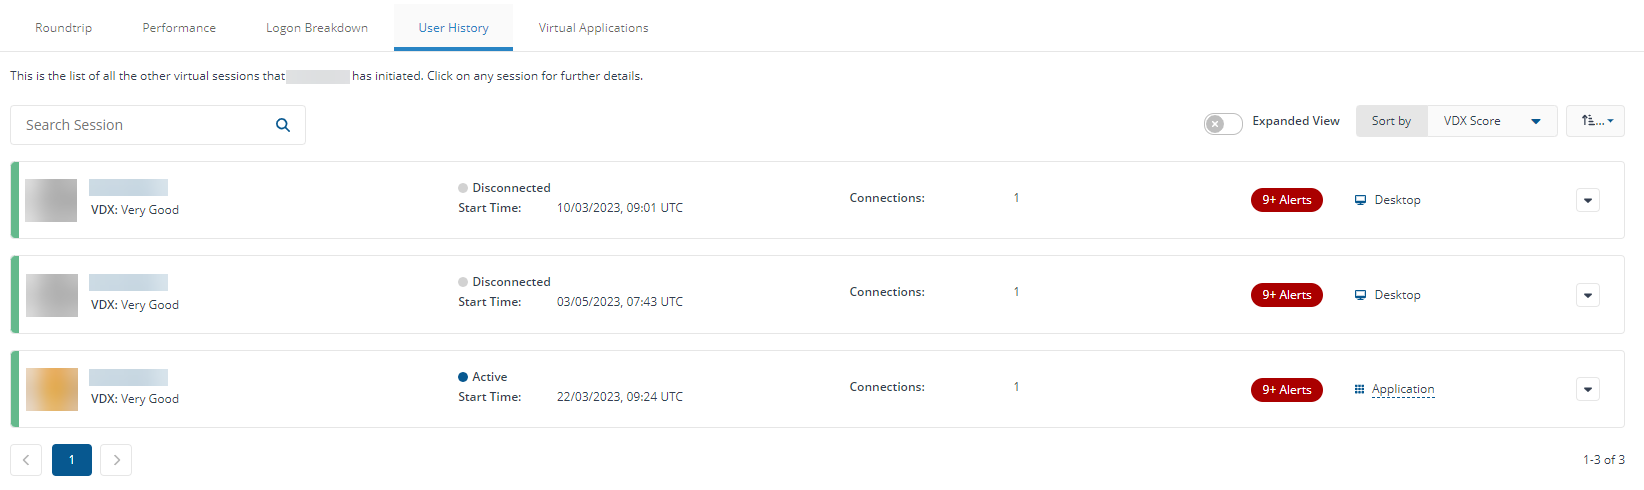
User History - displays previous sessions for that user, going back up to 28 days.
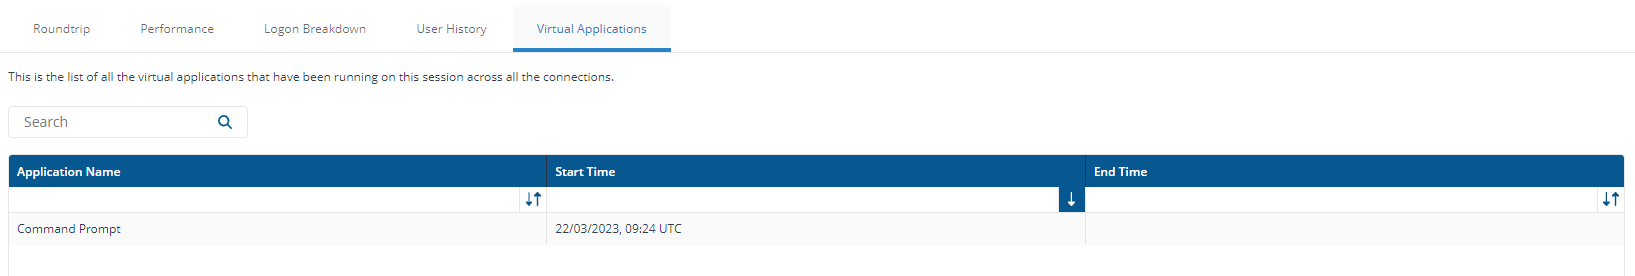
Virtual Applications - view published applications running as part of this session, across all connections.