Advanced Analytics menu
The Advanced Analytics menu contains two pages providing information to IT Support team members:
Networkpage, where they can monitor and manage network performance throughout their enterprise
Boot & Login page, where they can monitor and manage end-user boot and login experience throughout their enterprise.
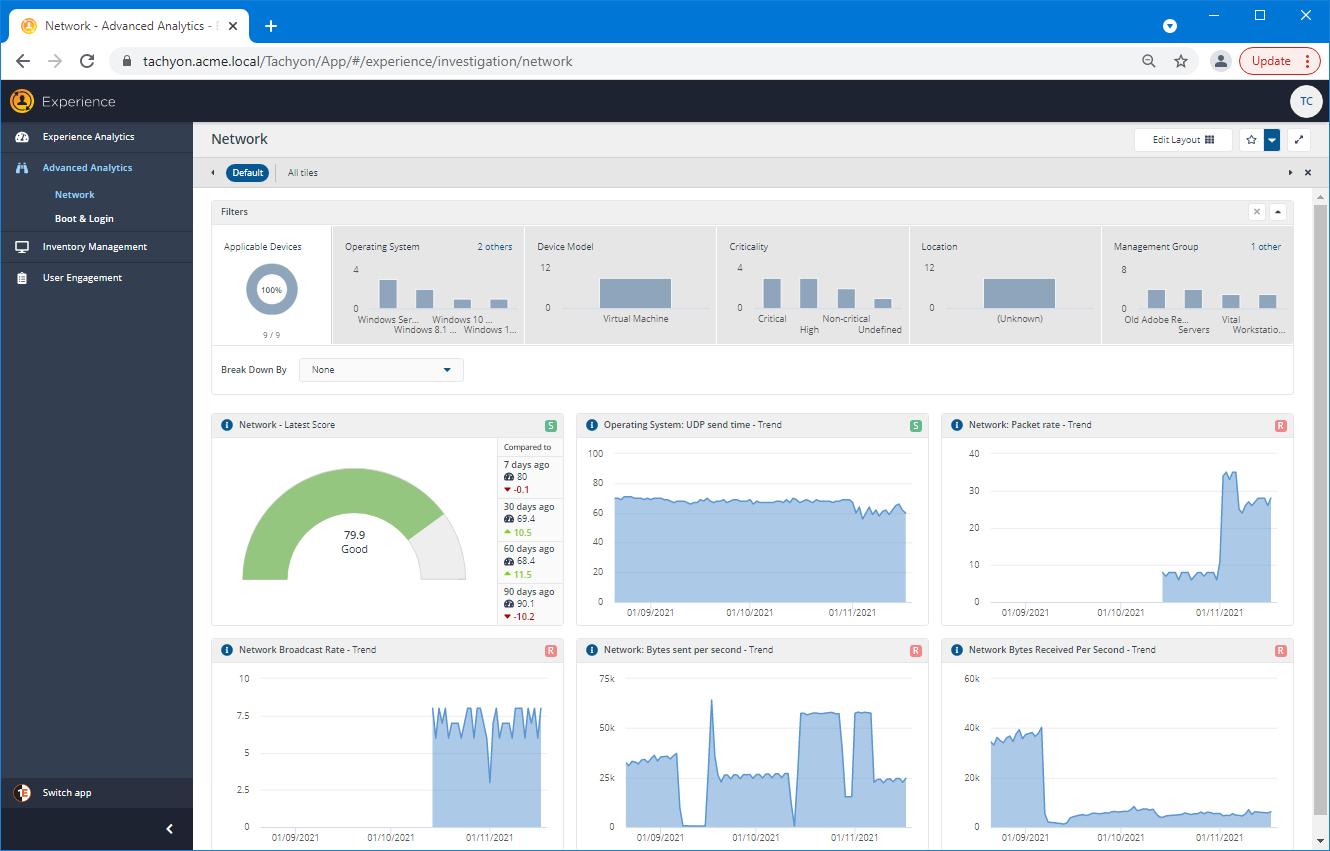
Network page
The Network page provides information to IT Support team members, so they can monitor and manage network performance throughout their enterprise. By default, this page displays the following tiles:
Network - Latest Score
Operating System: UDP send time - Trend
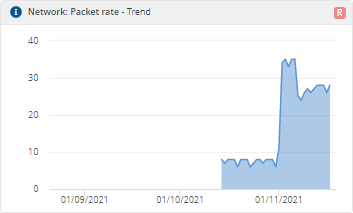
Network: Packet rate - Trend
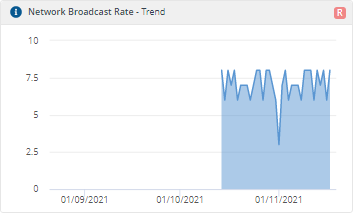
Network Broadcast Rate - Trend
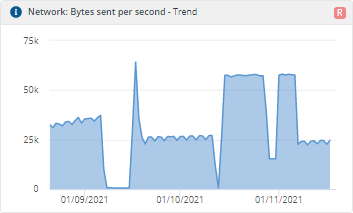
Network: Bytes sent per second - Trend
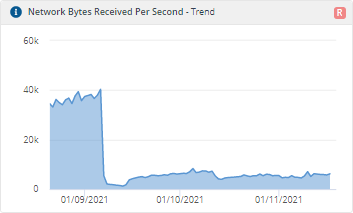
Network Bytes Received per second - Trend
Please refer to Investigating Network Performance for more information on how to use this feature.
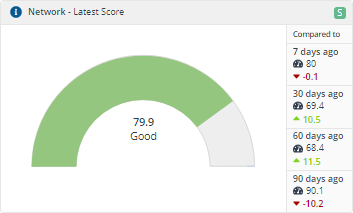
Network - Latest Score
This chart displays a score for device network stack performance based on: the Wireless signal quality, the UDP send time and the output queue length (does not include physical network considerations, such as latency).
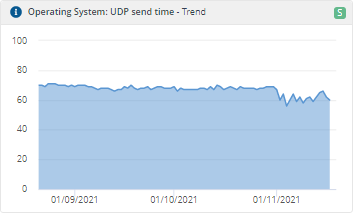
Operating System: UDP send time - Trend
This chart provides a score for the time taken to perform a basic loopback UDP send. A lower score may indicate problems with the operating system network stack.
Network: Packet rate - Trend
This chart provides an overview of the sum of all TCP packets that have been sent and received per second; represents a measure of network resource utilization on the device.
Network Broadcast Rate - Trend
This chart provides an overview of the sum of all multicast packets that have been sent and received per second (across all physical network interfaces on the device).
Network: Bytes sent per second - Trend
This chart provides an overview of the average number of bytes sent per second across all network adapters.
Network Bytes Received per second - Trend
This chart provides an overview of the average number of bytes received per second across all network adapters.
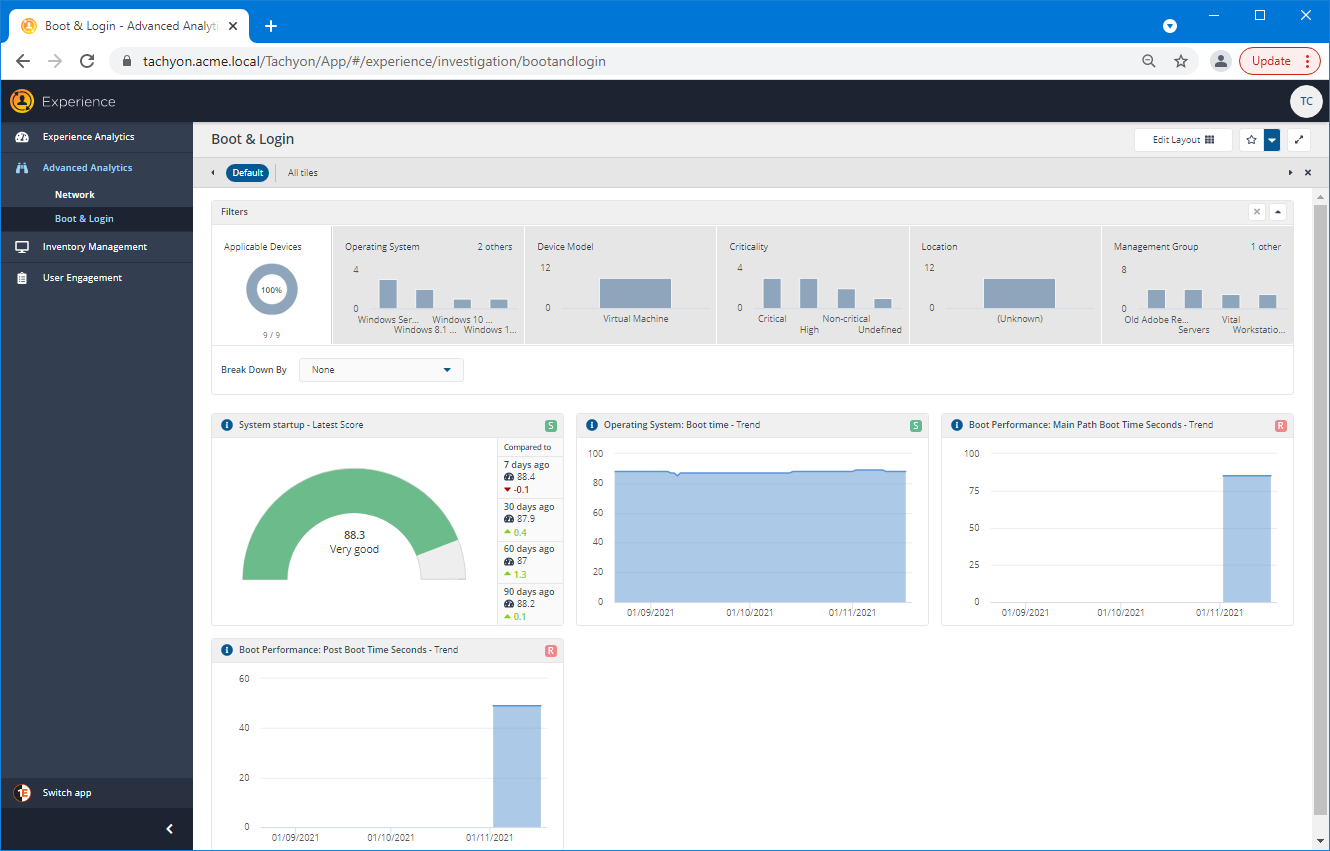
Boot and Login page
The Boot & Login page provides information to IT Support team members, so they can monitor and manage end-user boot and login experience throughout their enterprise. By default, this page displays the following tiles:
System startup - Latest Score
Operating System: Boot time - Trend
Boot Performance: Main Path Boot Time Seconds - Trend
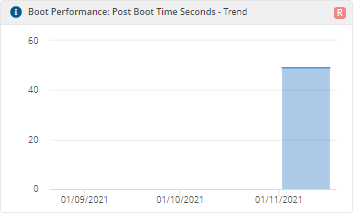
Boot Performance: Post Boot Time Seconds - Trend
Please refer to Investigating Boot and Login Performance for more information on how to use this feature.
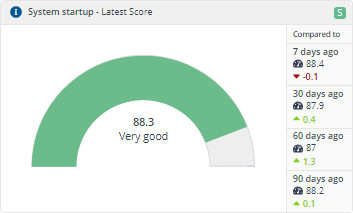
System startup - Latest Score
This chart provides a score derived from operating system startup times for devices.
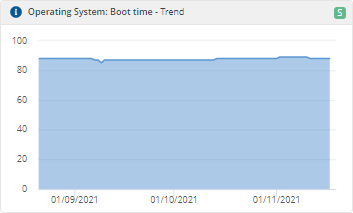
Operating System: Boot time - Trend
This chart provides a score derived from the times taken for devices to boot to the logon prompt. A lower score indicates a long boot up duration, which may affect user satisfaction.
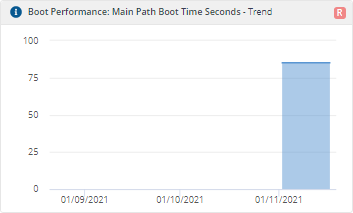
Boot Performance: Main Path Boot Time Seconds - Trend
This chart provides an overview across all devices, of the time taken (in seconds) to perform the Main Path step of the boot sequence, which starts when the Windows splash screen appears and ends when the desktop becomes available.
Boot Performance: Post Boot Time Seconds - Trend
This chart provides an overview across all devices, of the the time taken (in seconds) to perform the Post-boot step of the boot sequence, which starts when the desktop appears and ends when the system reaches a certain idle state having initialized services and applications.