Running, approving instructions and viewing responses
Running and approving 1E instructions from the ServiceNow Incidents page.
The 1E ITSM Connect app allows an ITIL user in ServiceNow to investigate and remediate any issue faced by a user on his machine. This can be done by firing appropriate 1E instructions from ITSM module of ServiceNow. This way, an ITIL user can resolve issues without even visiting the computer or having minimal interaction with the affected user.
The ITIL user can trigger a 1E instruction from three places in 1E ITSM Connect. These are from either:
Native UI
Agent Workspace or
Service Operations Workspace
Executing instructions in Native UI
How an ITIL user investigates an Incident using 1E
In order to investigate an incident, and run 1E instructions, the ITIL user needs to go to the incident form. To do this:
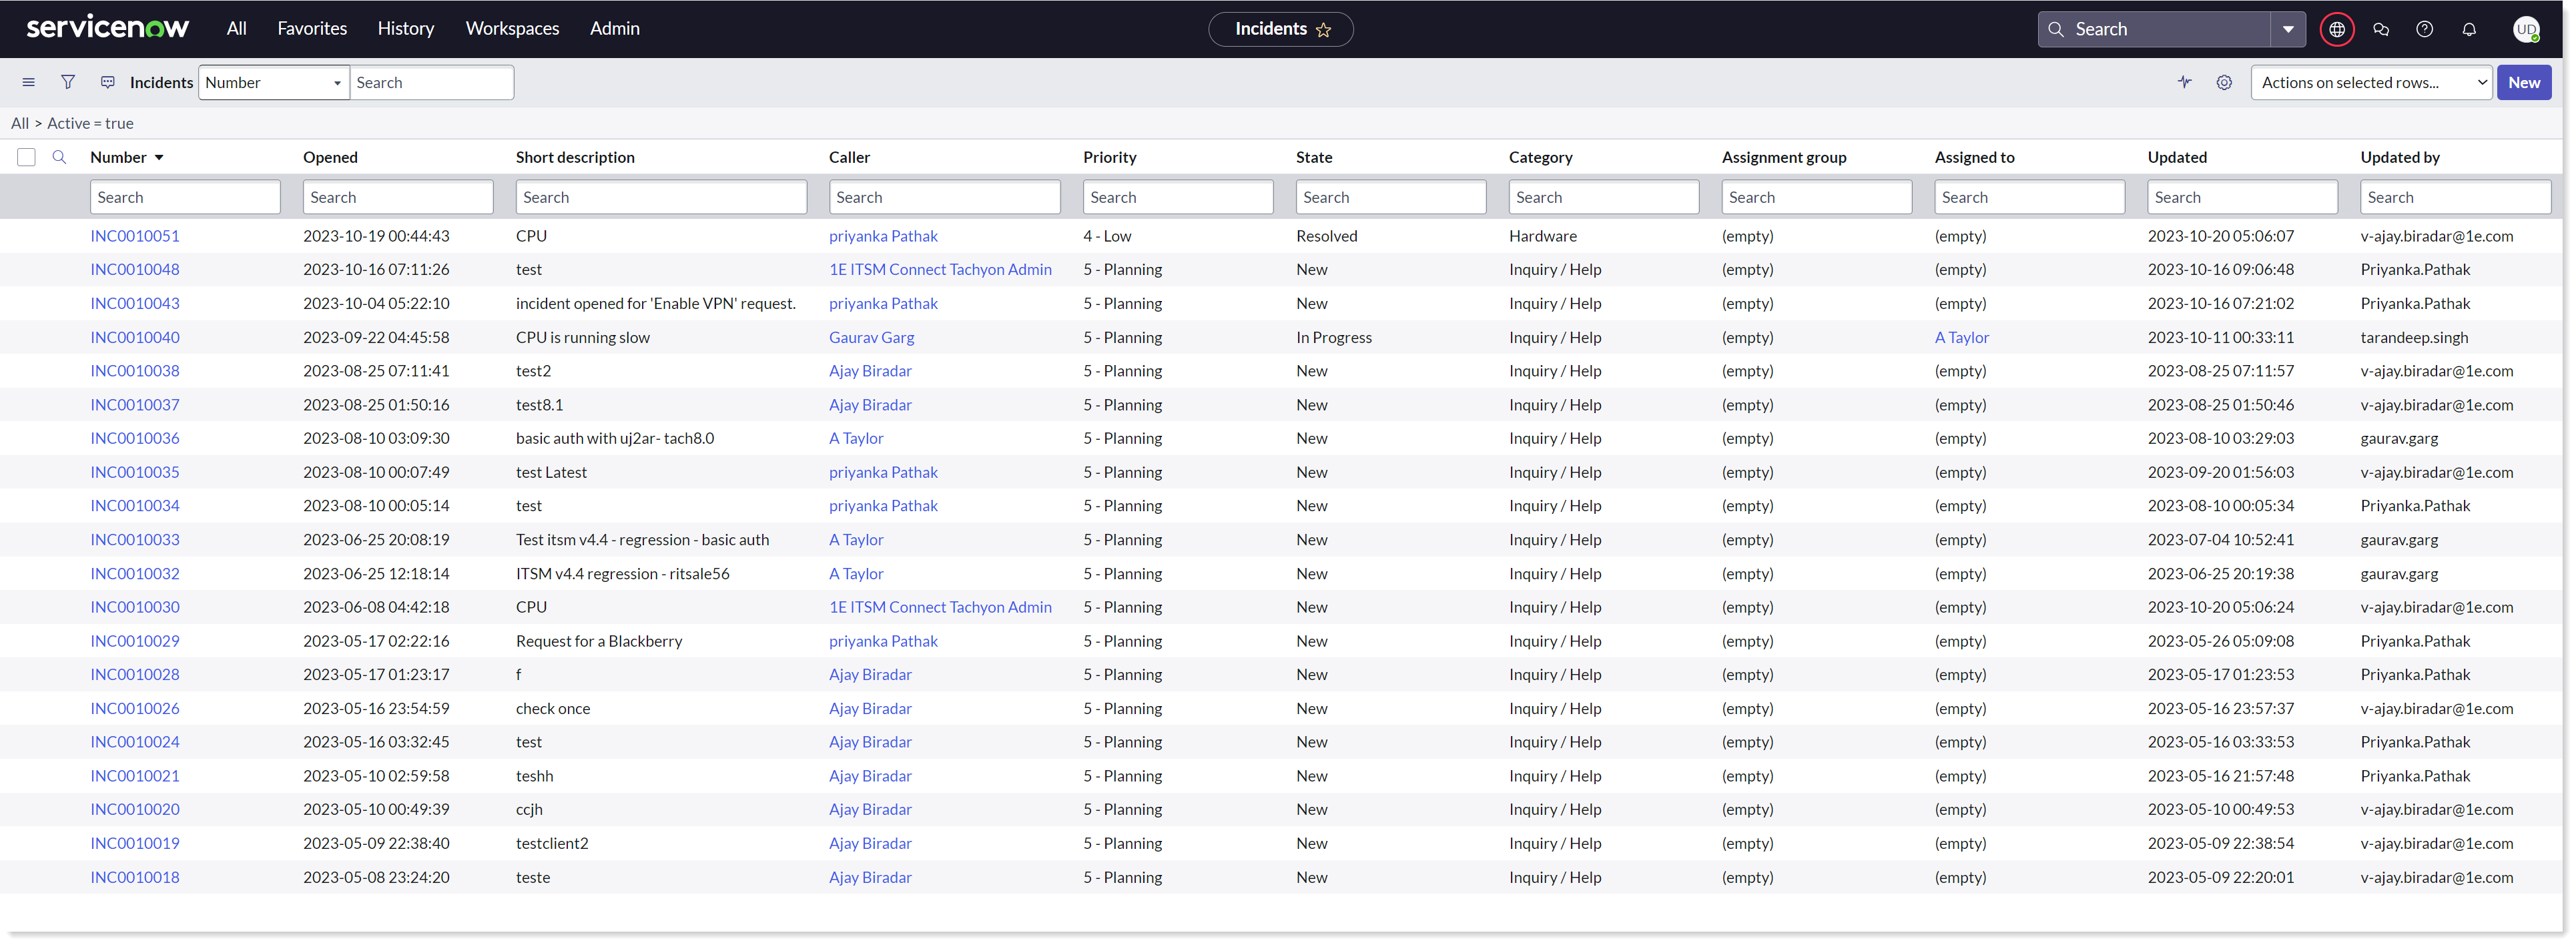
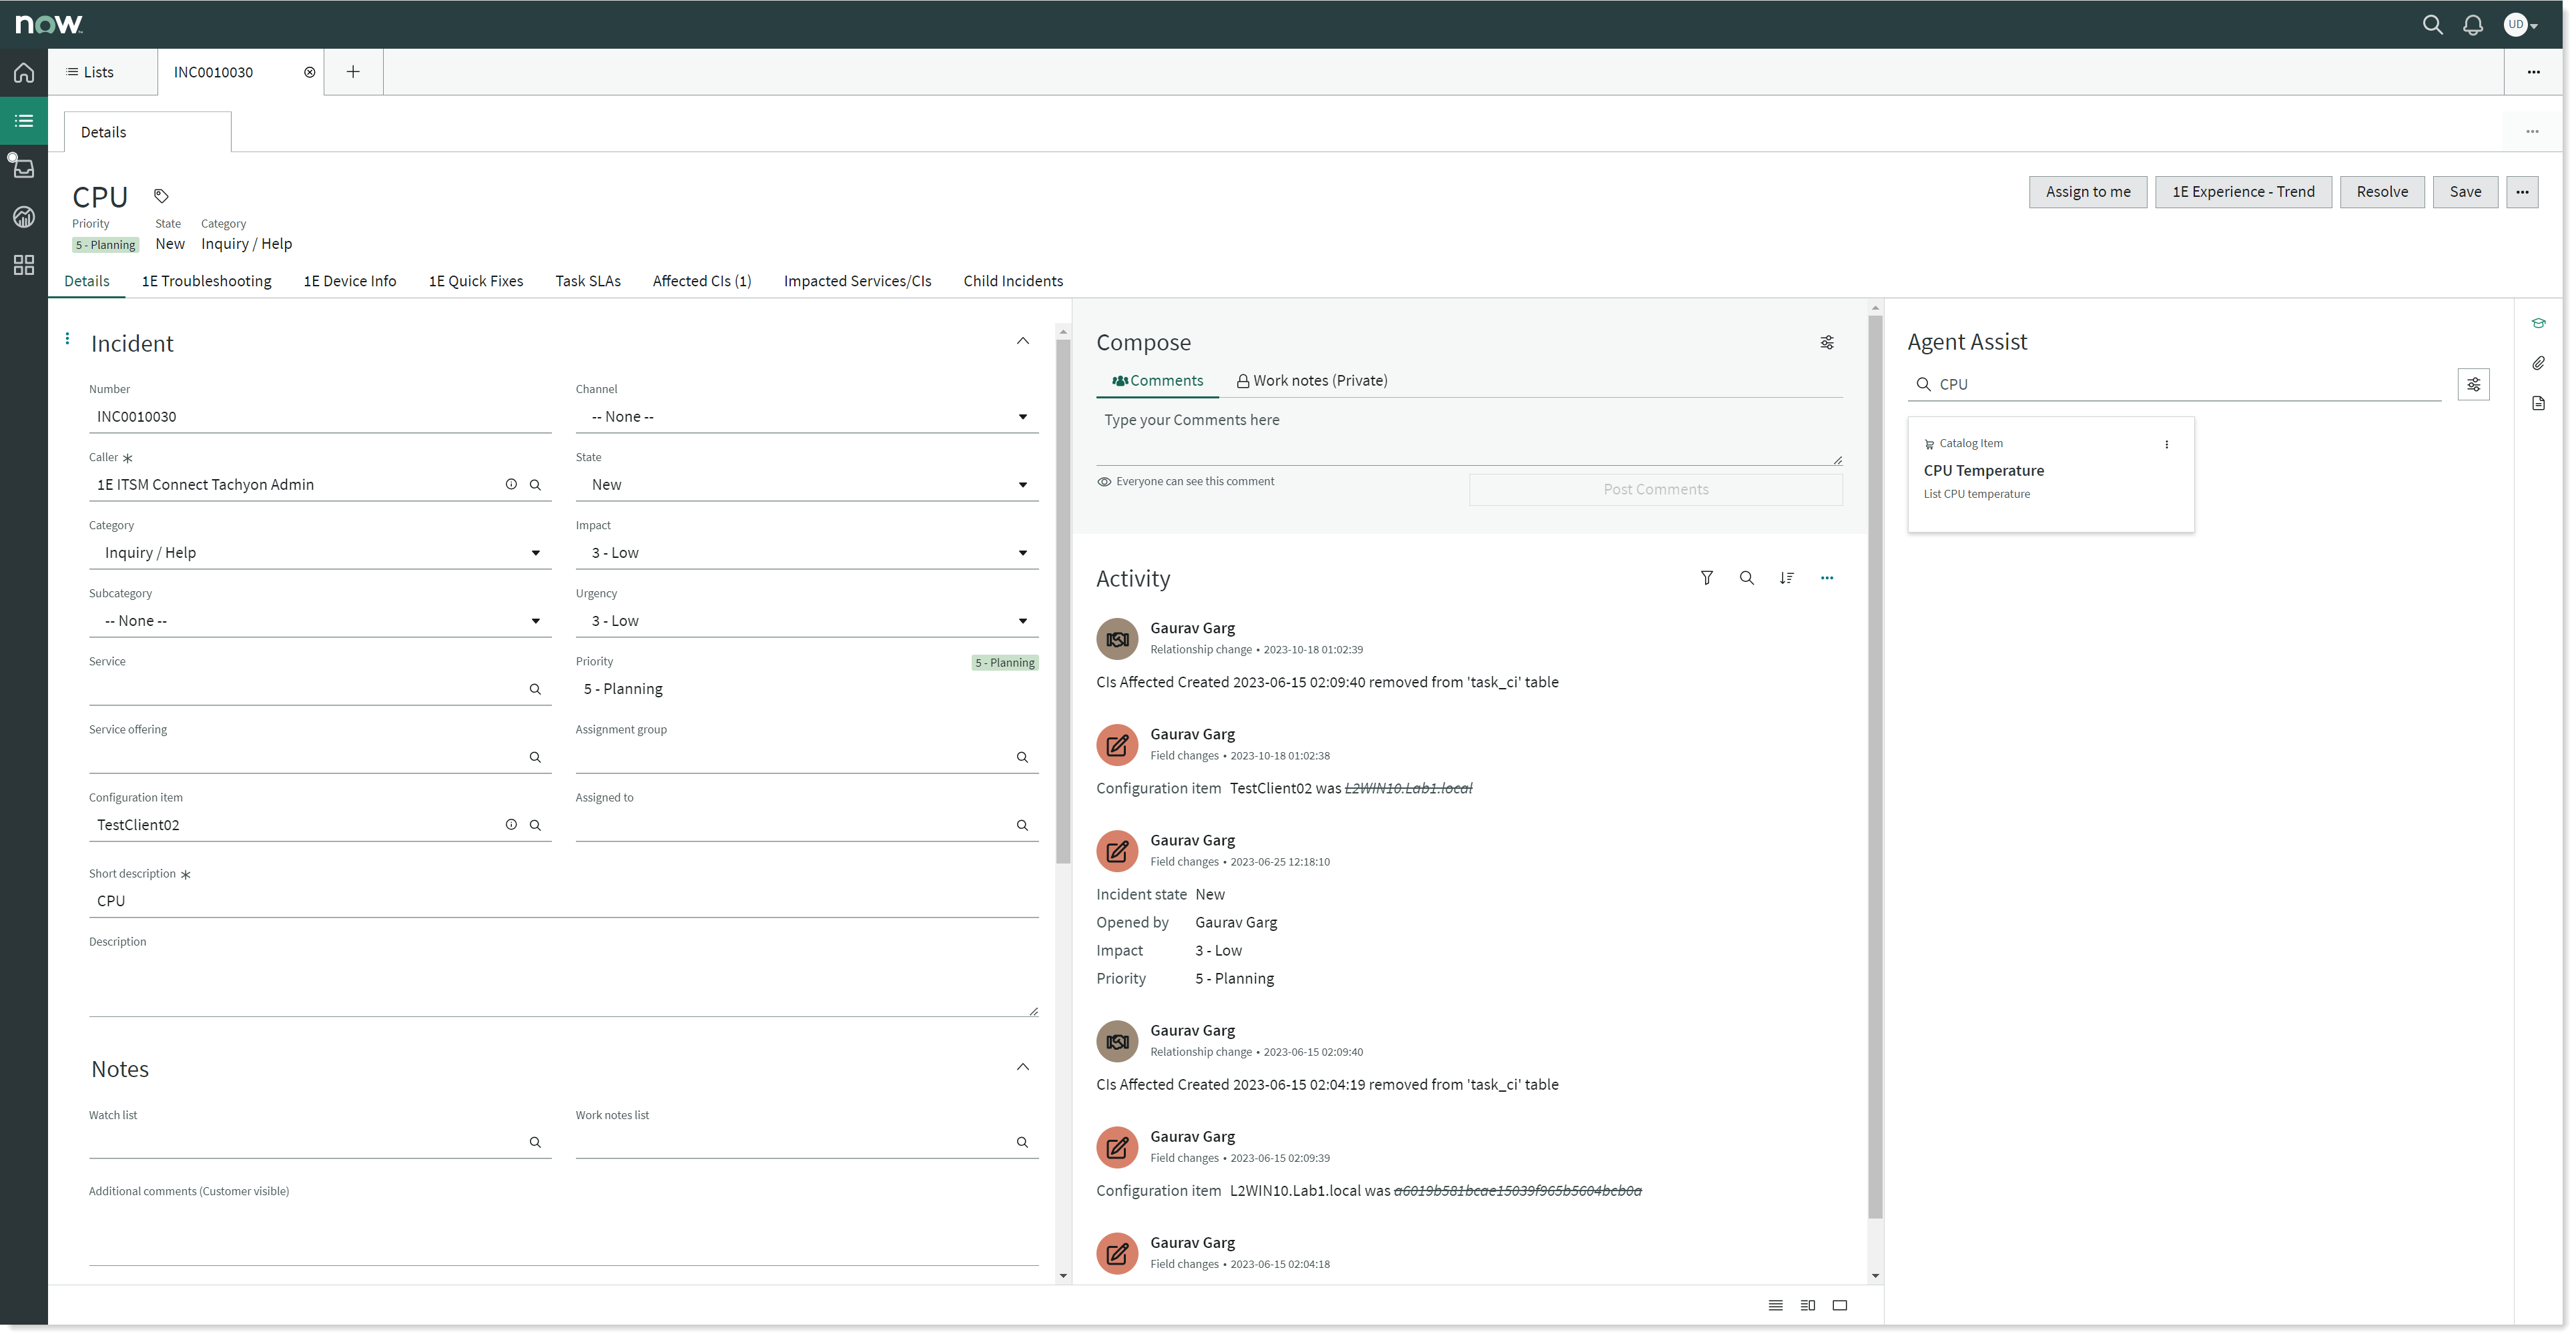
Open the incident you are working on by navigating to 1E ITSM Connect→Incidents in the application navigator. This displays the Incidents list in the right-hand pane, as shown in the picture.
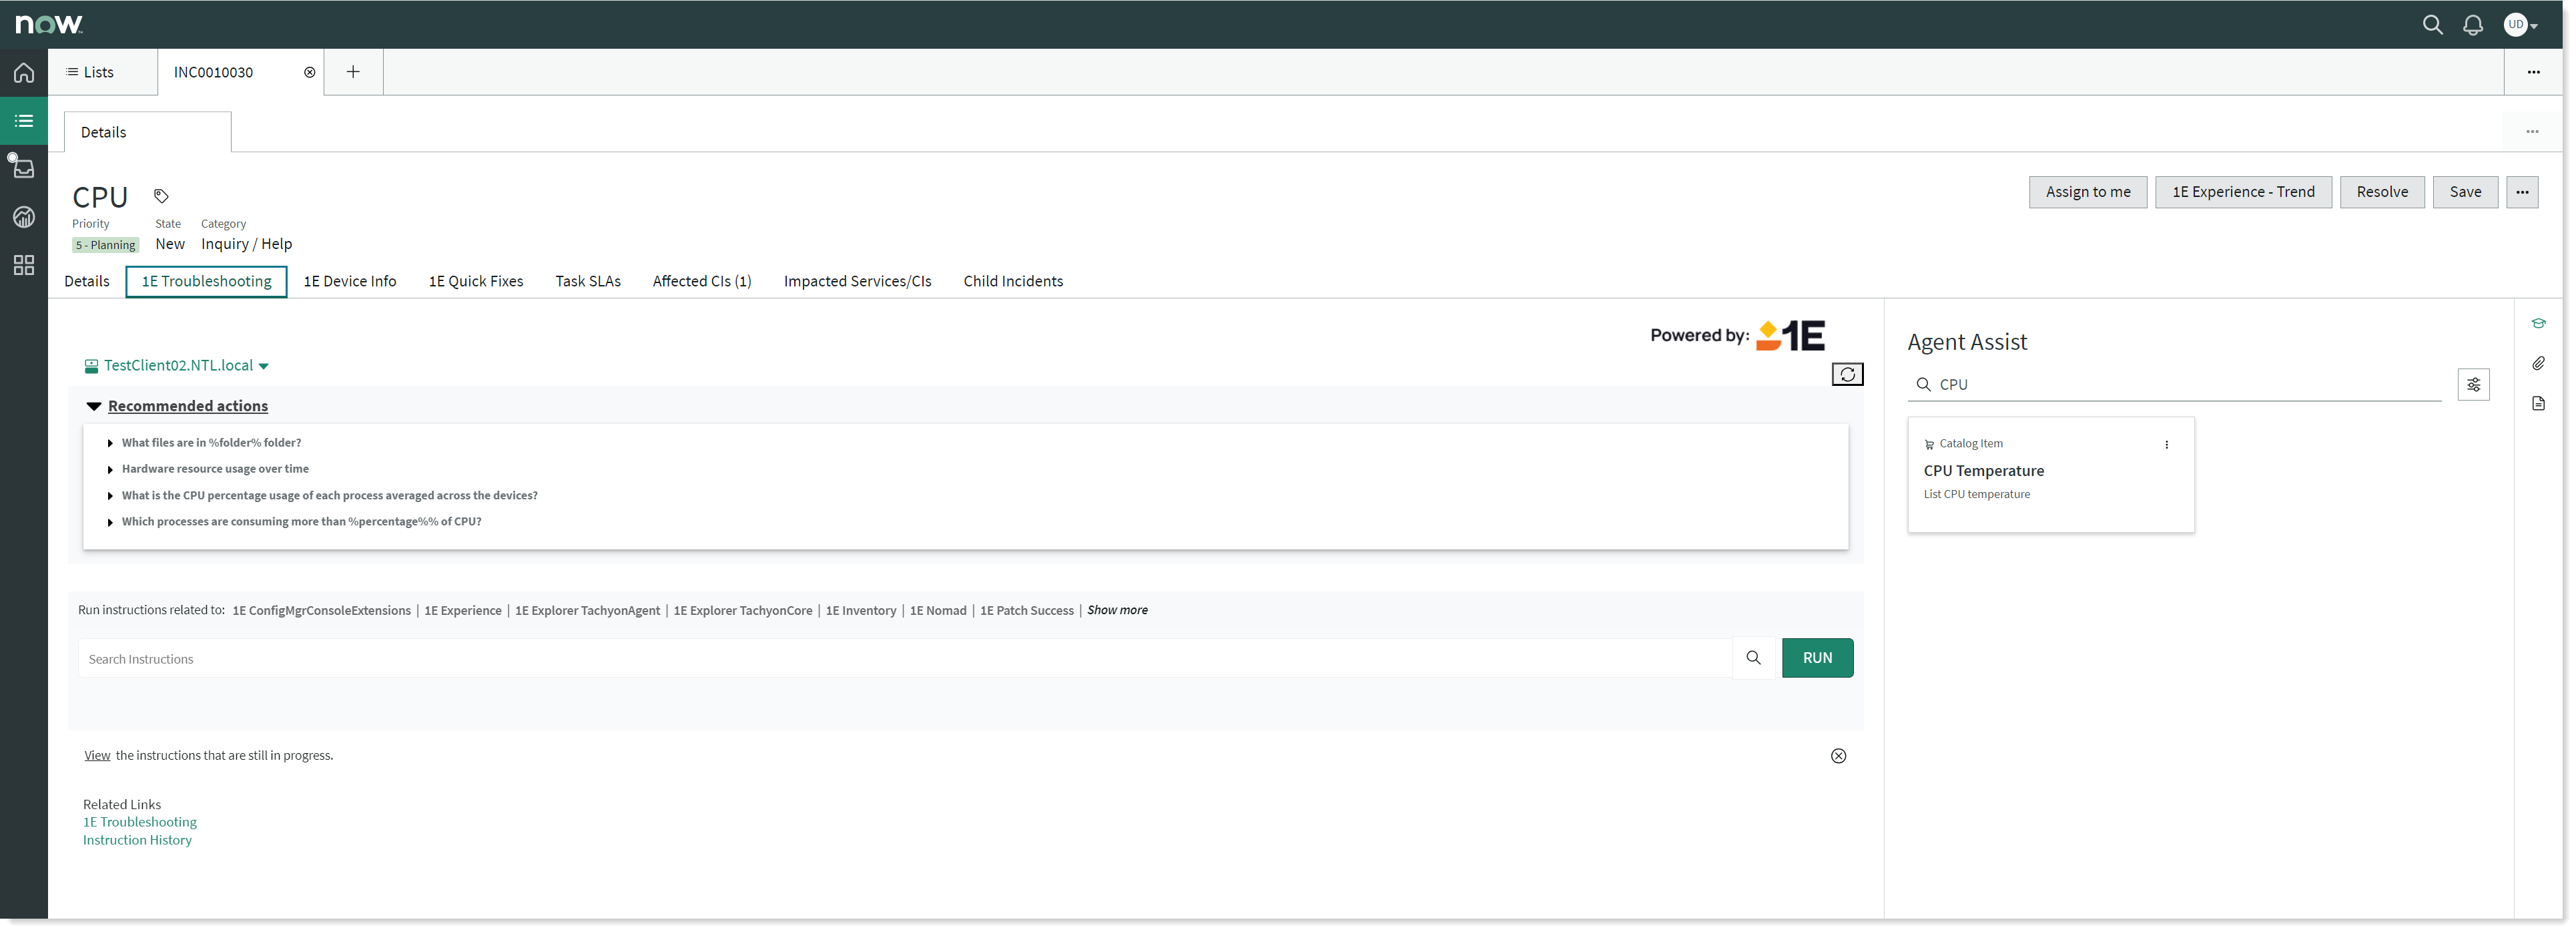
When you open the target incident, investigation and remediation actions using 1E can be accessed from the 1E ITSM Connect tab on the incident form, as shown in the picture. Ensure that the configuration item field contains the end-user's device name to execute the 1E instruction on it.
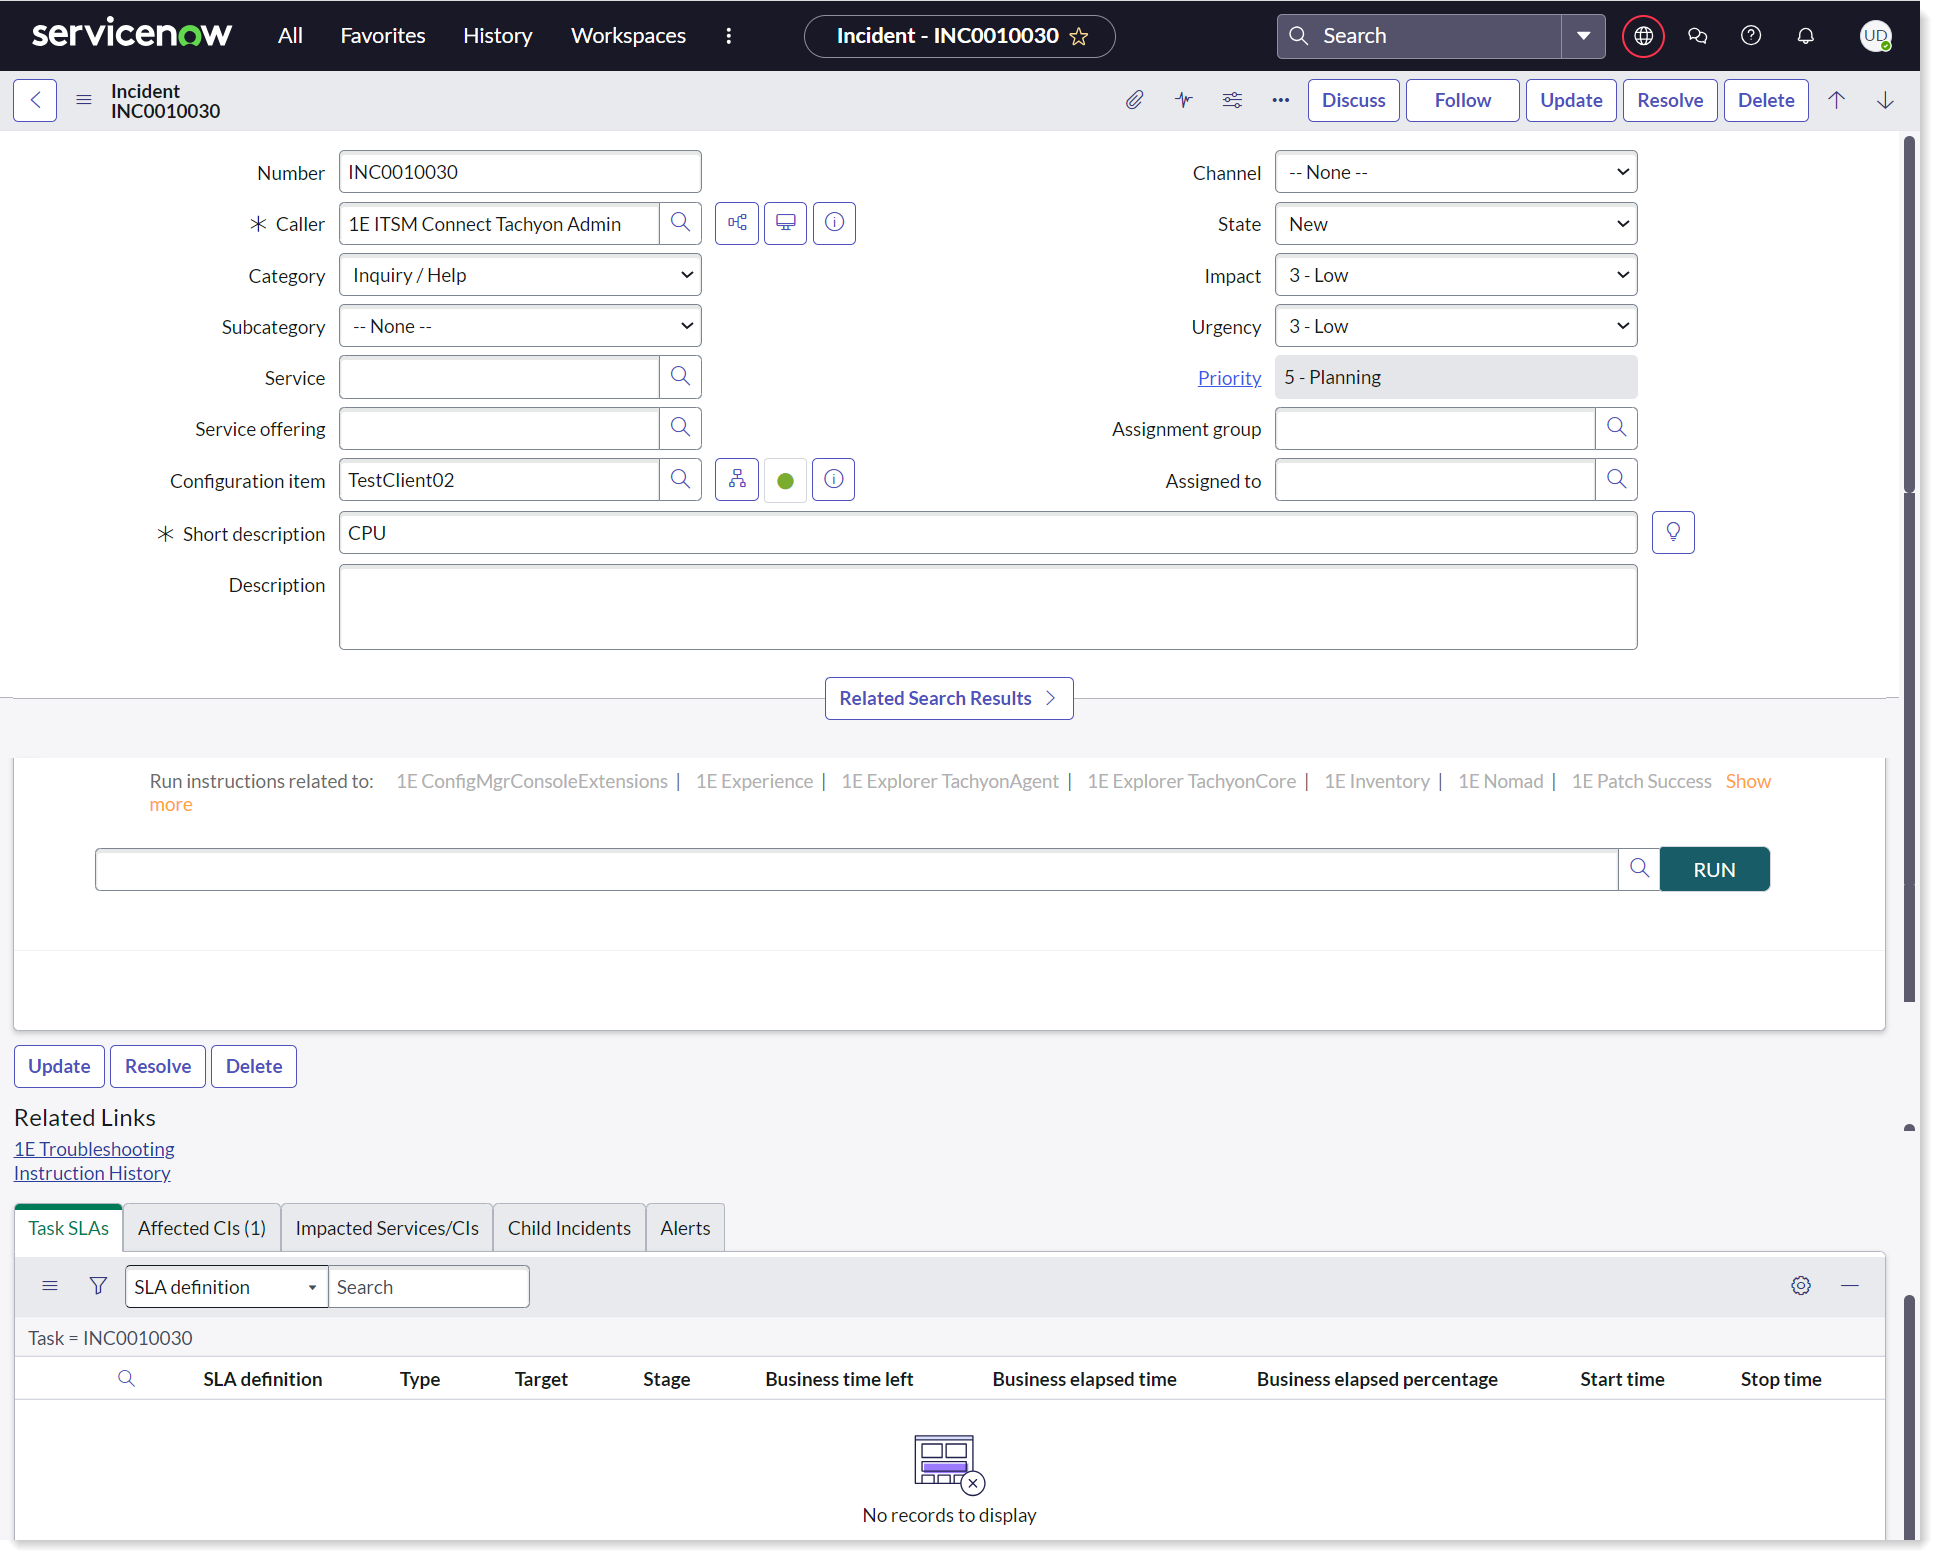
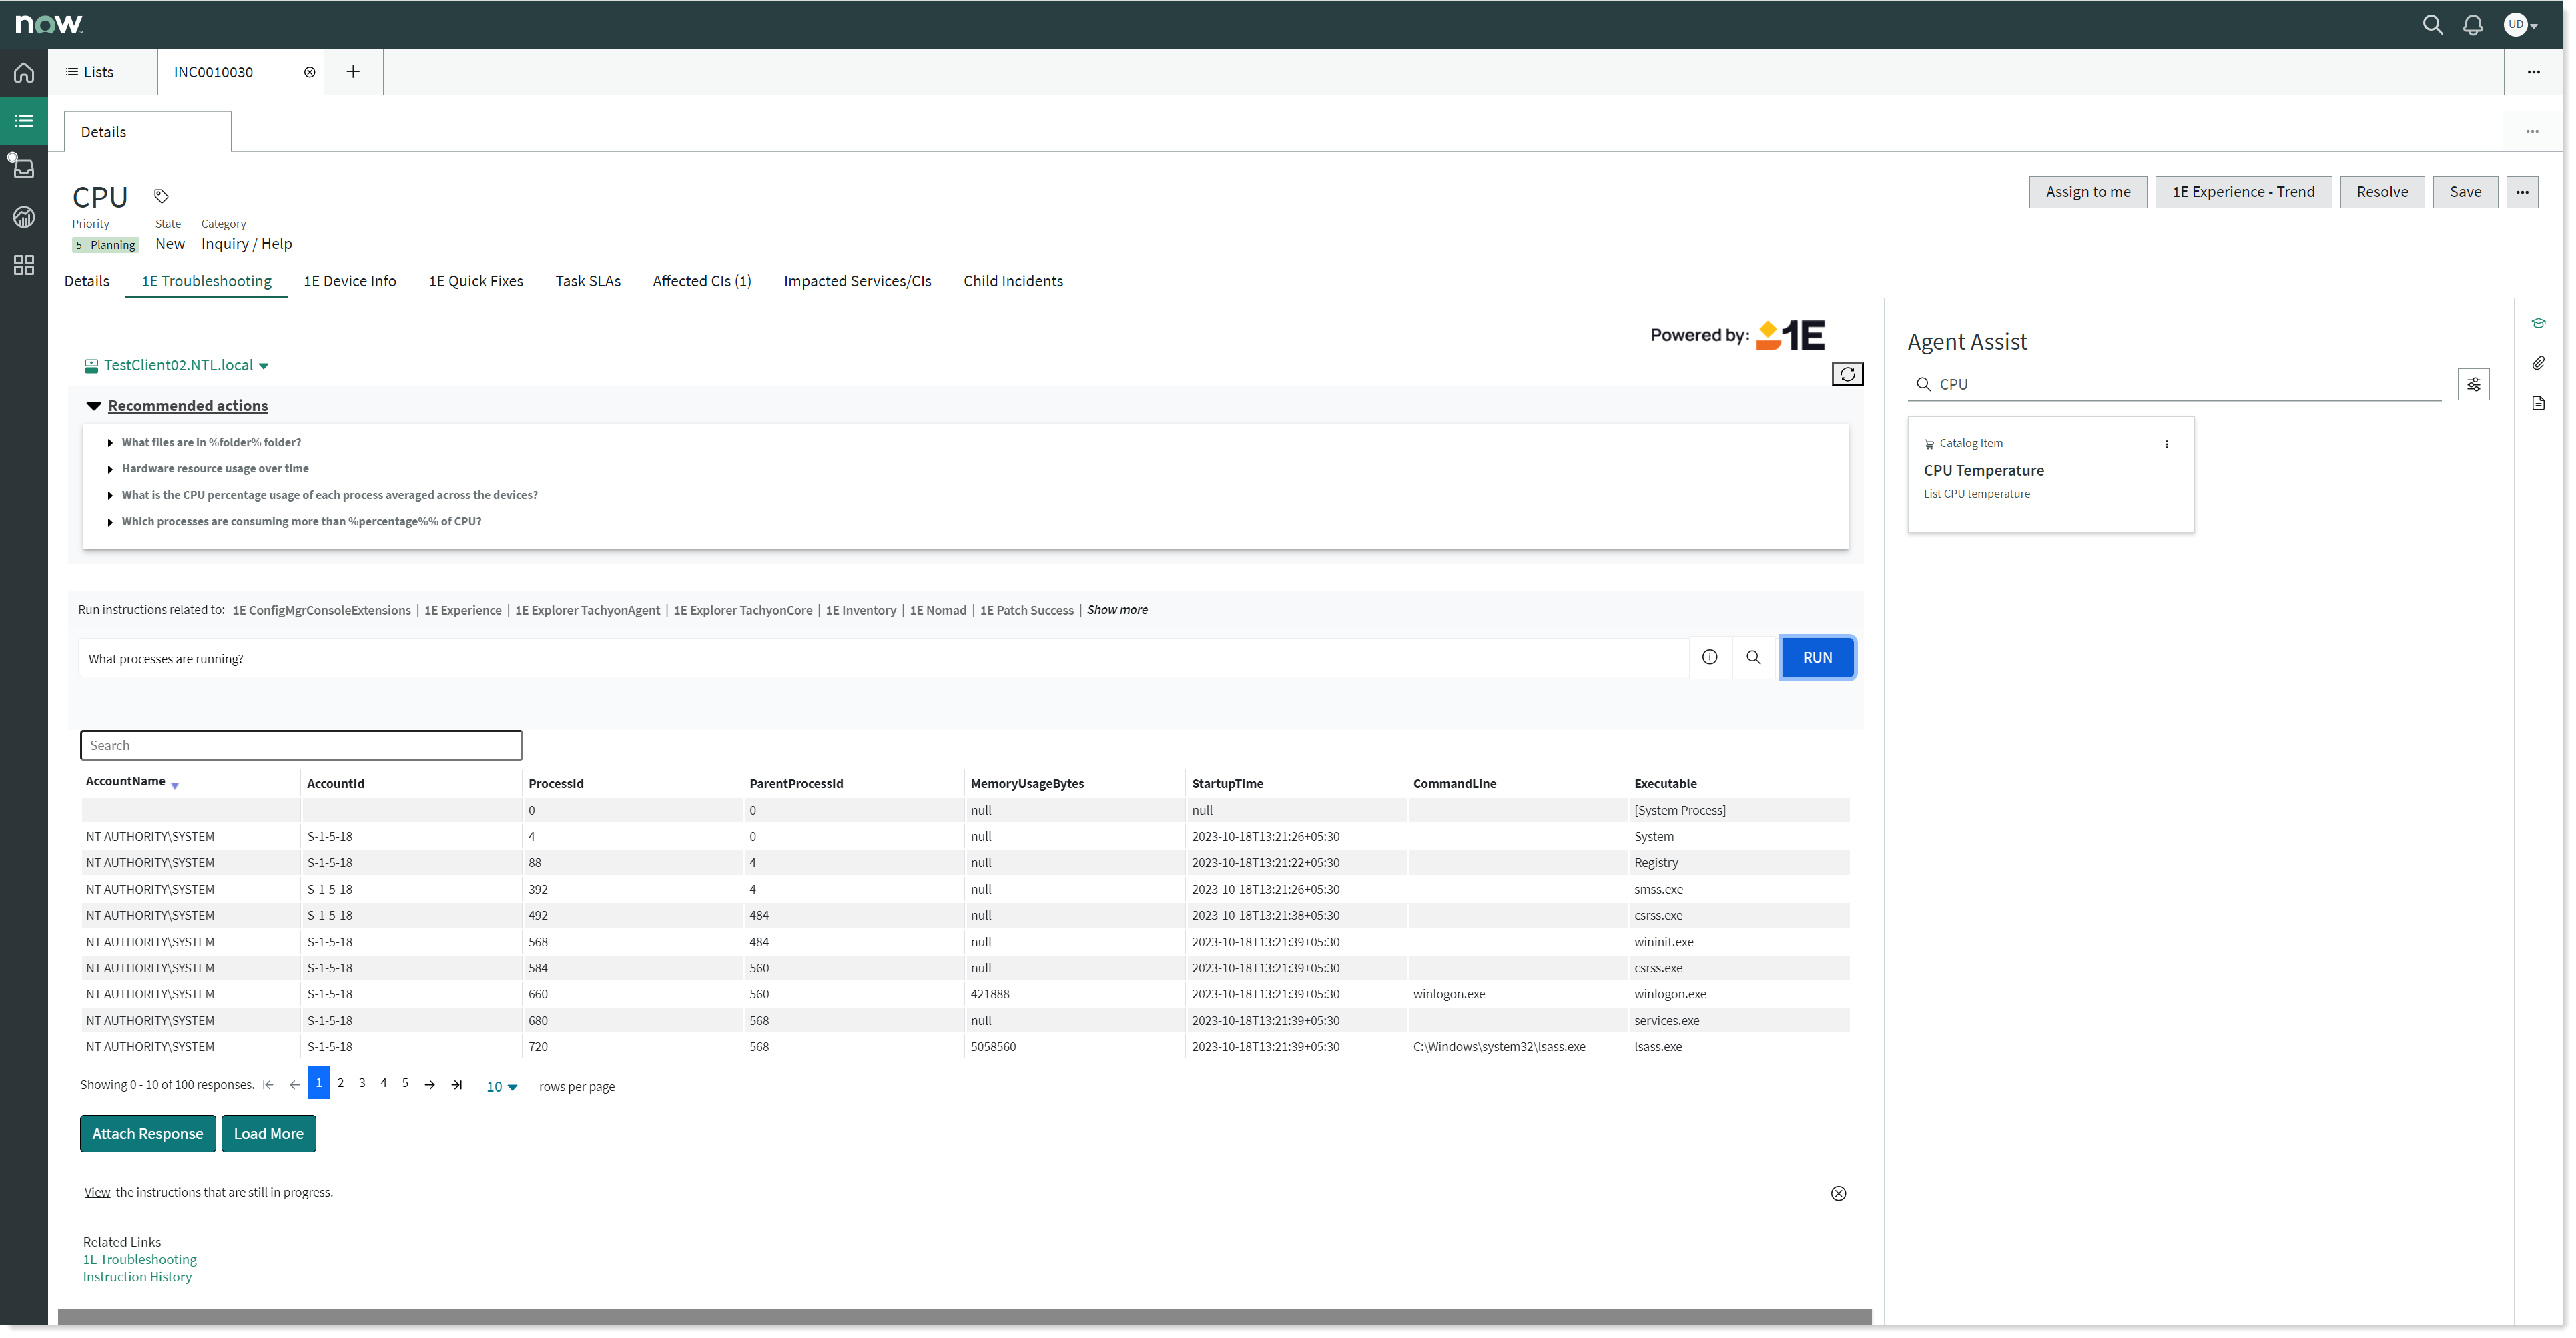
1E instructions are accessed by an emulation of the 1E Troubleshooting home page provided on the 1E ITSM Connect tab.
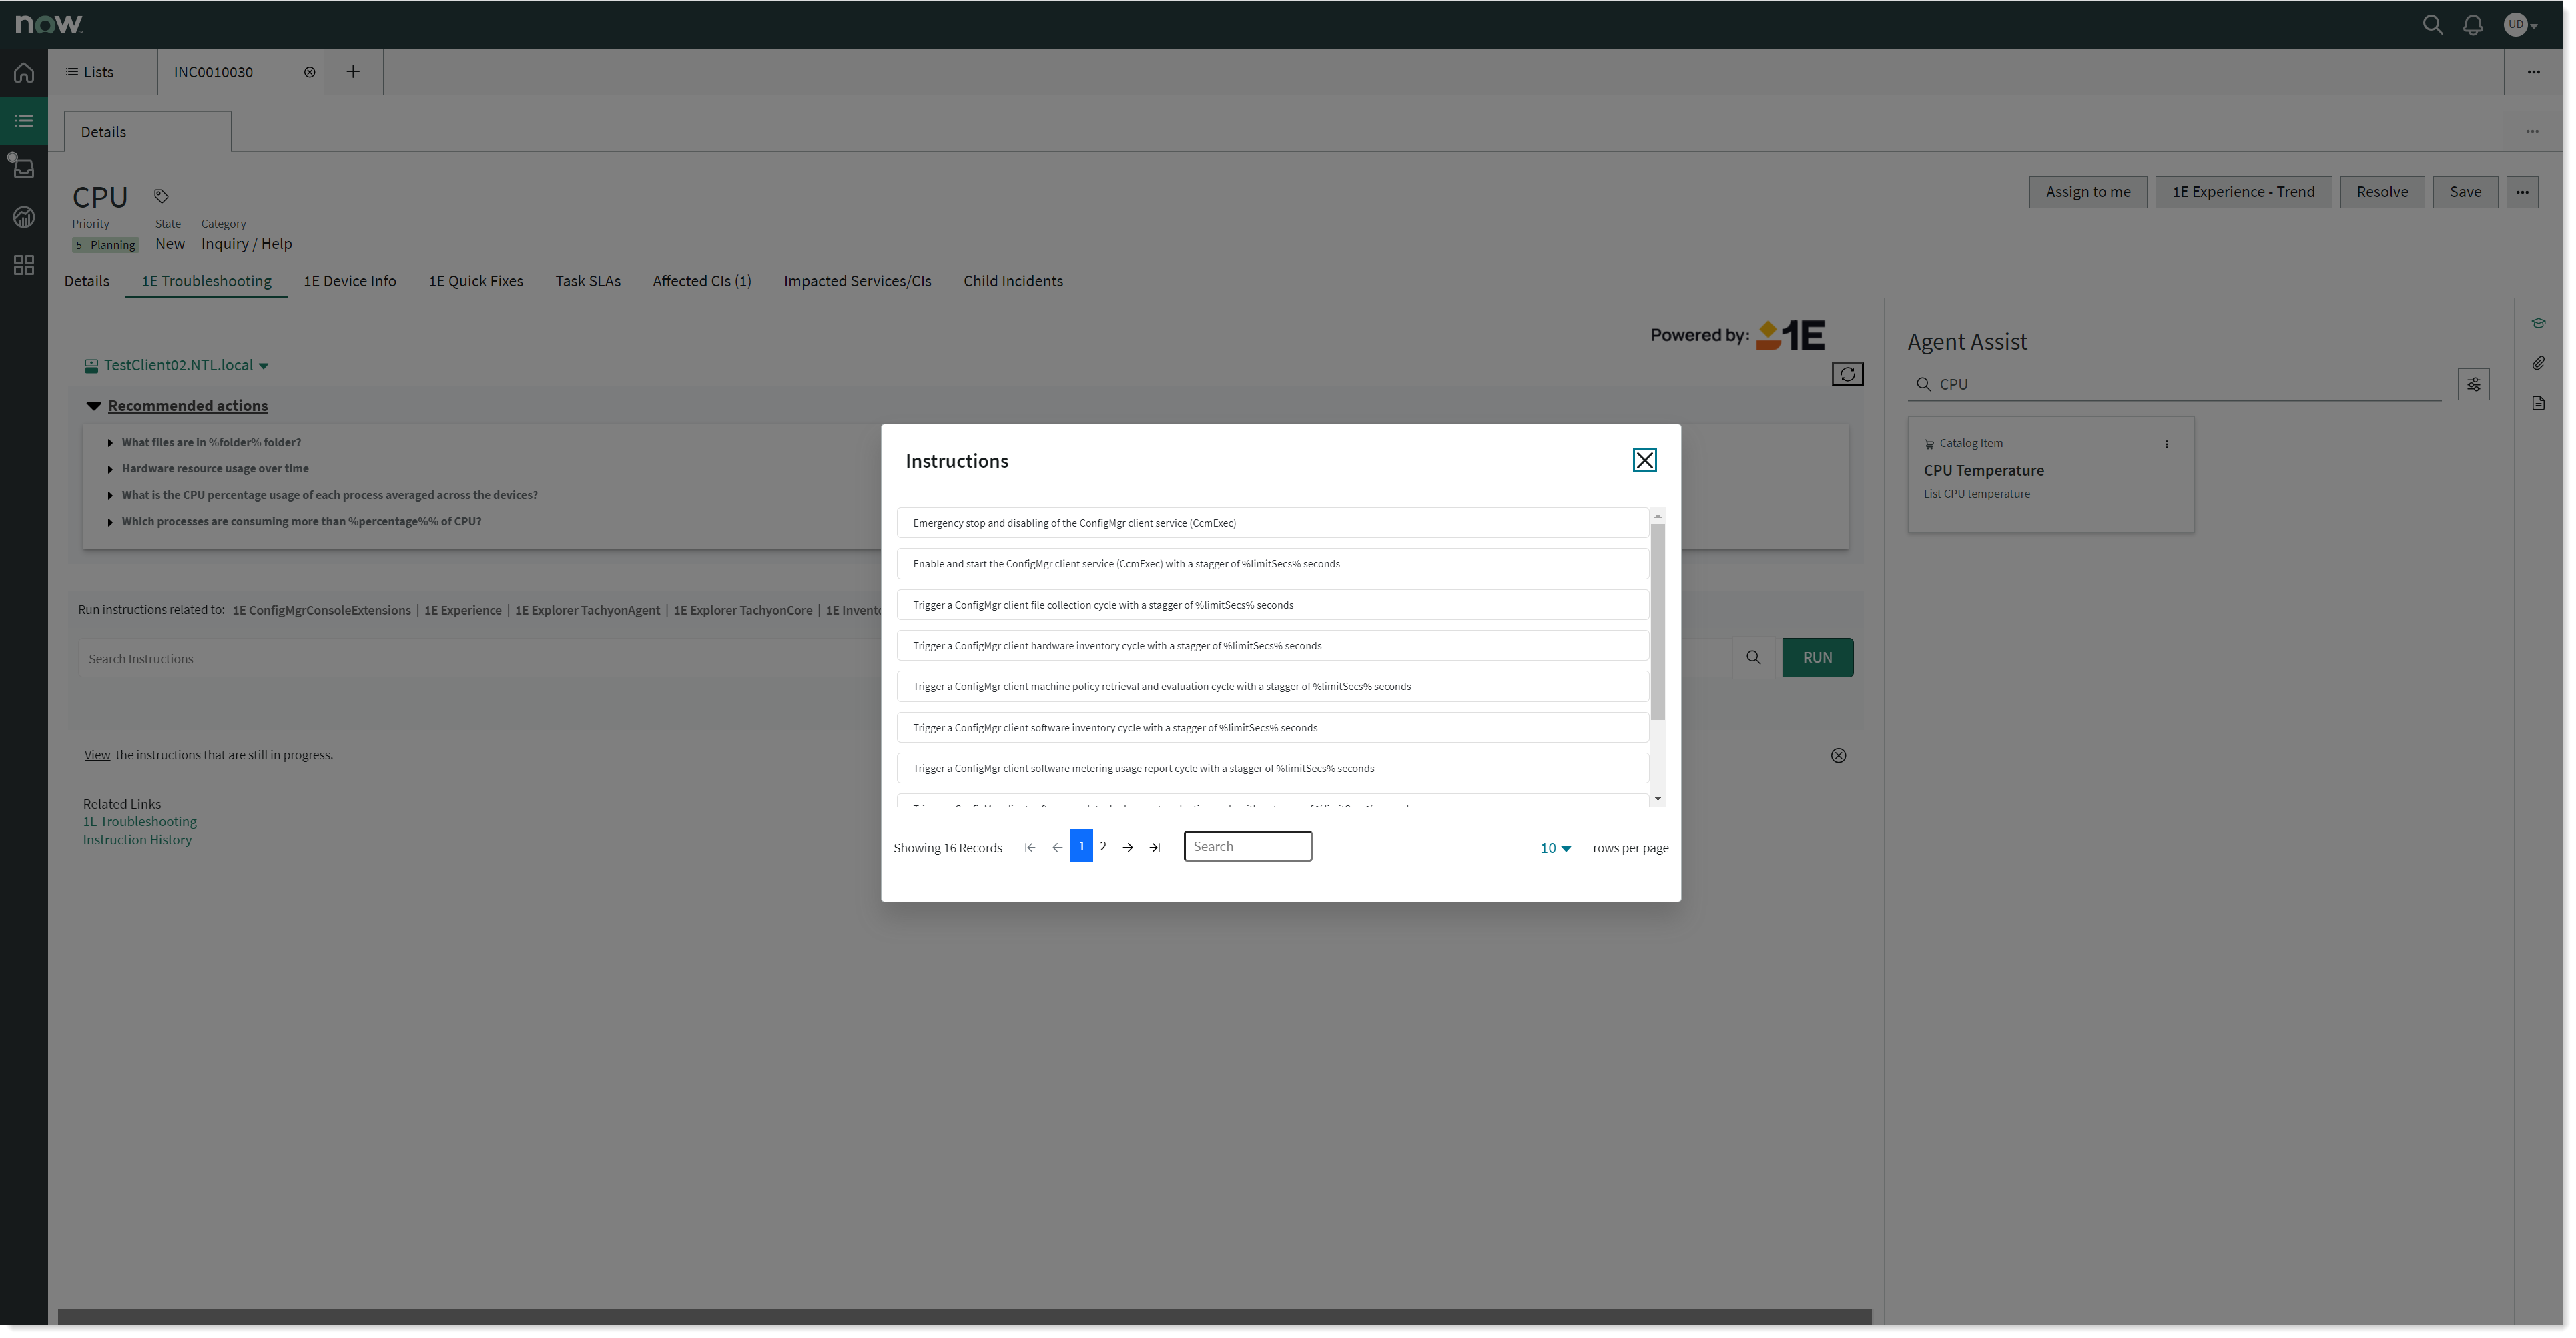
Any instruction you want to run can be selected in one of two ways, either by clicking an Instruction set link (located immediately above the Instructions field) and selecting the instruction from the popup window, or by using a type-ahead search in the Instructions field box. You can also select an instruction from the available list of instructions by clicking on the lens icon given next to type ahead search.
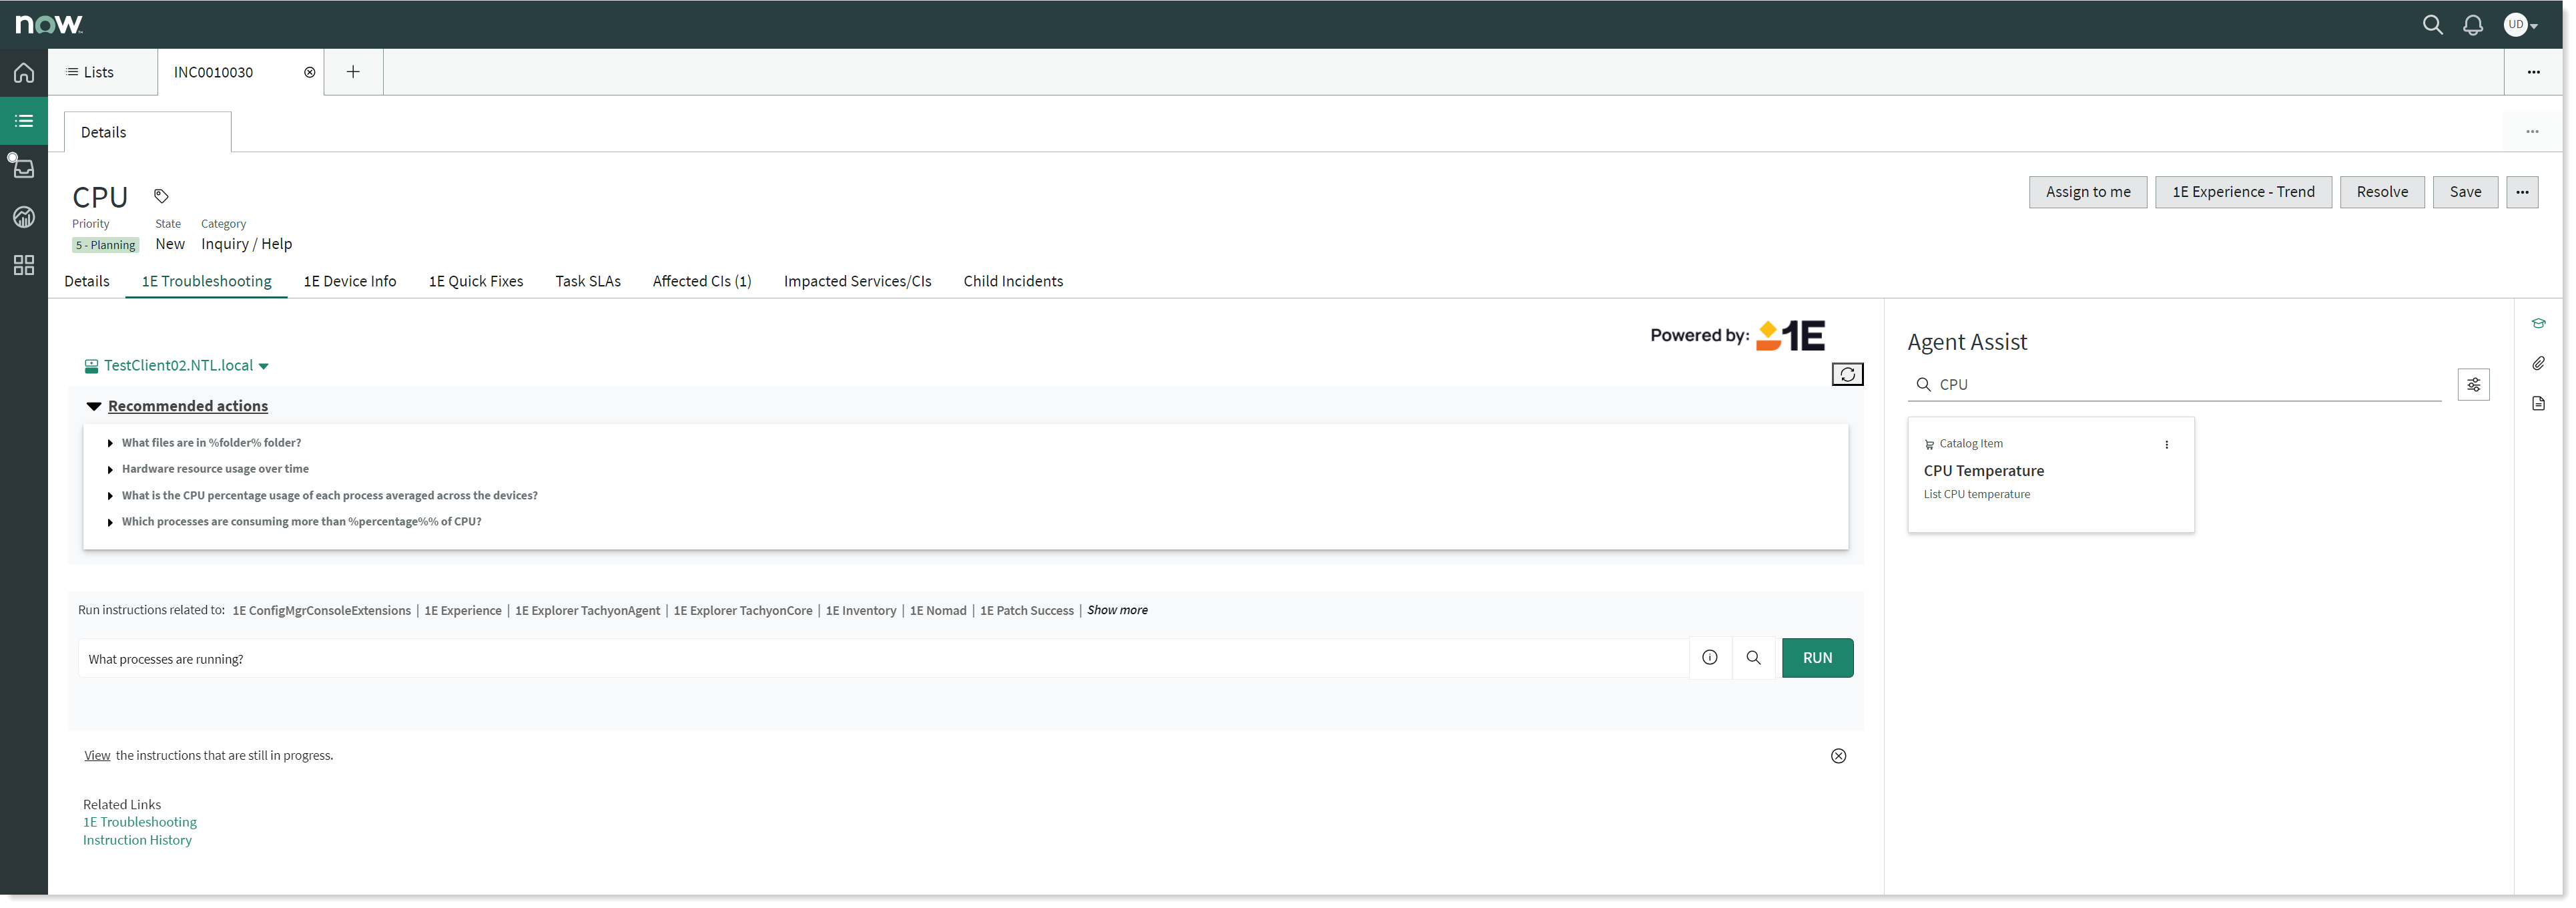
Type-ahead search is handy if you remember any word or portion of the instruction title. For example, you can search for instructions that contain the text process, as shown in the picture.
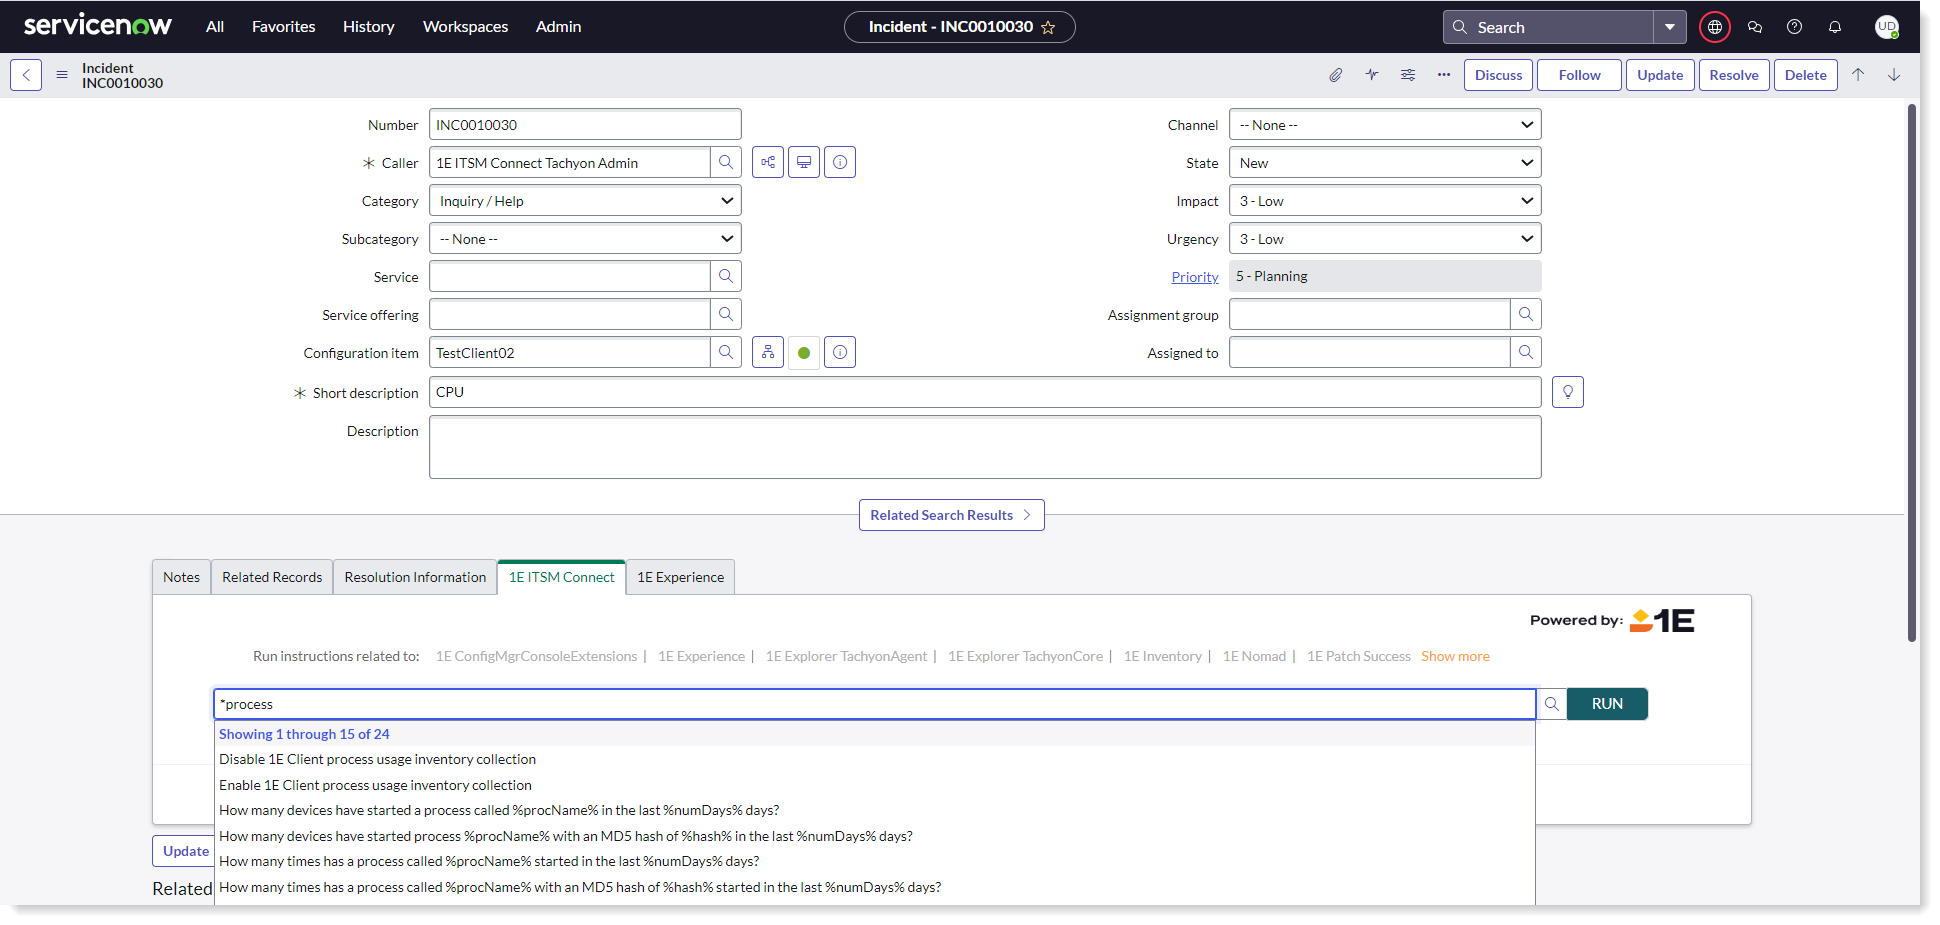
When you start to type the text, a popup will appear showing any matches for the text you've typed. In our example, three questions are shown to match the process text. Select the instruction you want to use from the matching list.
Running instructions
There are two types of instructions: questions and actions. Typically, questions don't require approval and actions do require approval, which is the case for all the 1E Product Packs. You can download these 1E Product Packs from the 1E Exchange portal. If you are developing your own instructions in 1E, we recommend that you stick to the same convention. The general procedure for running questions and actions therefore is different:
Running a question
To execute the selected instruction, click on the RUN button.
The responses for a question can be seen almost instantly after you click the RUN button. Responses are displayed just below the RUN button, as shown in the picture below.
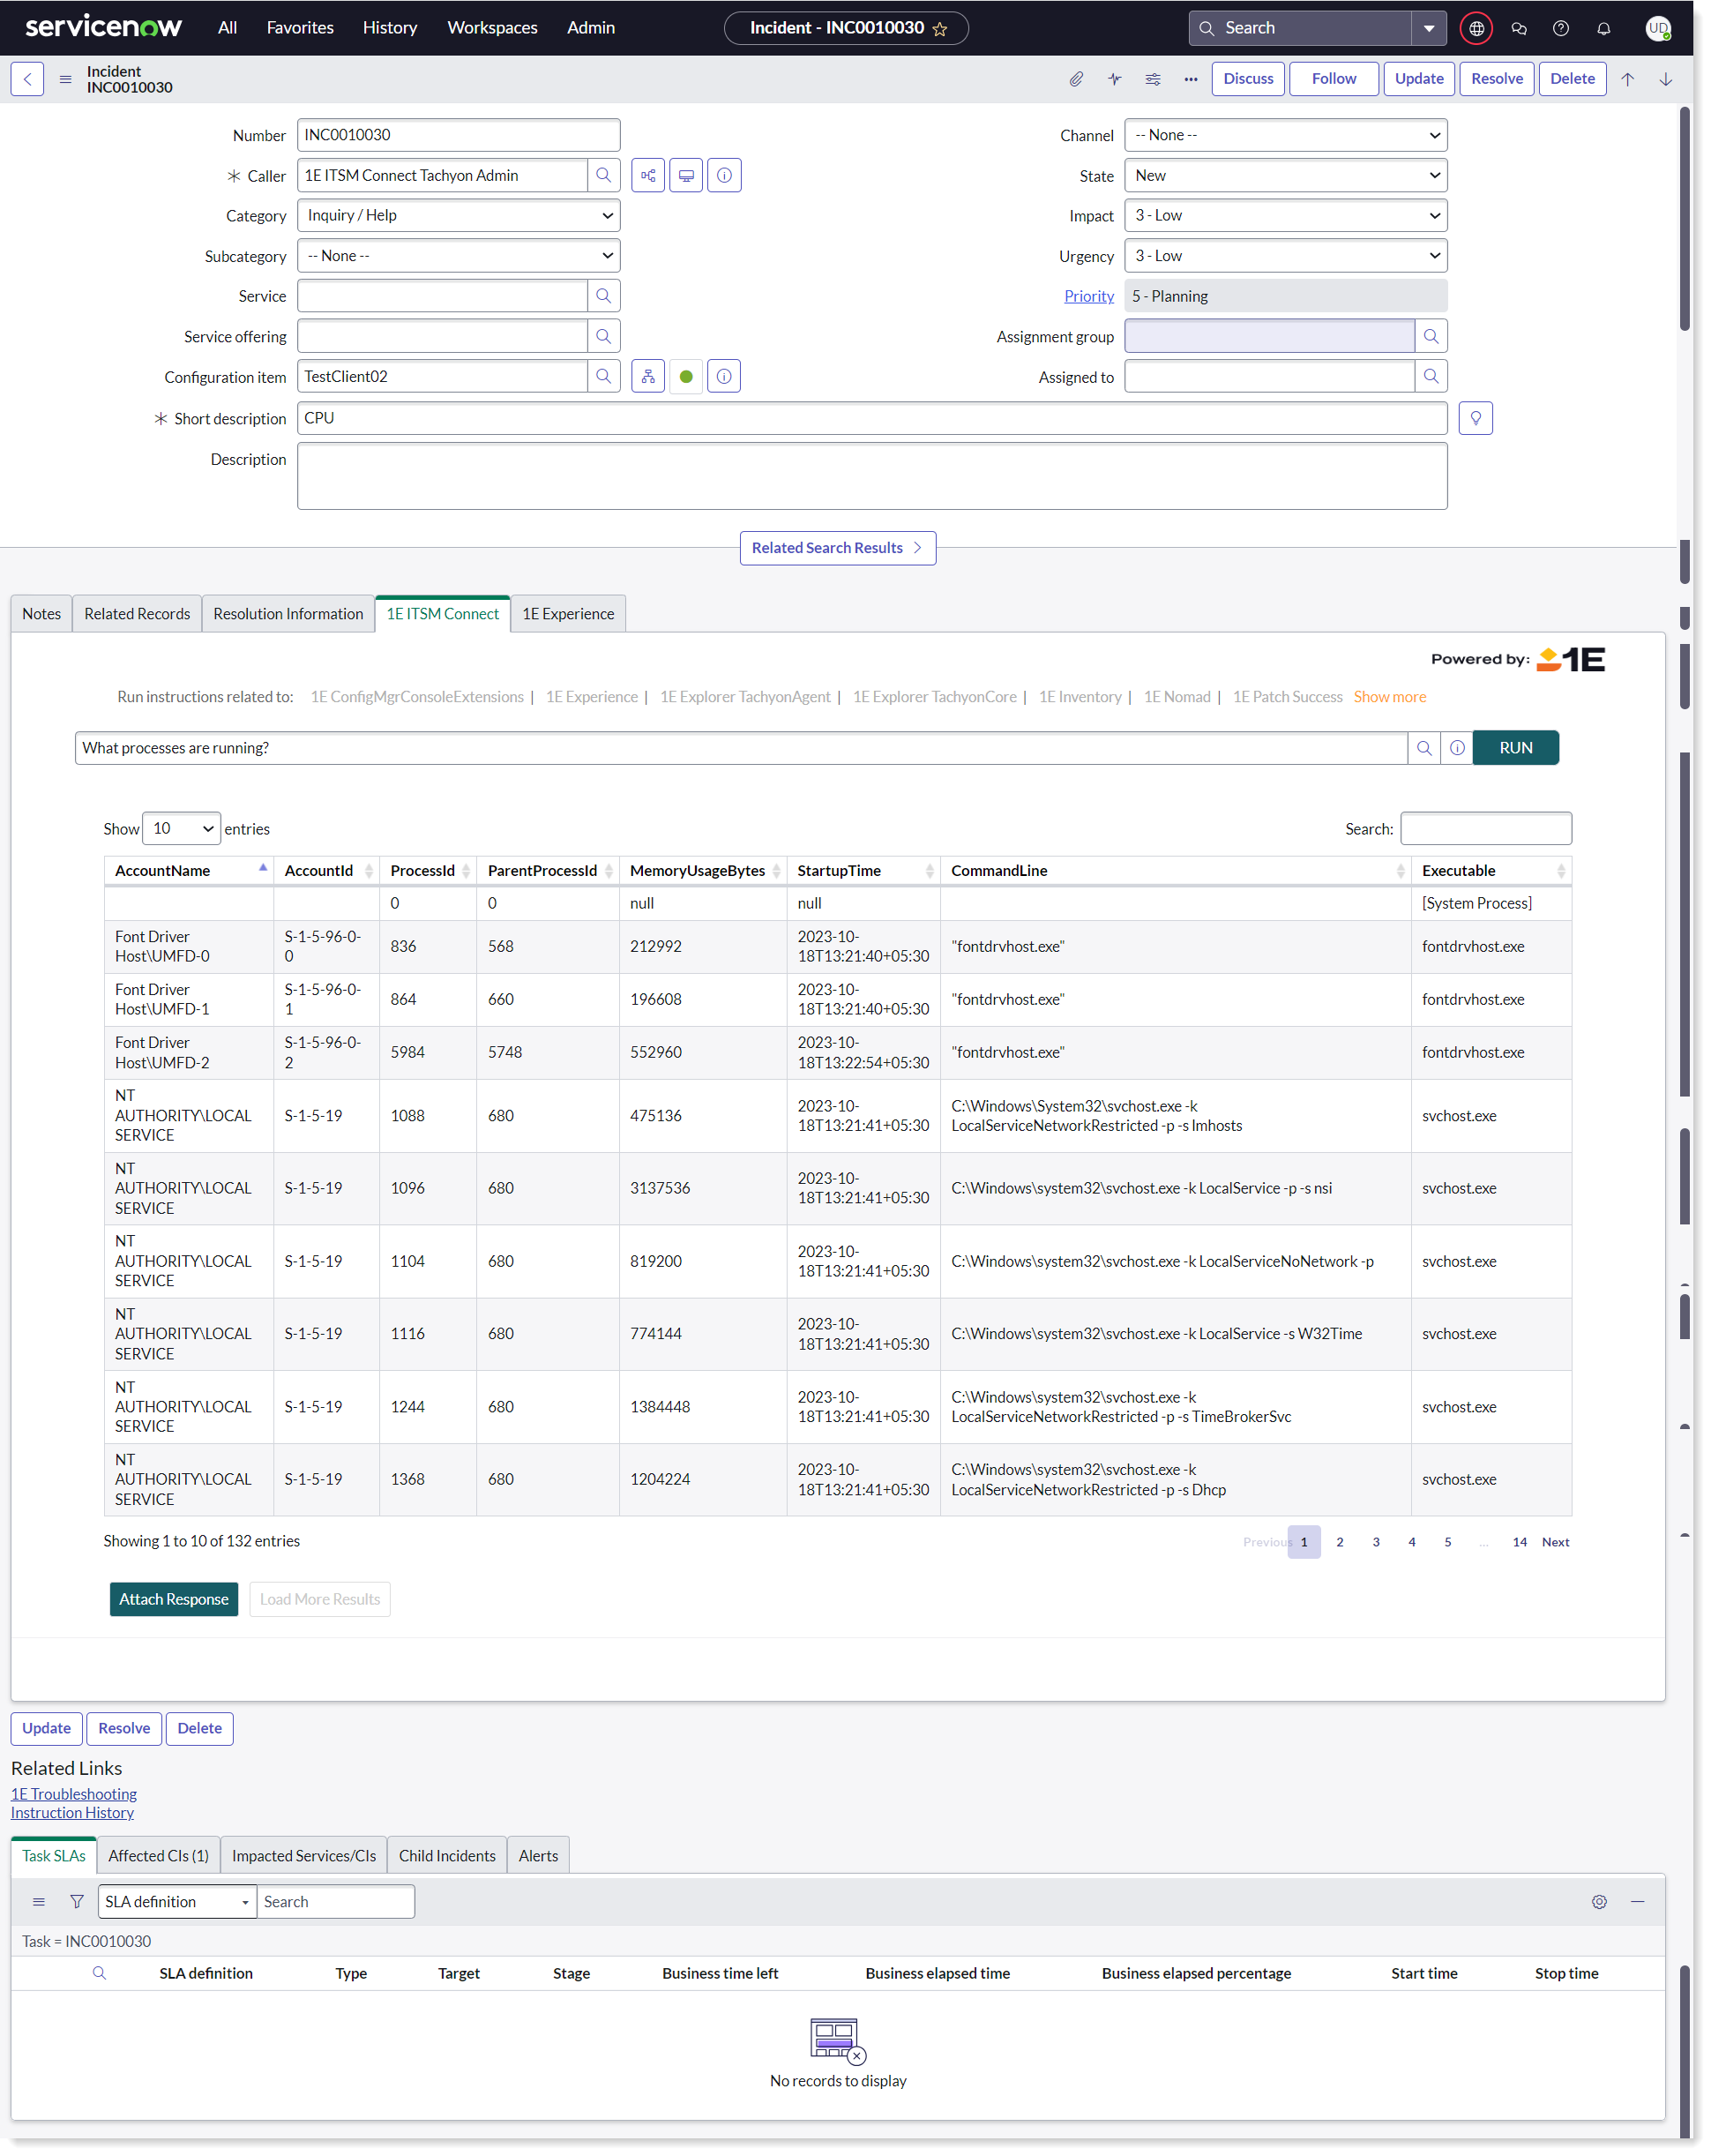
There are two buttons given at the bottom of the responses. These are Attach Response and Load More Results.
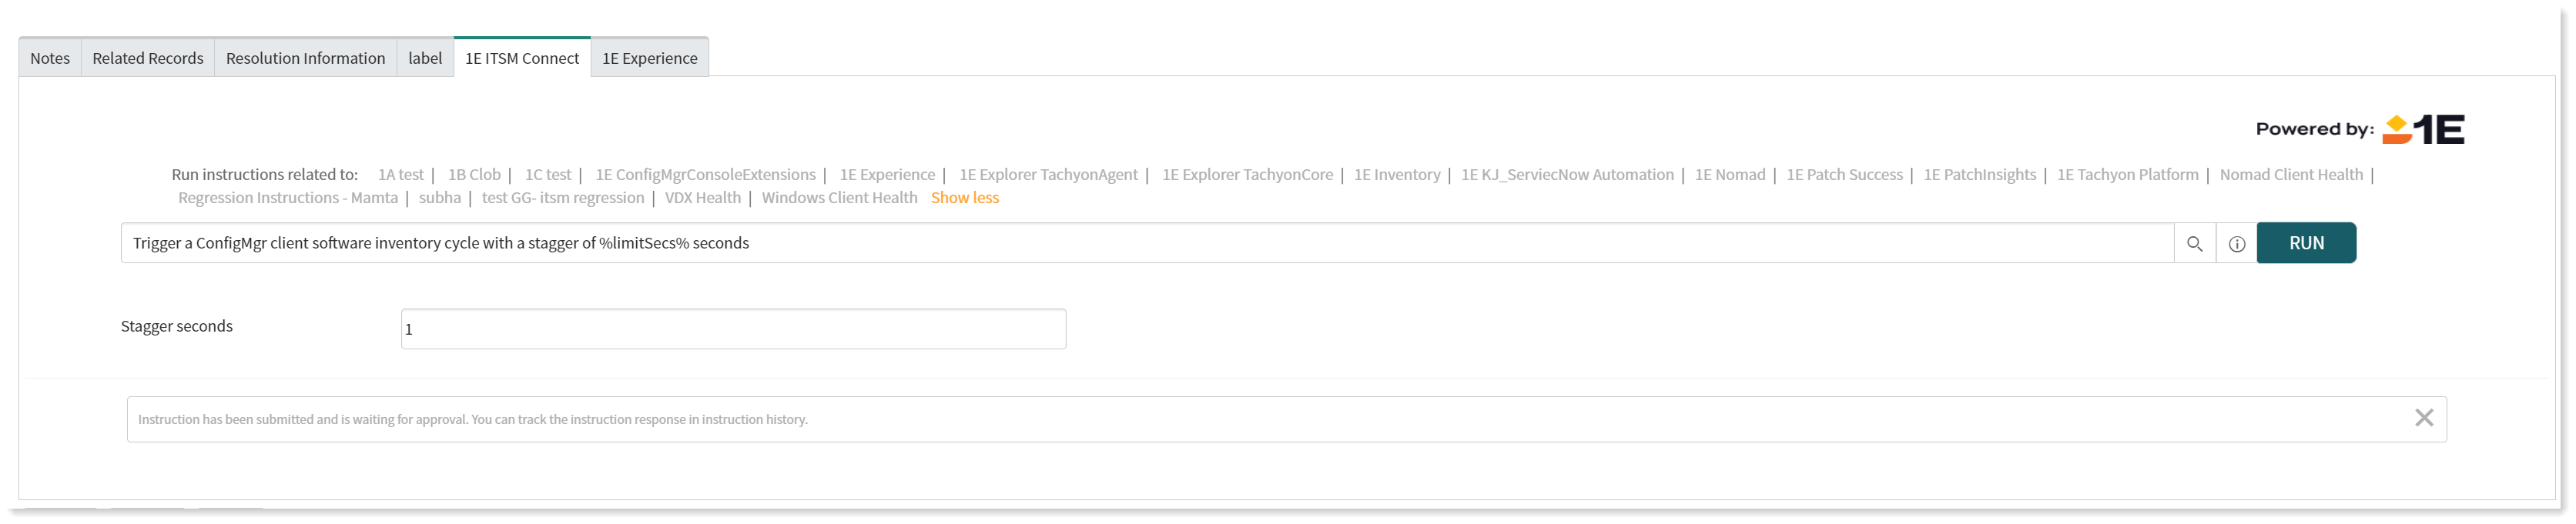
Running an action
Actions that require approval will not be run immediately on clicking the Run Instruction button. Instead, you will see a notification that the instruction has been put into the approval workflow, as shown in the picture, and it will only be run once an approver has approved.
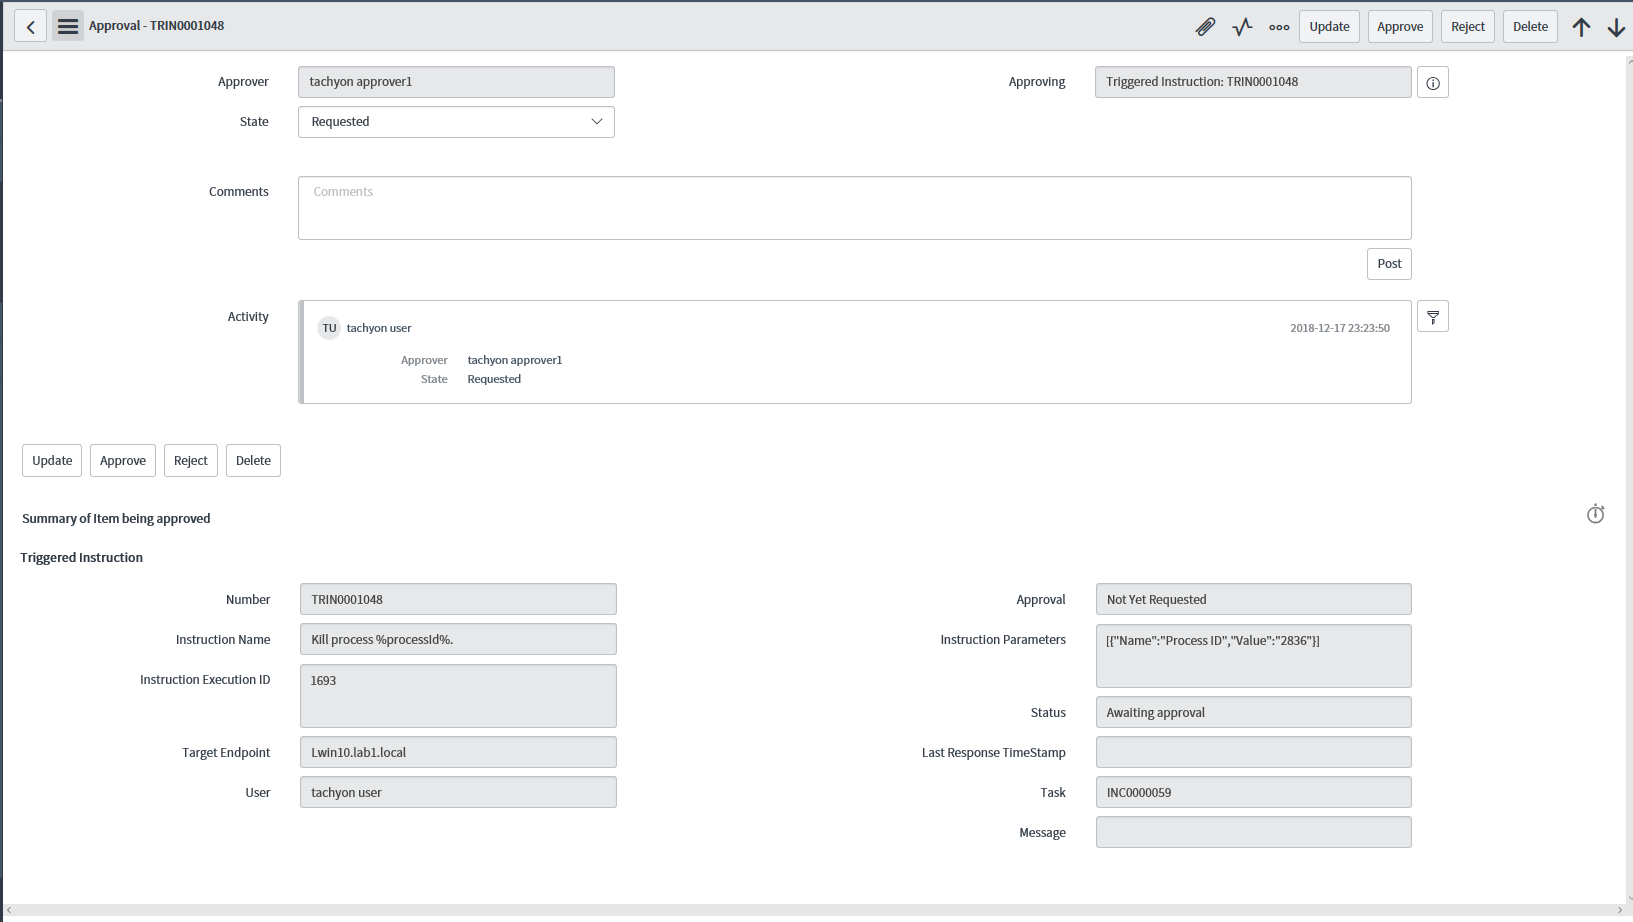
Approving an action
Any ServiceNow user having x_1e_connect.Tachyon_Approver role can approve instructions that are pending for approval. To do this, the approver needs to navigate to the 1E ITSM Connect→1E Approvals page. This page displays a list of all the approval requests along with their current status.
To process an approval request, the approver clicks on the requested link given in the State column to display the Approval page for that instruction, as shown in the picture. Here there are a number of options that let the approver Update, Approve, Reject or Delete the approval request.
Note
The configuration Item (CI) owner also has the authority to approve an approval record which can affect any CI they own even if they don't have the x_1e_connect.Tachyon_Approver role.
Viewing responses
Once an action has been approved, it gets run by 1E. A user with the x_1e_connect.Tachyon_Admin or x_1e_connect.Tachyon_User roles can view the instruction responses using the following steps:
Navigate to the Incidents page.
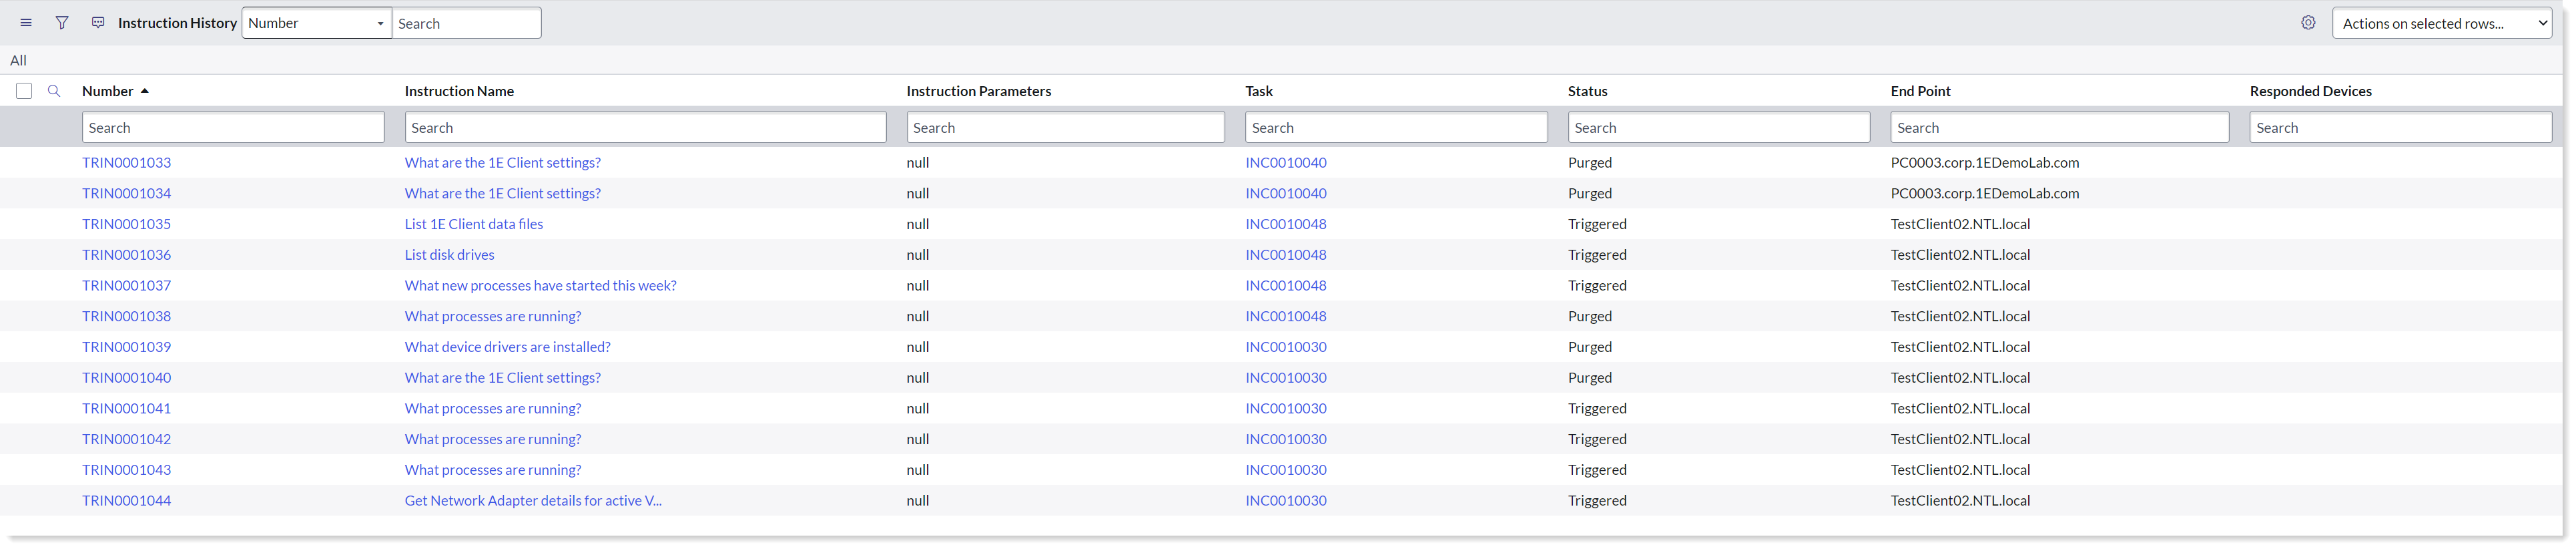
Click the Instruction History link under Related Links to open the history of all the instructions associated with the incident.
Doing this opens the Instruction History page for the incident in a new tab of the browser. The picture shows the Instruction History page for the INC0010030 incident.
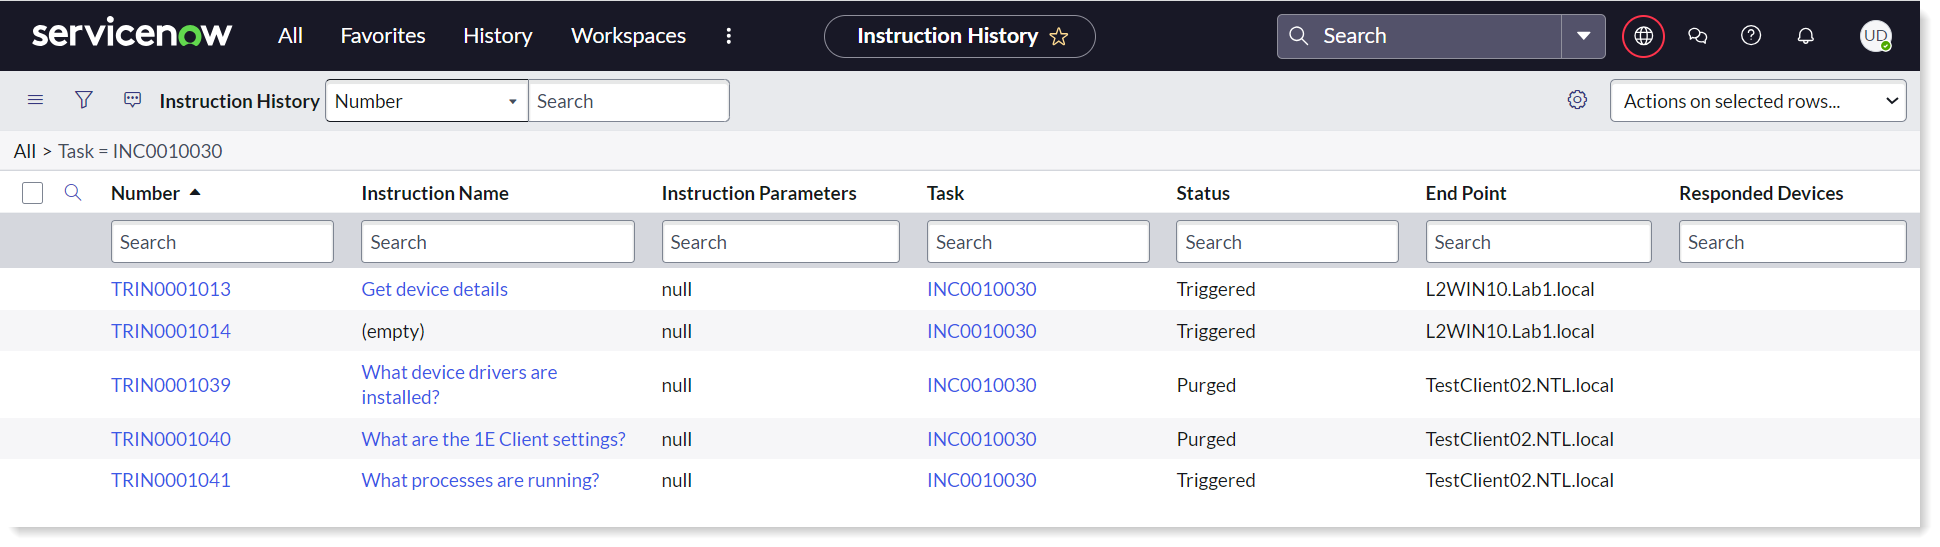
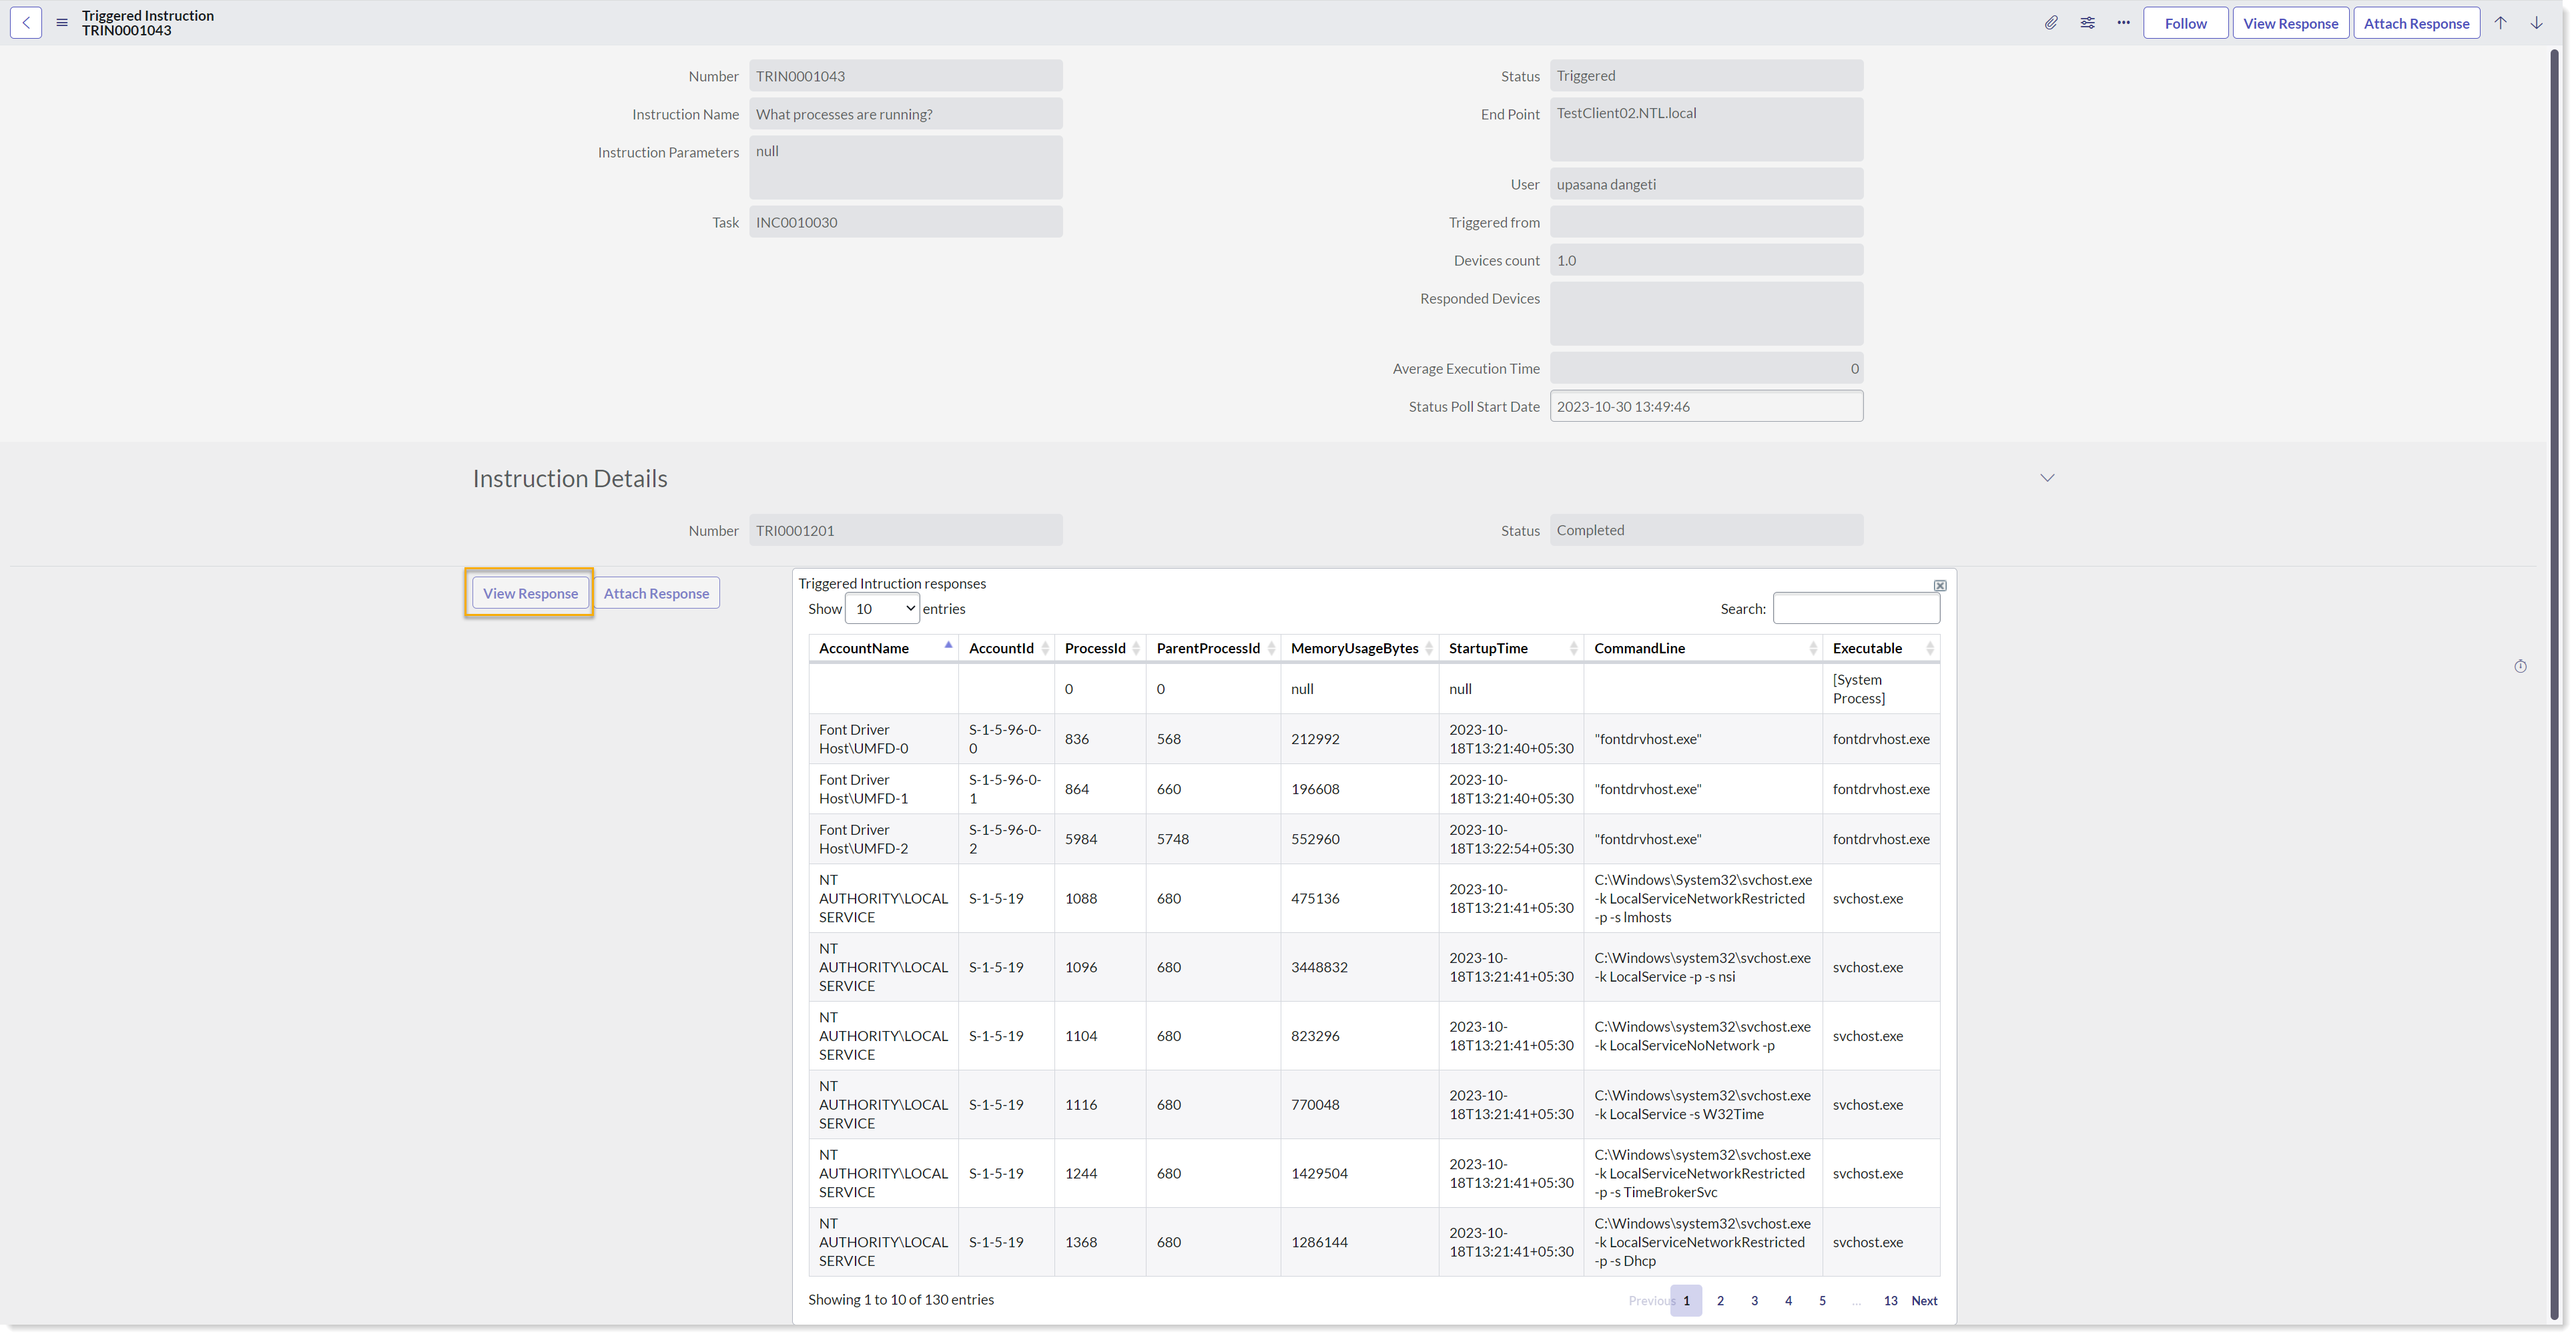
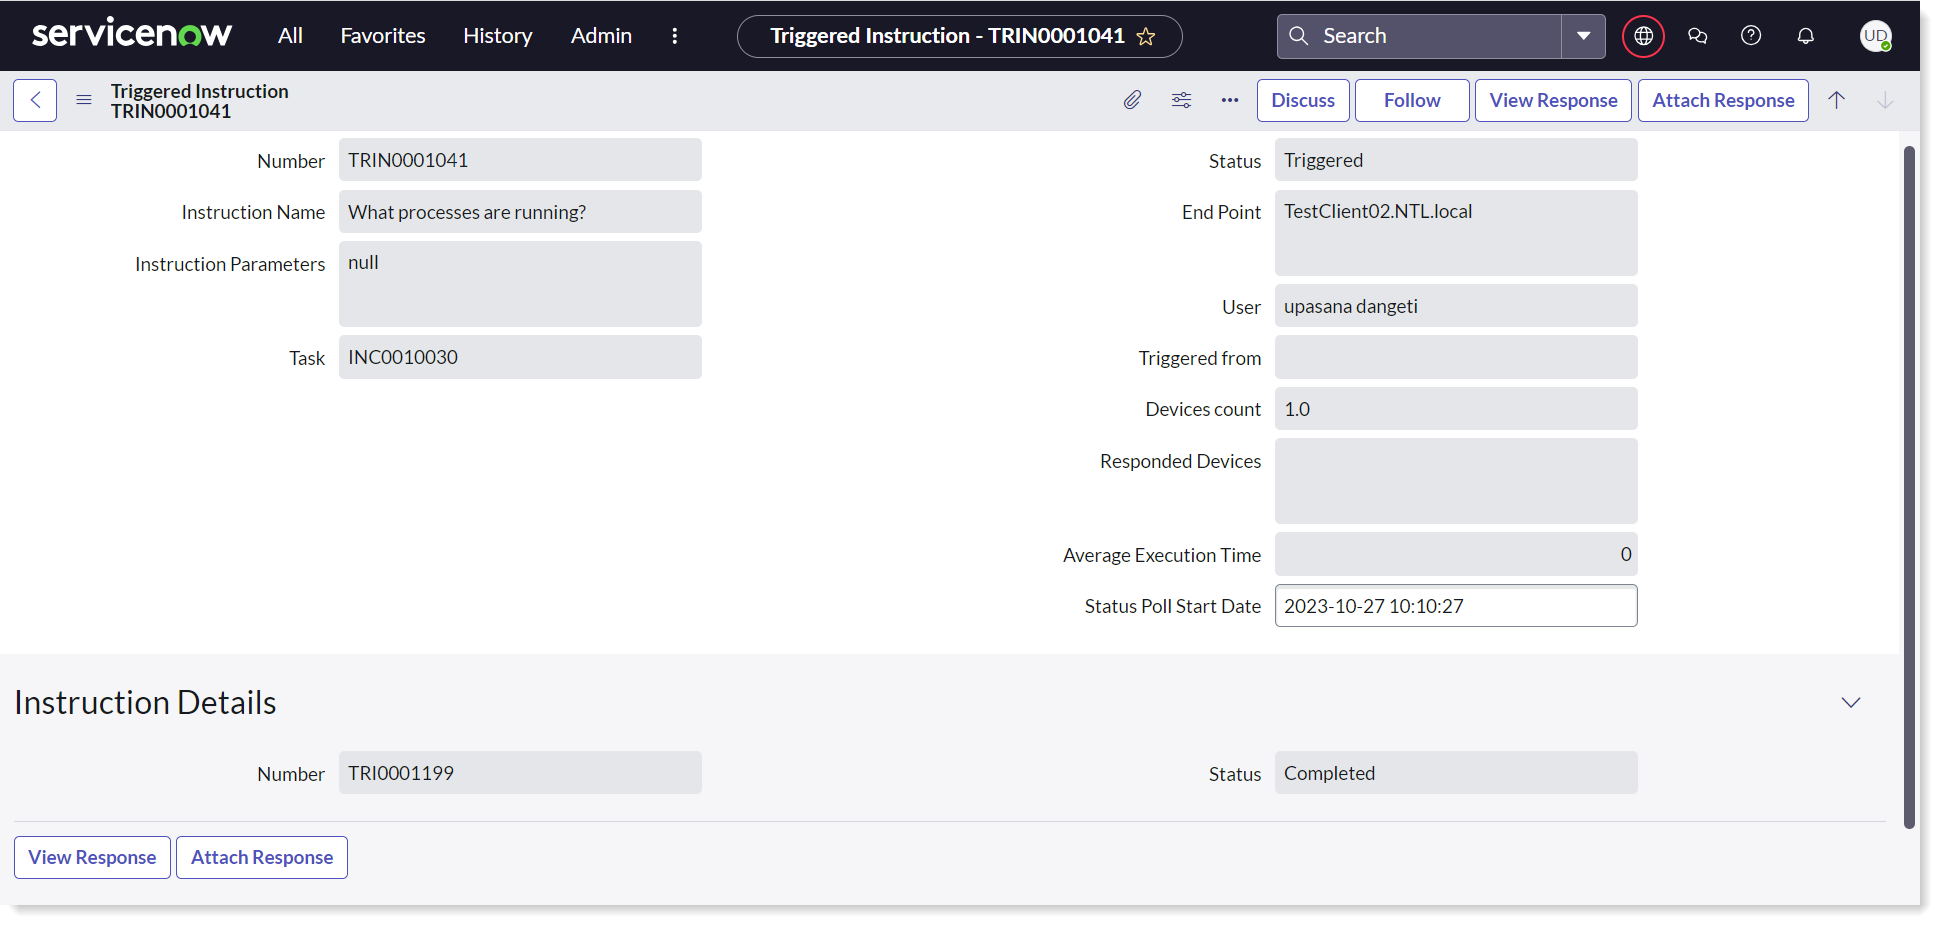
Click on the instruction id link in the Number column for the instruction record to open the details of the executed instruction, and then click View Response button to check the responses. The picture shows the details for the instruction TRIN0001041.
Associating instruction responses with an incident
The responses to 1E instructions run by a user are saved in ServiceNow so that they can be viewed at a later date by going into the instruction history associated with an incident. However, 1E responses are not kept in ServiceNow permanently. They are purged after a configured duration of time. To avoid losing instruction responses data this way, you can choose to associate the responses with the incident permanently using the Attach Response button that is displayed on the incident form after the 1E responses are displayed on the screen, as can be seen in the picture shown opposite.
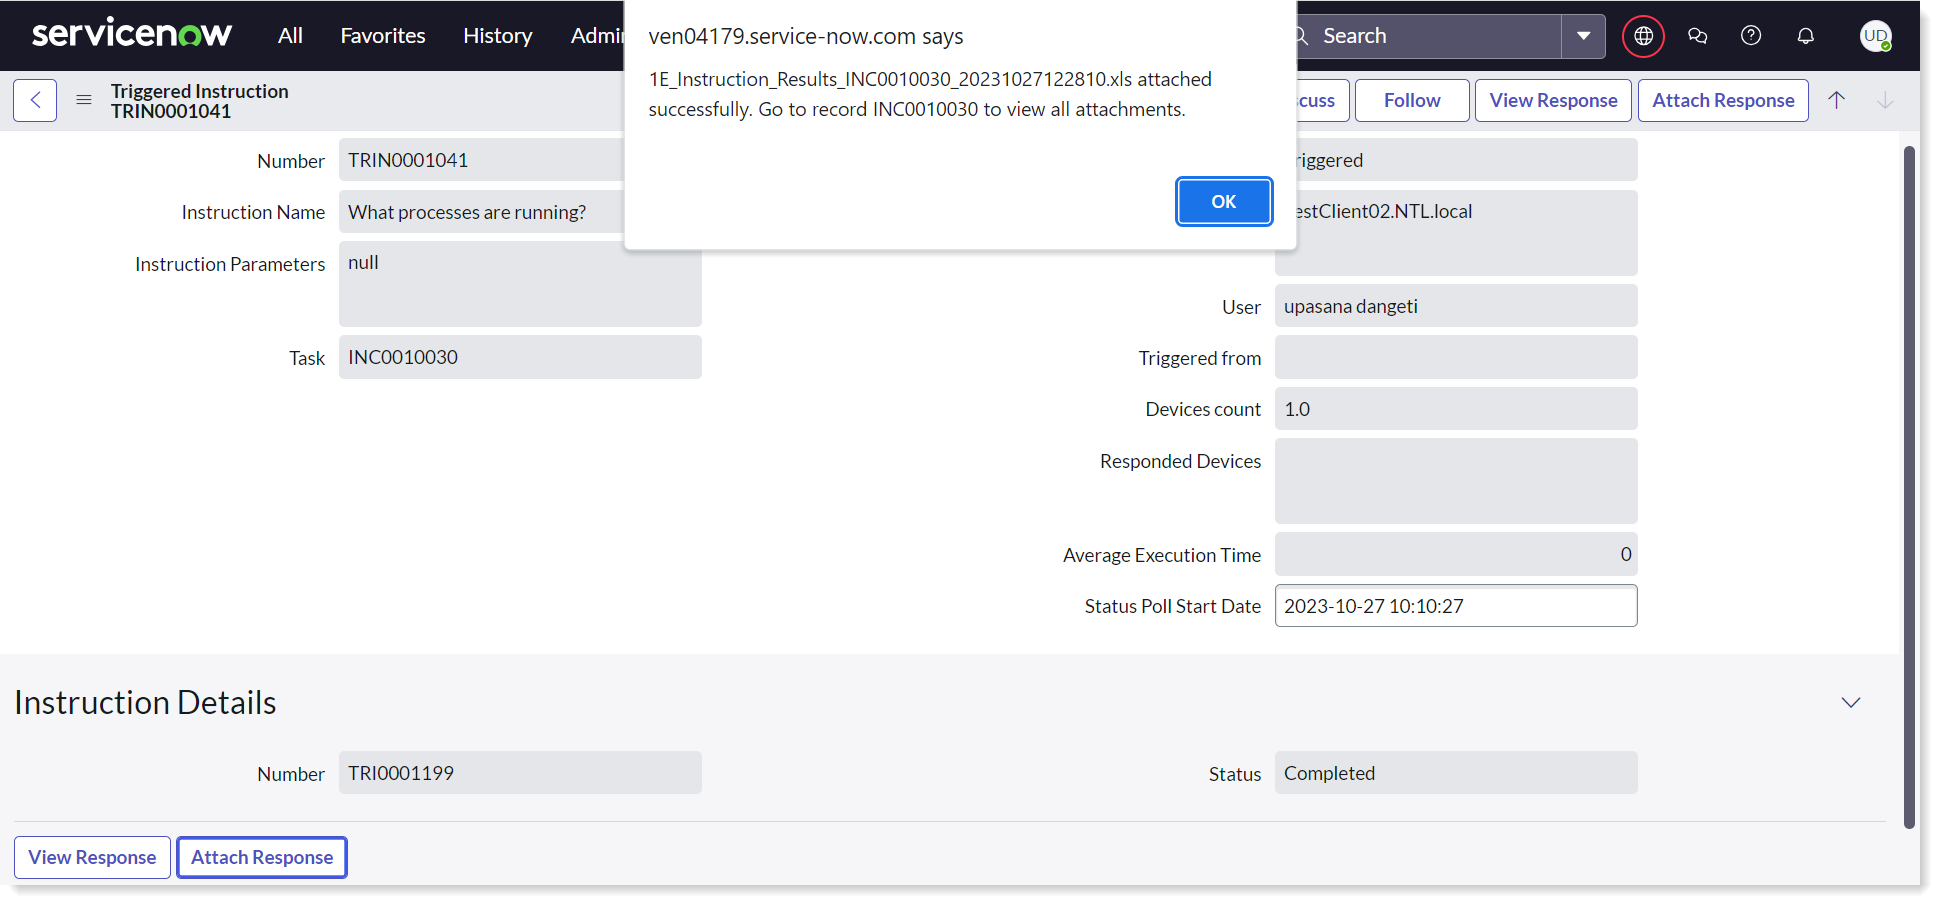
Clicking the Attach Response button exports the entire response data for the 1E instruction to an excel spreadsheet and then attaches it to the current incident as a file attachment. The attached spreadsheet contains details of the instruction that was run, its parameters and response details.
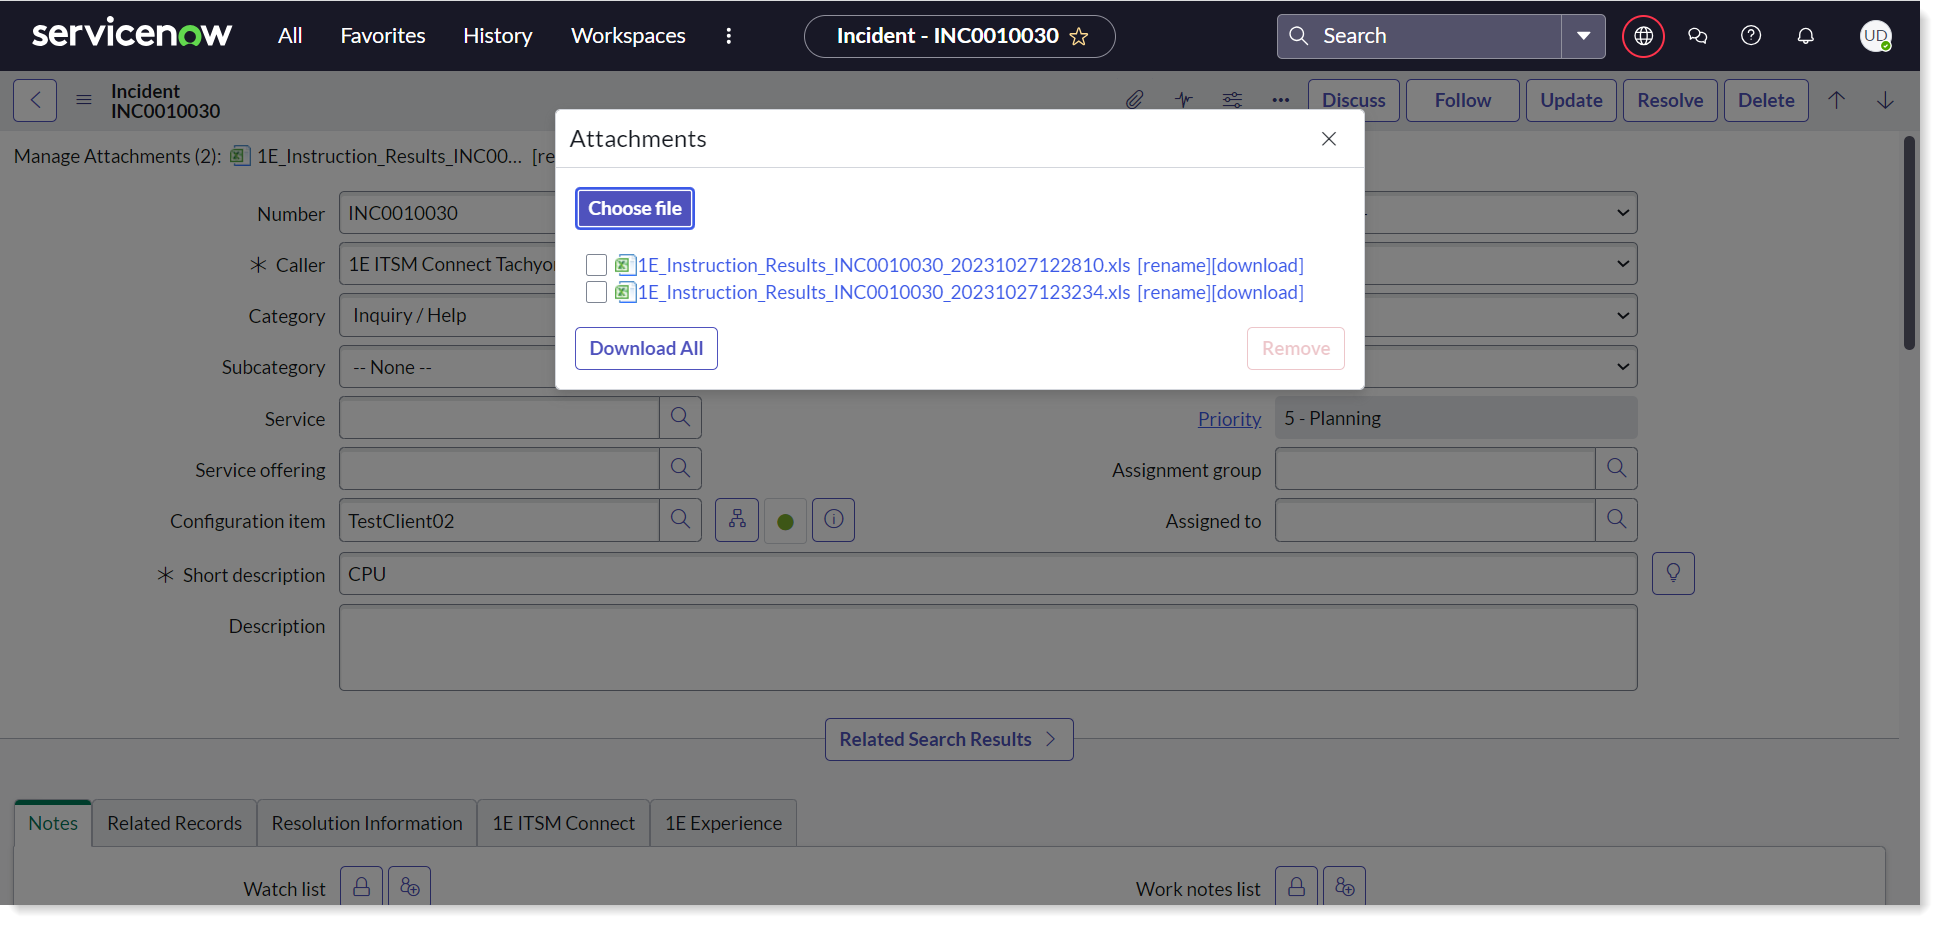
All the responses attached to the incident can then be viewed and downloaded for offline viewing from the Manage Attachments link on the incident toolbar.
Executing instructions in Workspaces
Investigating an incident using Agent Workspace
An 1E ITSM Connect user with the role x_1e_connect.Tachyon_User can also investigate the incident and run 1E instructions using Agent workspace, as shown in the steps below.
Navigate to Workspace Experience → Agent Workspace Home in the application navigator. This opens up the Agent Workspace in a new window, and the landing Home page is open in the right-hand pane. The Home displays a dashboard summarizing the incidents and your work.
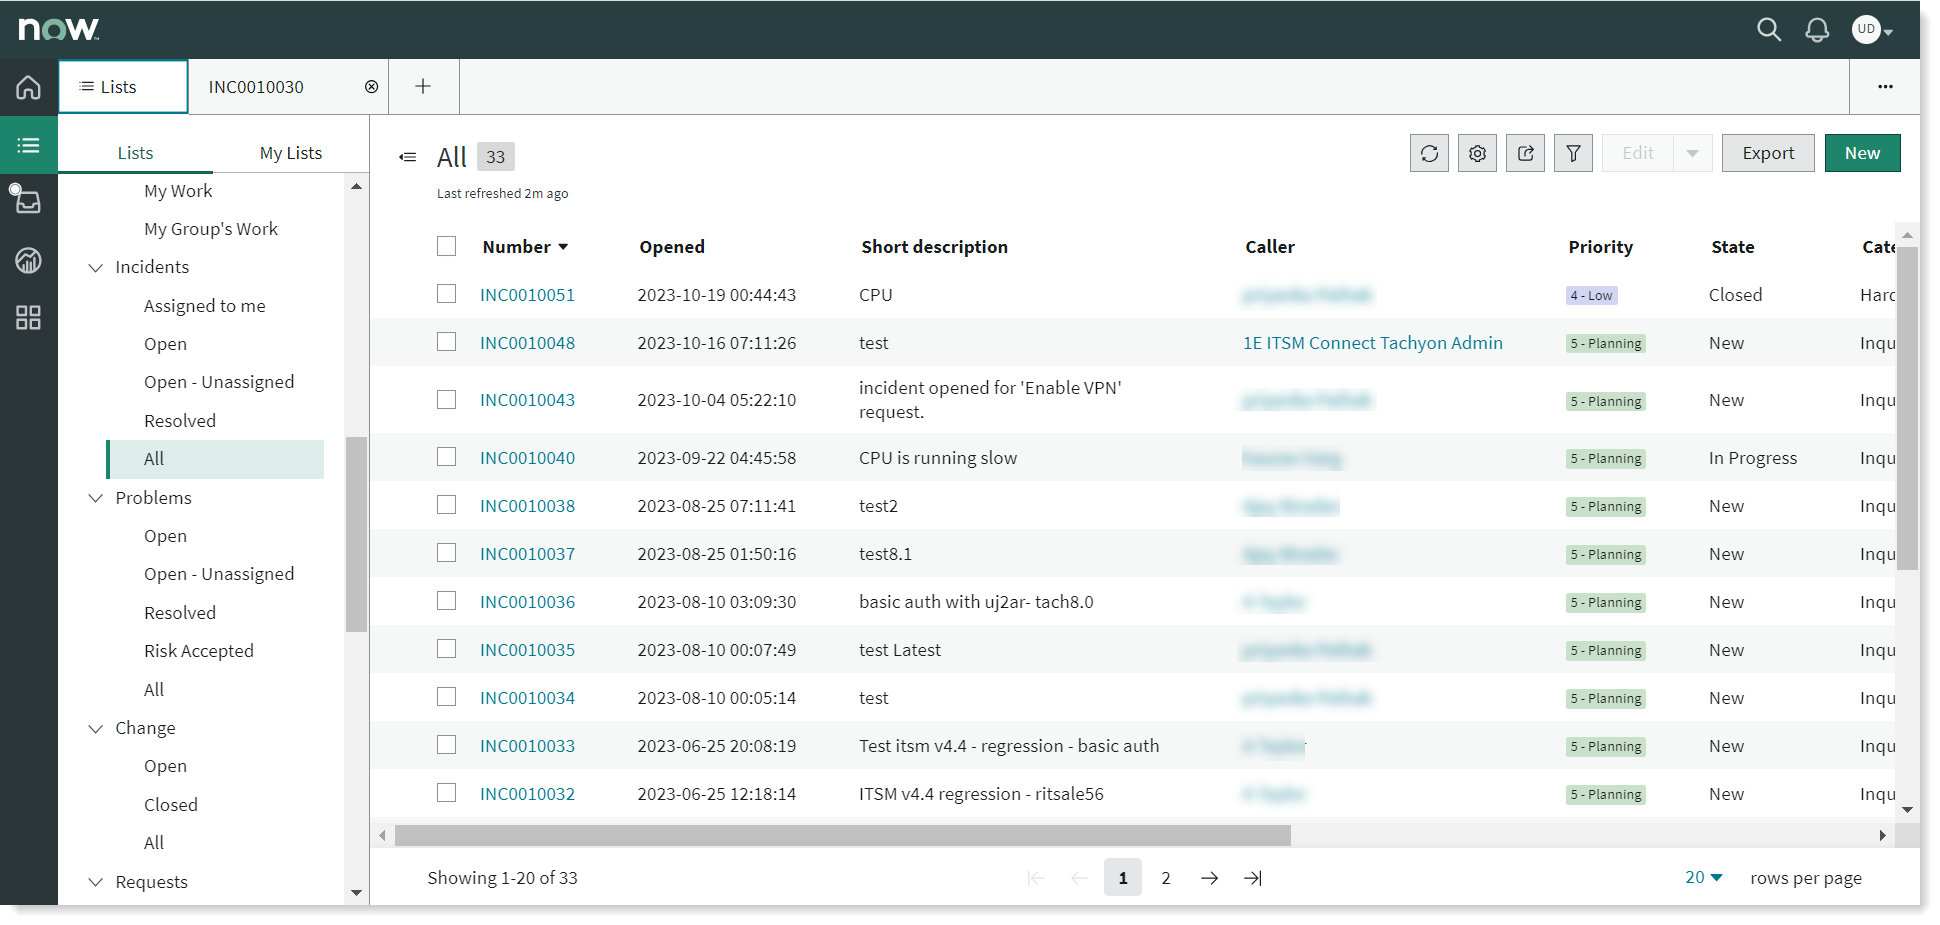
Now click on the hamburger icon given on the left-hand panel to open Lists. A menu of items is displayed on the left hand panel under the Lists. Go to Incidents → All in the given menu. This displays a list of all the incidents and their details, as shown in the picture below.
Select the incident from the list which you want to work on and click on the incident. The details of the selected incidents are now displayed in a new tab, as shown in the picture below. Along with incident Details tab it also displays other tabs including 1E Troubleshooting, 1E Device info and 1E Quick Fixes. Notice that this incident has impacted 1 item as shown in the Affected CIs list.
Click on 1E Troubleshooting tab to execute the 1E instruction. The screen displays the following information:
A dropdown list of all the impacted devices as shown in the picture below. By default, all the devices are selected, select the device on which you want to run the 1E instruction. You can either select or deselect a device, by clicking on the device name in the given dropdown list.
There is also a refresh button given on 1E Troubleshooting page.
A list of Recommended Actions that you can select from.
A UI with instruction set names, a test box and a RUN button is displayed. When you start to type in the text box, it shows you all possible suggestions.
You can select instruction(s) from either these suggestions, Recommended Actions list, or instruction set pop-up window.
When you click on the instruction set name, it opens up a pop-up window with the list of instructions those are part of the selected instruction set.
There are two links given under the Related links:
1E Troubleshooting: When you click on this link, it will open 1E Troubleshooting in a separate window. It will show an alert message about the missing information, if 1E Explorer URL property is not configured in 1E Core → App Configuration properly.
Instruction History: When you click on this link, it will open Instruction History page in a new window, including the triggered instruction(s) details related to the current incident.
A message View instructions that are still in progress. This message is displayed when there is already an instruction running or in progress for the current incident.
Select an instruction and fill the required parameters if there are any. Click on the RUN button to execute the instruction on 1E.
The responses received from 1E are displayed in a table as shown below.
You can attach these responses using the Attach Response tab given at the bottom to the selected incident, i.e. from where the instruction has been triggered. The Load More tab helps you to load more responses for the selected device. You can also do a search in the search box available.
In case there is an approval required to execute the triggered instruction, then it will follow the approval workflow. The instruction is submitted for review and upon receiving an approval only the instruction will be executed on 1E. User will be able to see the responses of this instruction on Instruction History page.
Investigating an incident using Service Operations Workspace
An 1E ITSM Connect user with the role x_1e_connect.Tachyon_User can also investigate the incident and run 1E instructions using Service Operations Workspace, as shown in the steps below.
Navigate to Workspace Experience → Service Operations Workspace in the application navigator. This opens up the Service Operations Workspace in a new window, and the landing Home page is open in the right-hand pane. The Home displays a dashboard summarizing the incidents and your work.
Now click on the hamburger icon given on the left-hand panel to open Lists. A menu of items is displayed on the left hand panel under the Lists. Go to Incidents → All in the given menu. This displays a list of all the incidents and their details, as shown in the picture below.
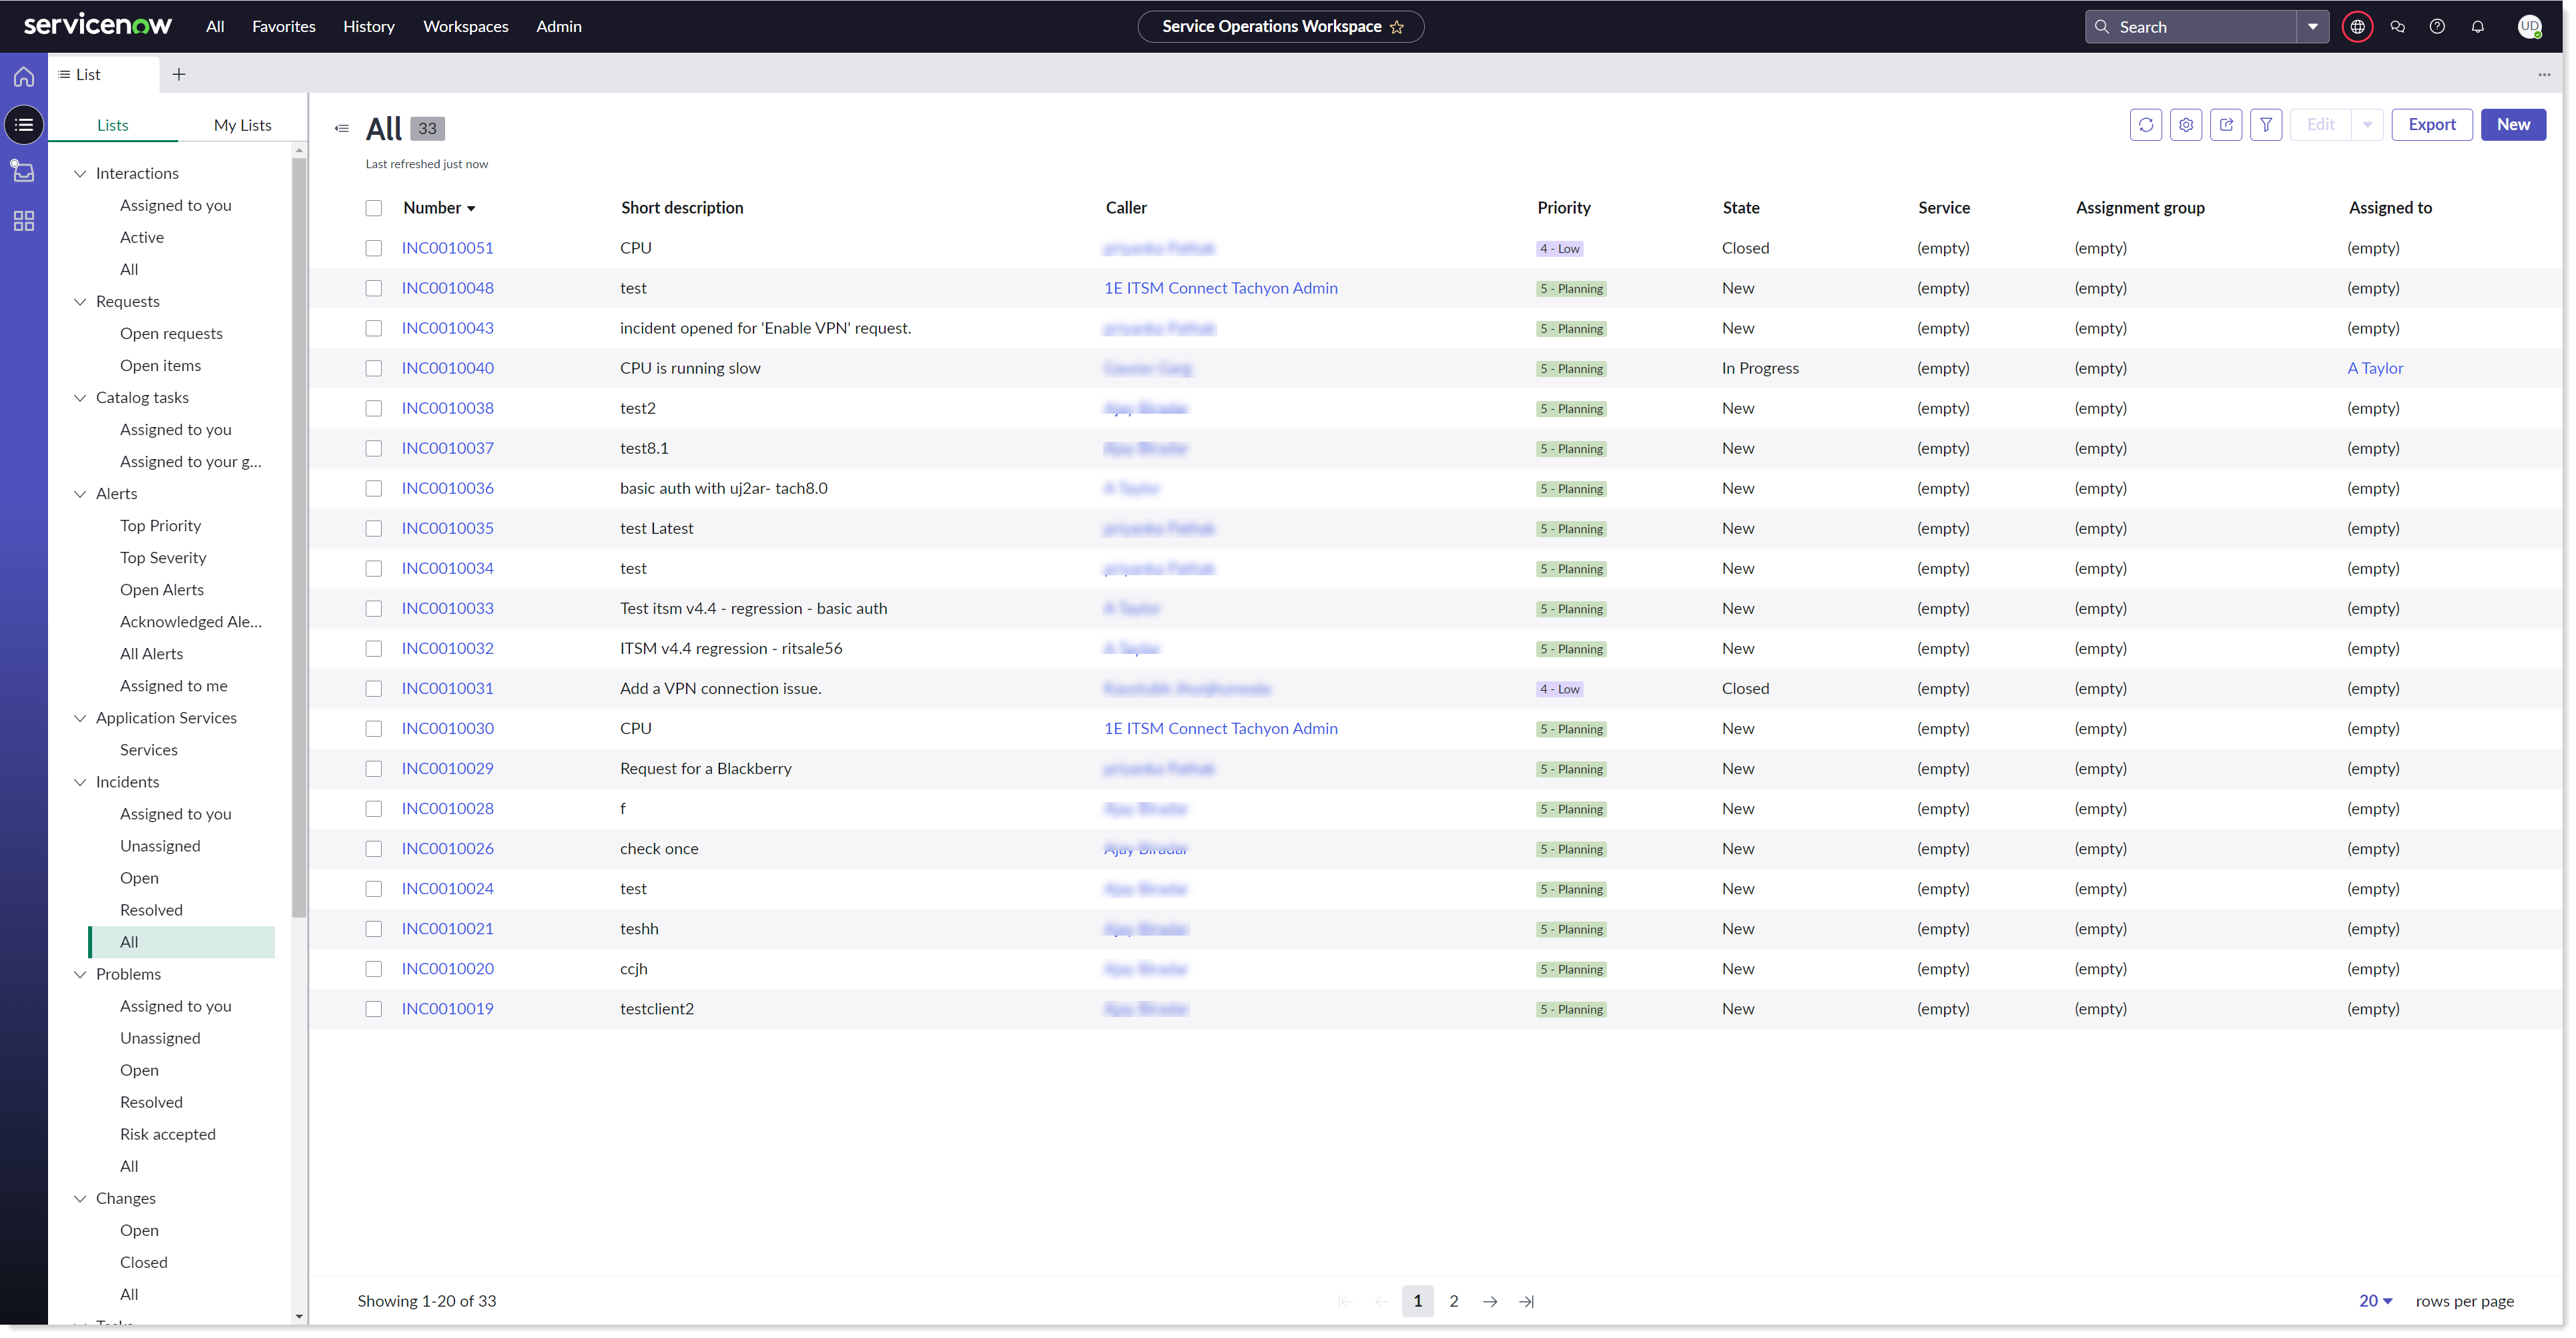
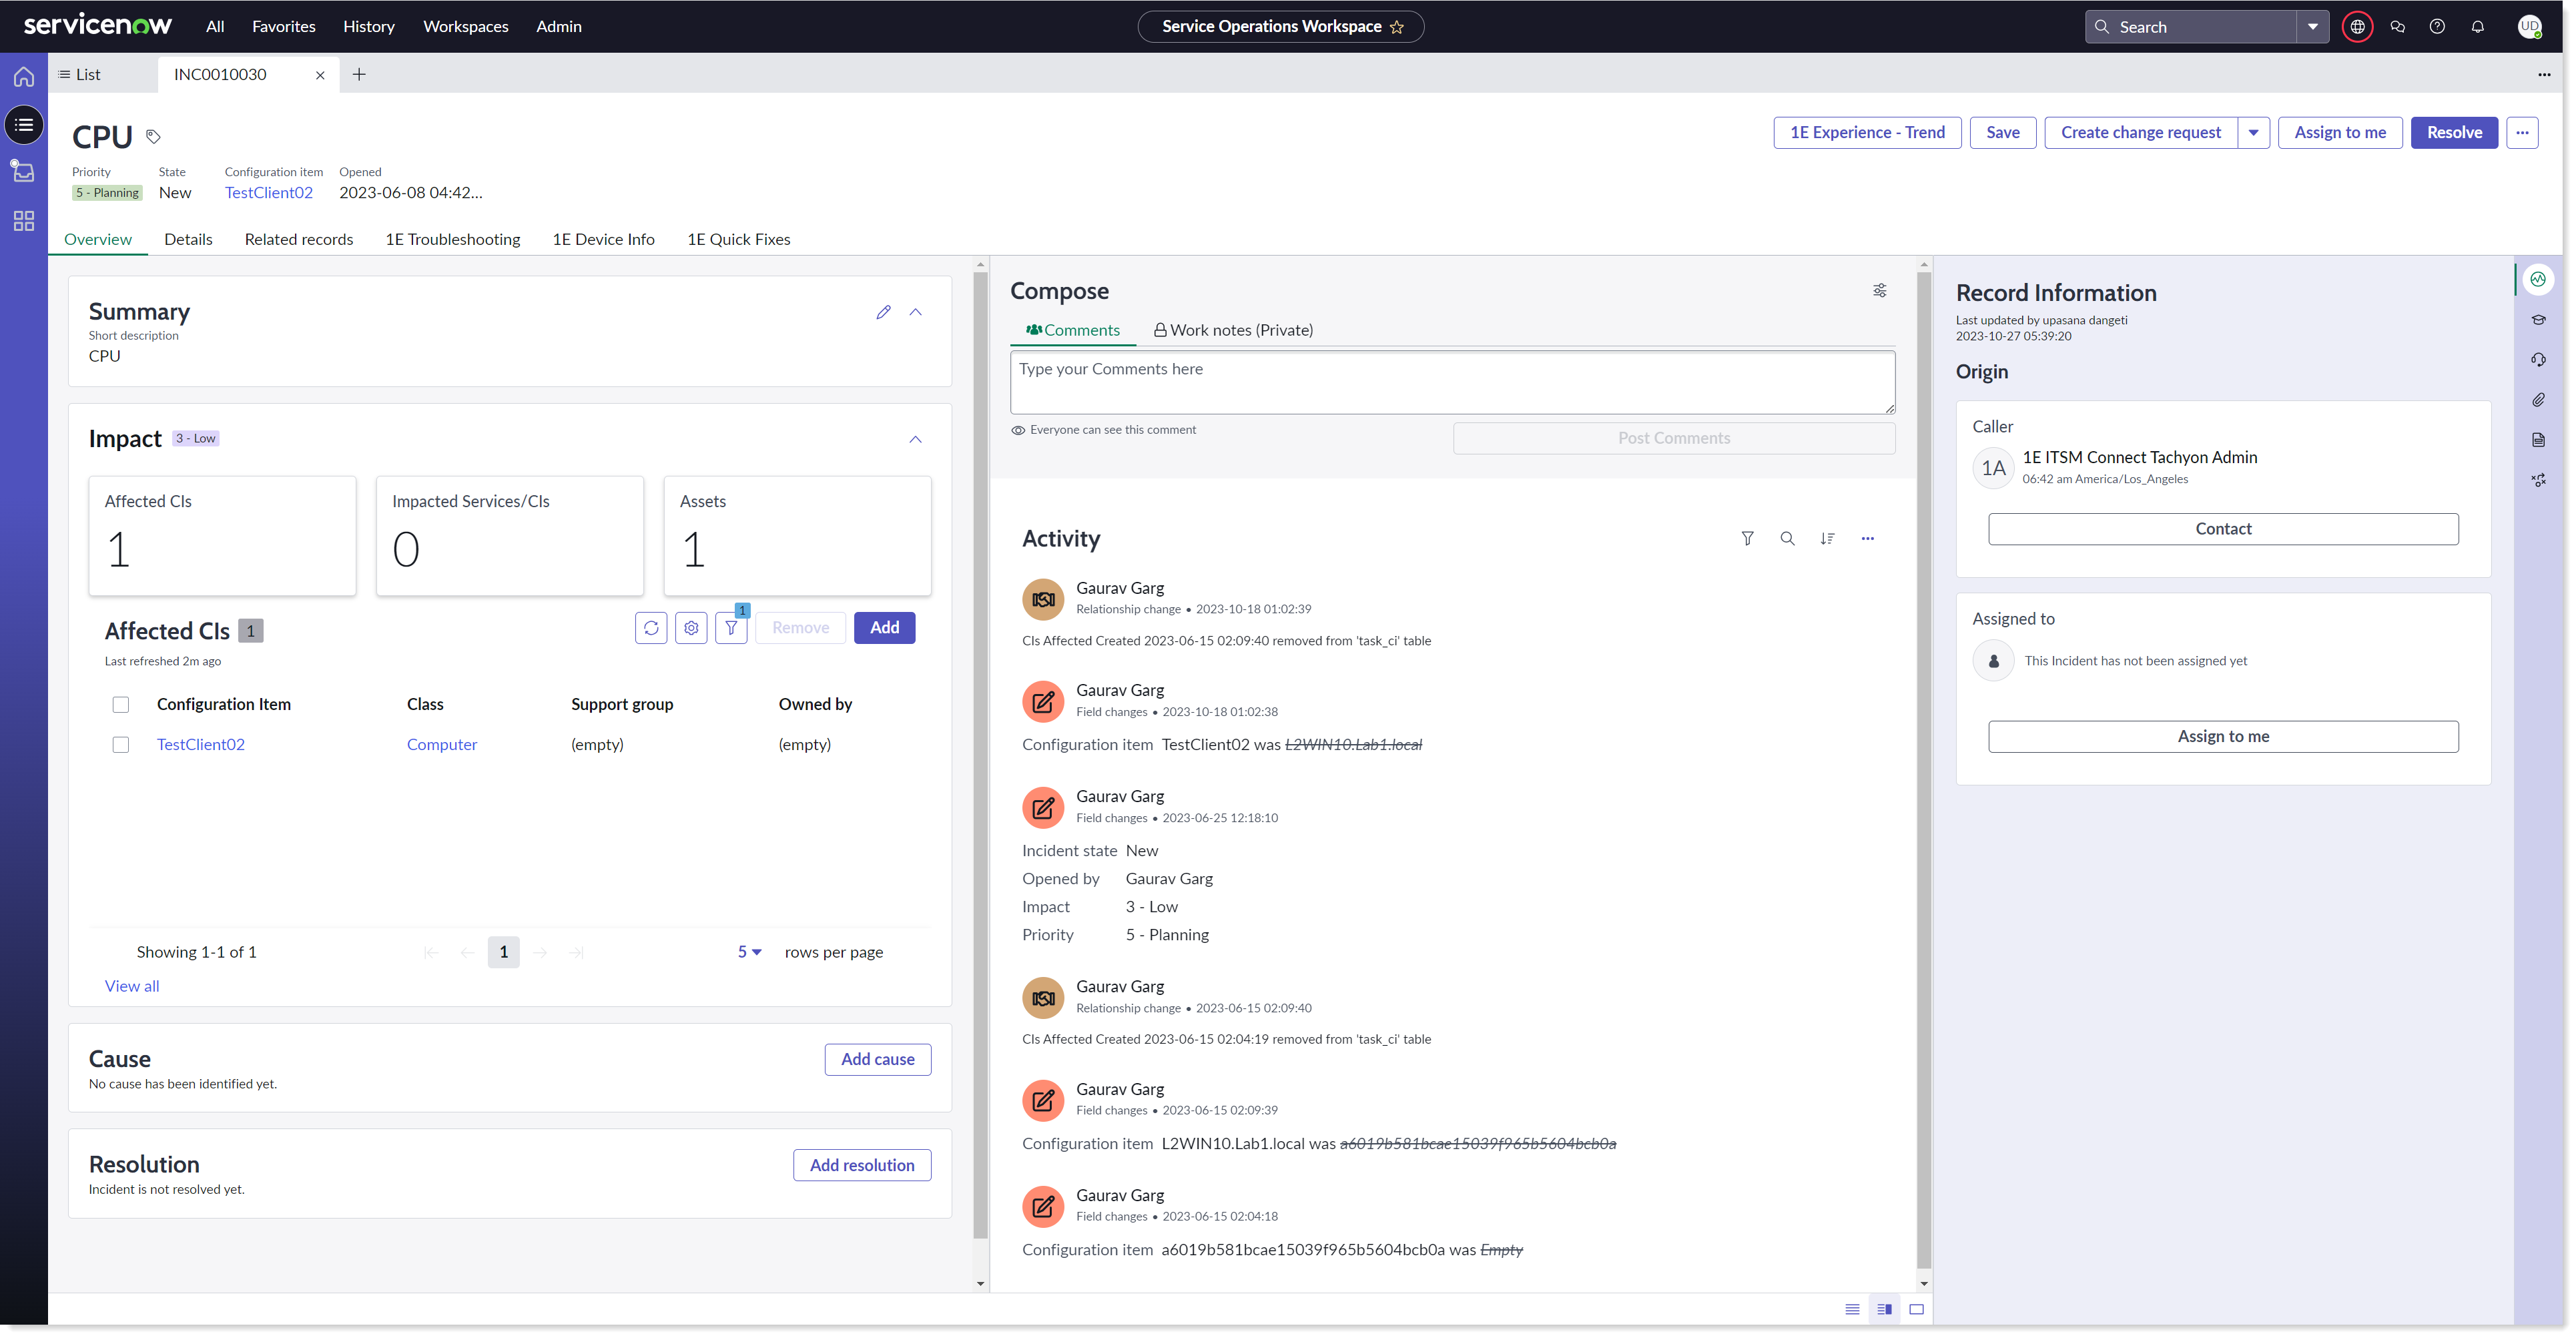
Select the incident from the list which you want to work on and click on the incident. The overview of the selected incident is now displayed in a new tab, as shown in the picture below. Along with incident Overview tab it also displays other tabs including Details, Related records, 1E Troubleshooting, 1E Device info and 1E Quick Fixes. Notice that this incident has impacted 1 item as shown under Affected CIs.
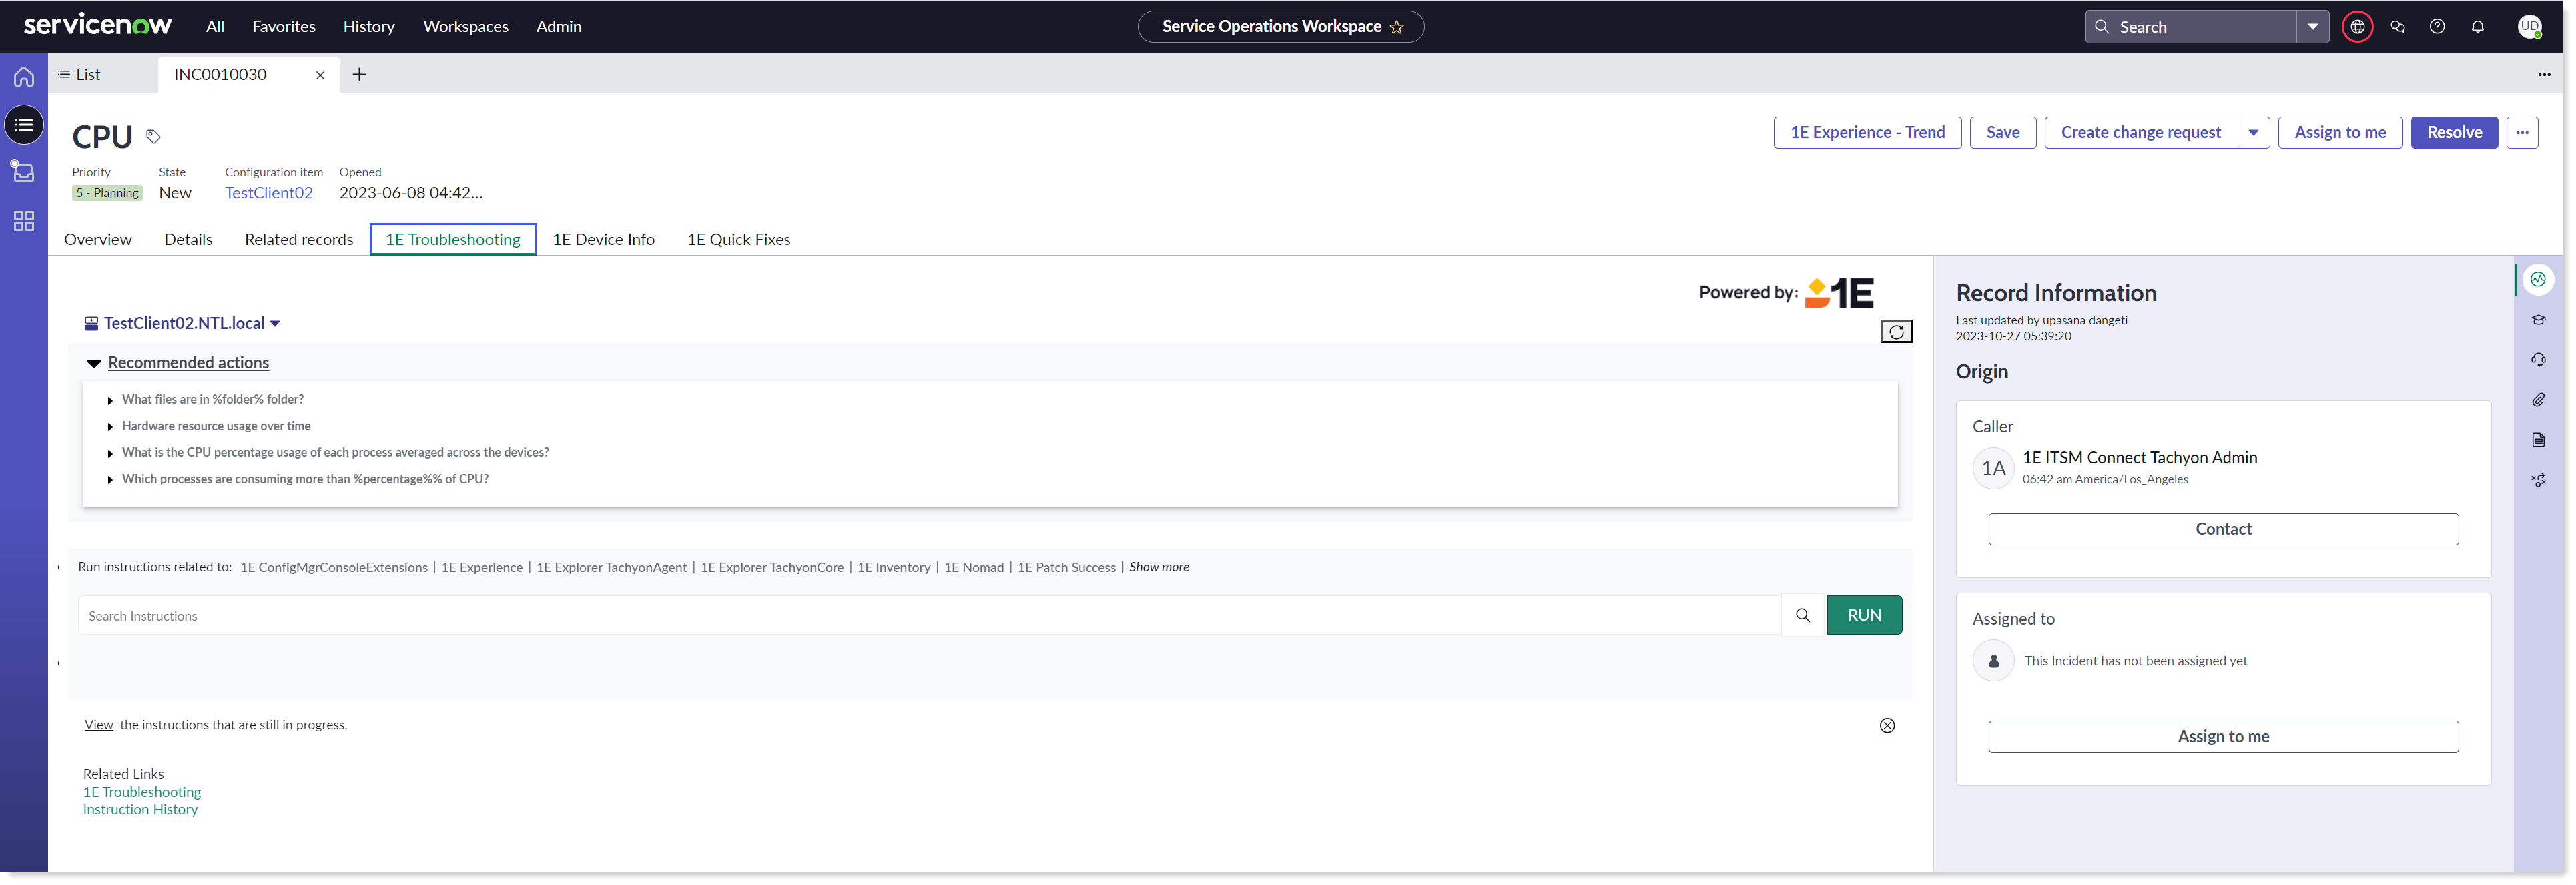
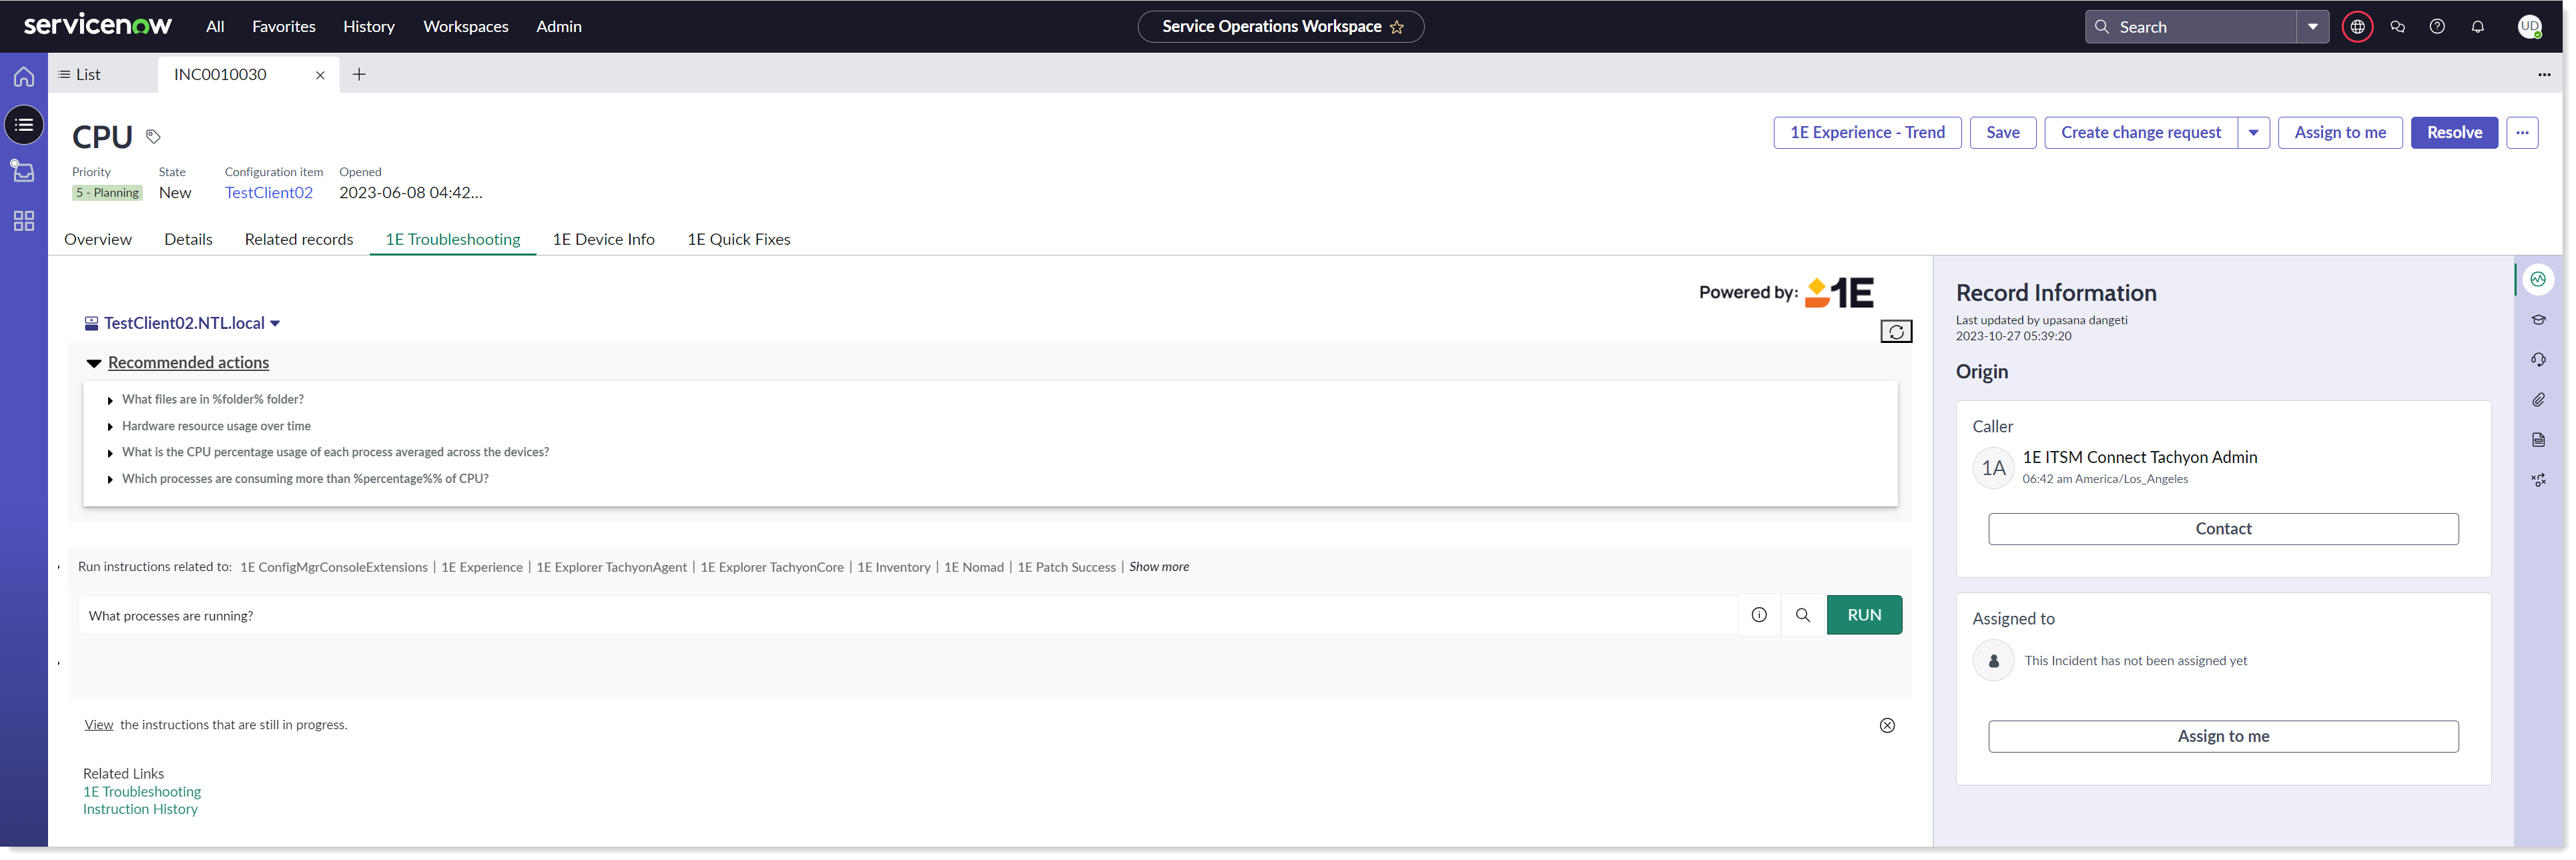
Click on 1E Troubleshooting tab to execute the 1E instruction. The screen displays the following information:
A dropdown list of all the impacted devices as shown in the picture below. By default, all the devices are selected, select the device on which you want to run the 1E instruction. You can either select or deselect a device, by clicking on the device name in the given dropdown list.
A Refresh button is also given on the 1E Troubleshooting page.
A list of Recommended Actions that you can select from.
A UI with instruction set names, a test box and a RUN button is displayed. When you start to type in the text box, it shows you all possible suggestions.
You can select instruction(s) from either these suggestions, Recommended Actions list, or instruction set pop-up window.
When you click on the instruction set name, it opens up a pop-up window with the list of instructions those are part of the selected instruction set.
There are two links given under the Related links:
1E Troubleshooting: When you click on this link, it will open 1E Troubleshooting in a separate window. It will show an alert message about the missing information, if 1E Explorer URL property is not configured in 1E Core → App Configuration properly.
Instruction History: When you click on this link, it will open Instruction History page in a new window, including the triggered instruction(s) details related to the current incident.
A message View instructions that are still in progress. This message is displayed when there is already an instruction running or in progress for the current incident.
Select an instruction and fill the required parameters if there are any. Click on the RUN button to execute the instruction on 1E.
The responses received from 1E are displayed in a table as shown below.
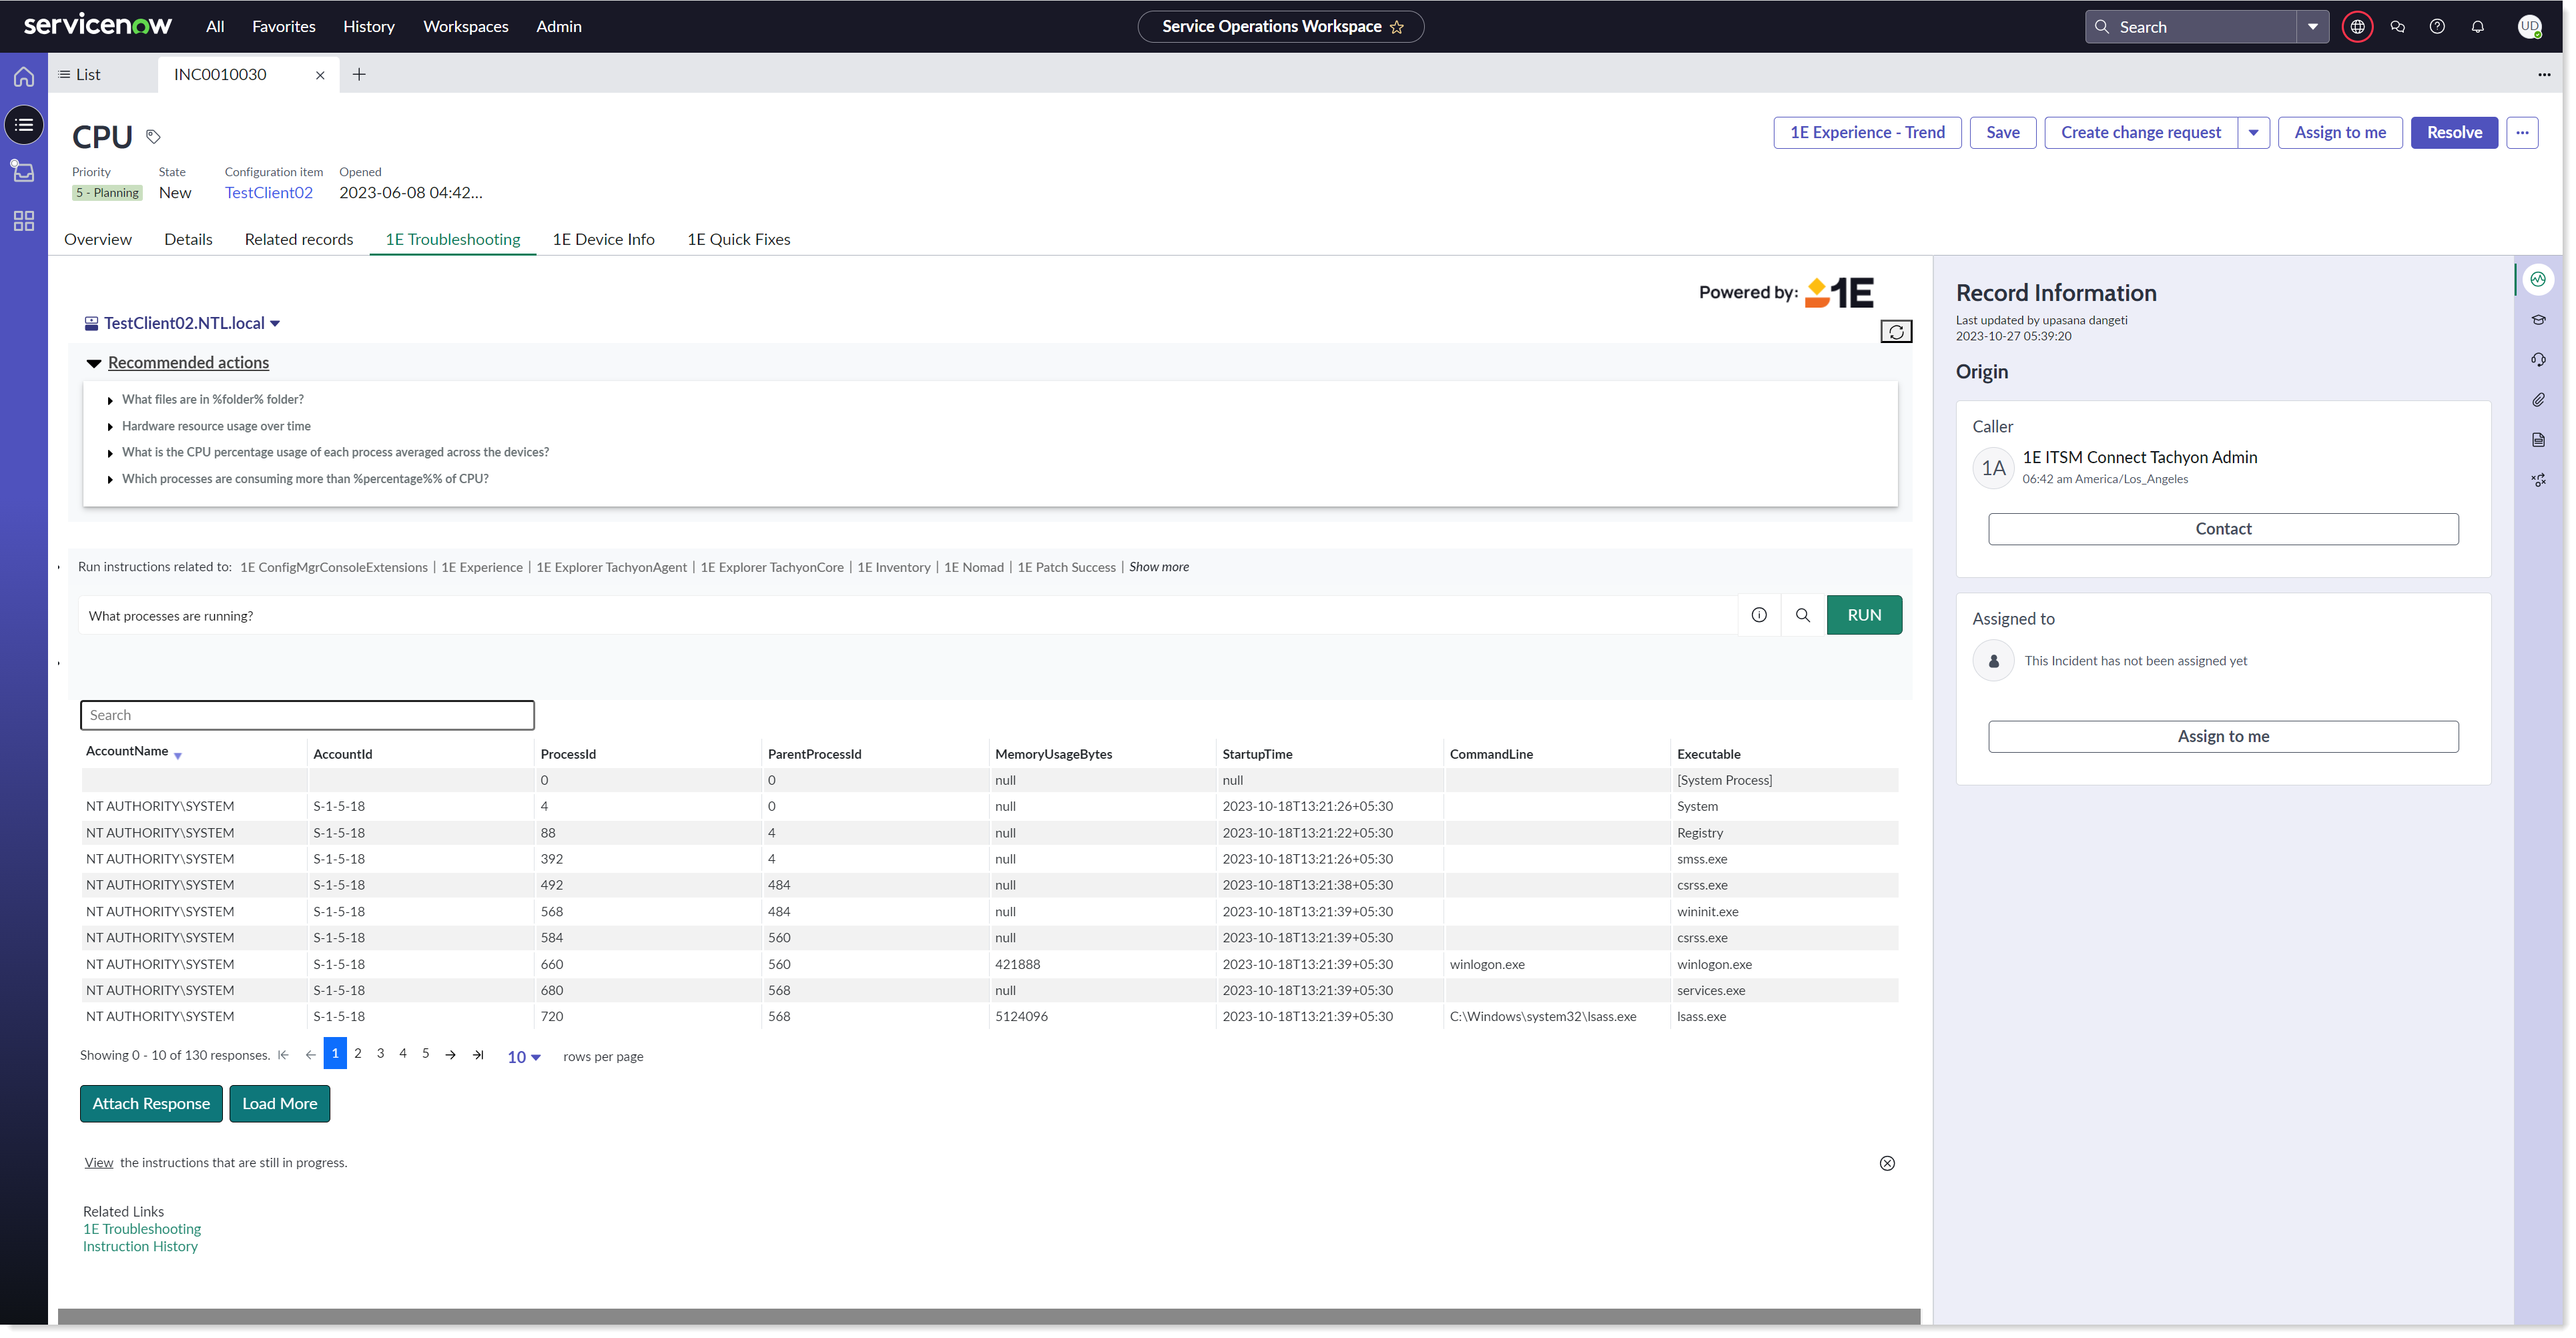
You can attach these responses using the Attach Response tab given at the bottom to the selected incident, i.e. from where the instruction has been triggered. The Load More tab helps you to load more responses for the selected device. You can also do a search in the search box available.
In case there is an approval required to execute the triggered instruction, then it will follow the approval workflow. The instruction is submitted for review and upon receiving an approval only the instruction will be executed on 1E. User will be able to see the responses of this instruction on Instruction History page.
Investigating an Interaction in Service Operations Workspace
The interactions in Service Operations Workspace is a centralized location for all the designated communication channels. You can respond to an incoming chat, phone call, walk-up or messaging interactions using Service Operations Workspace. You can work on any interaction using the following steps.
You can find the list of interactions and their details available on the Lists page as shown below.
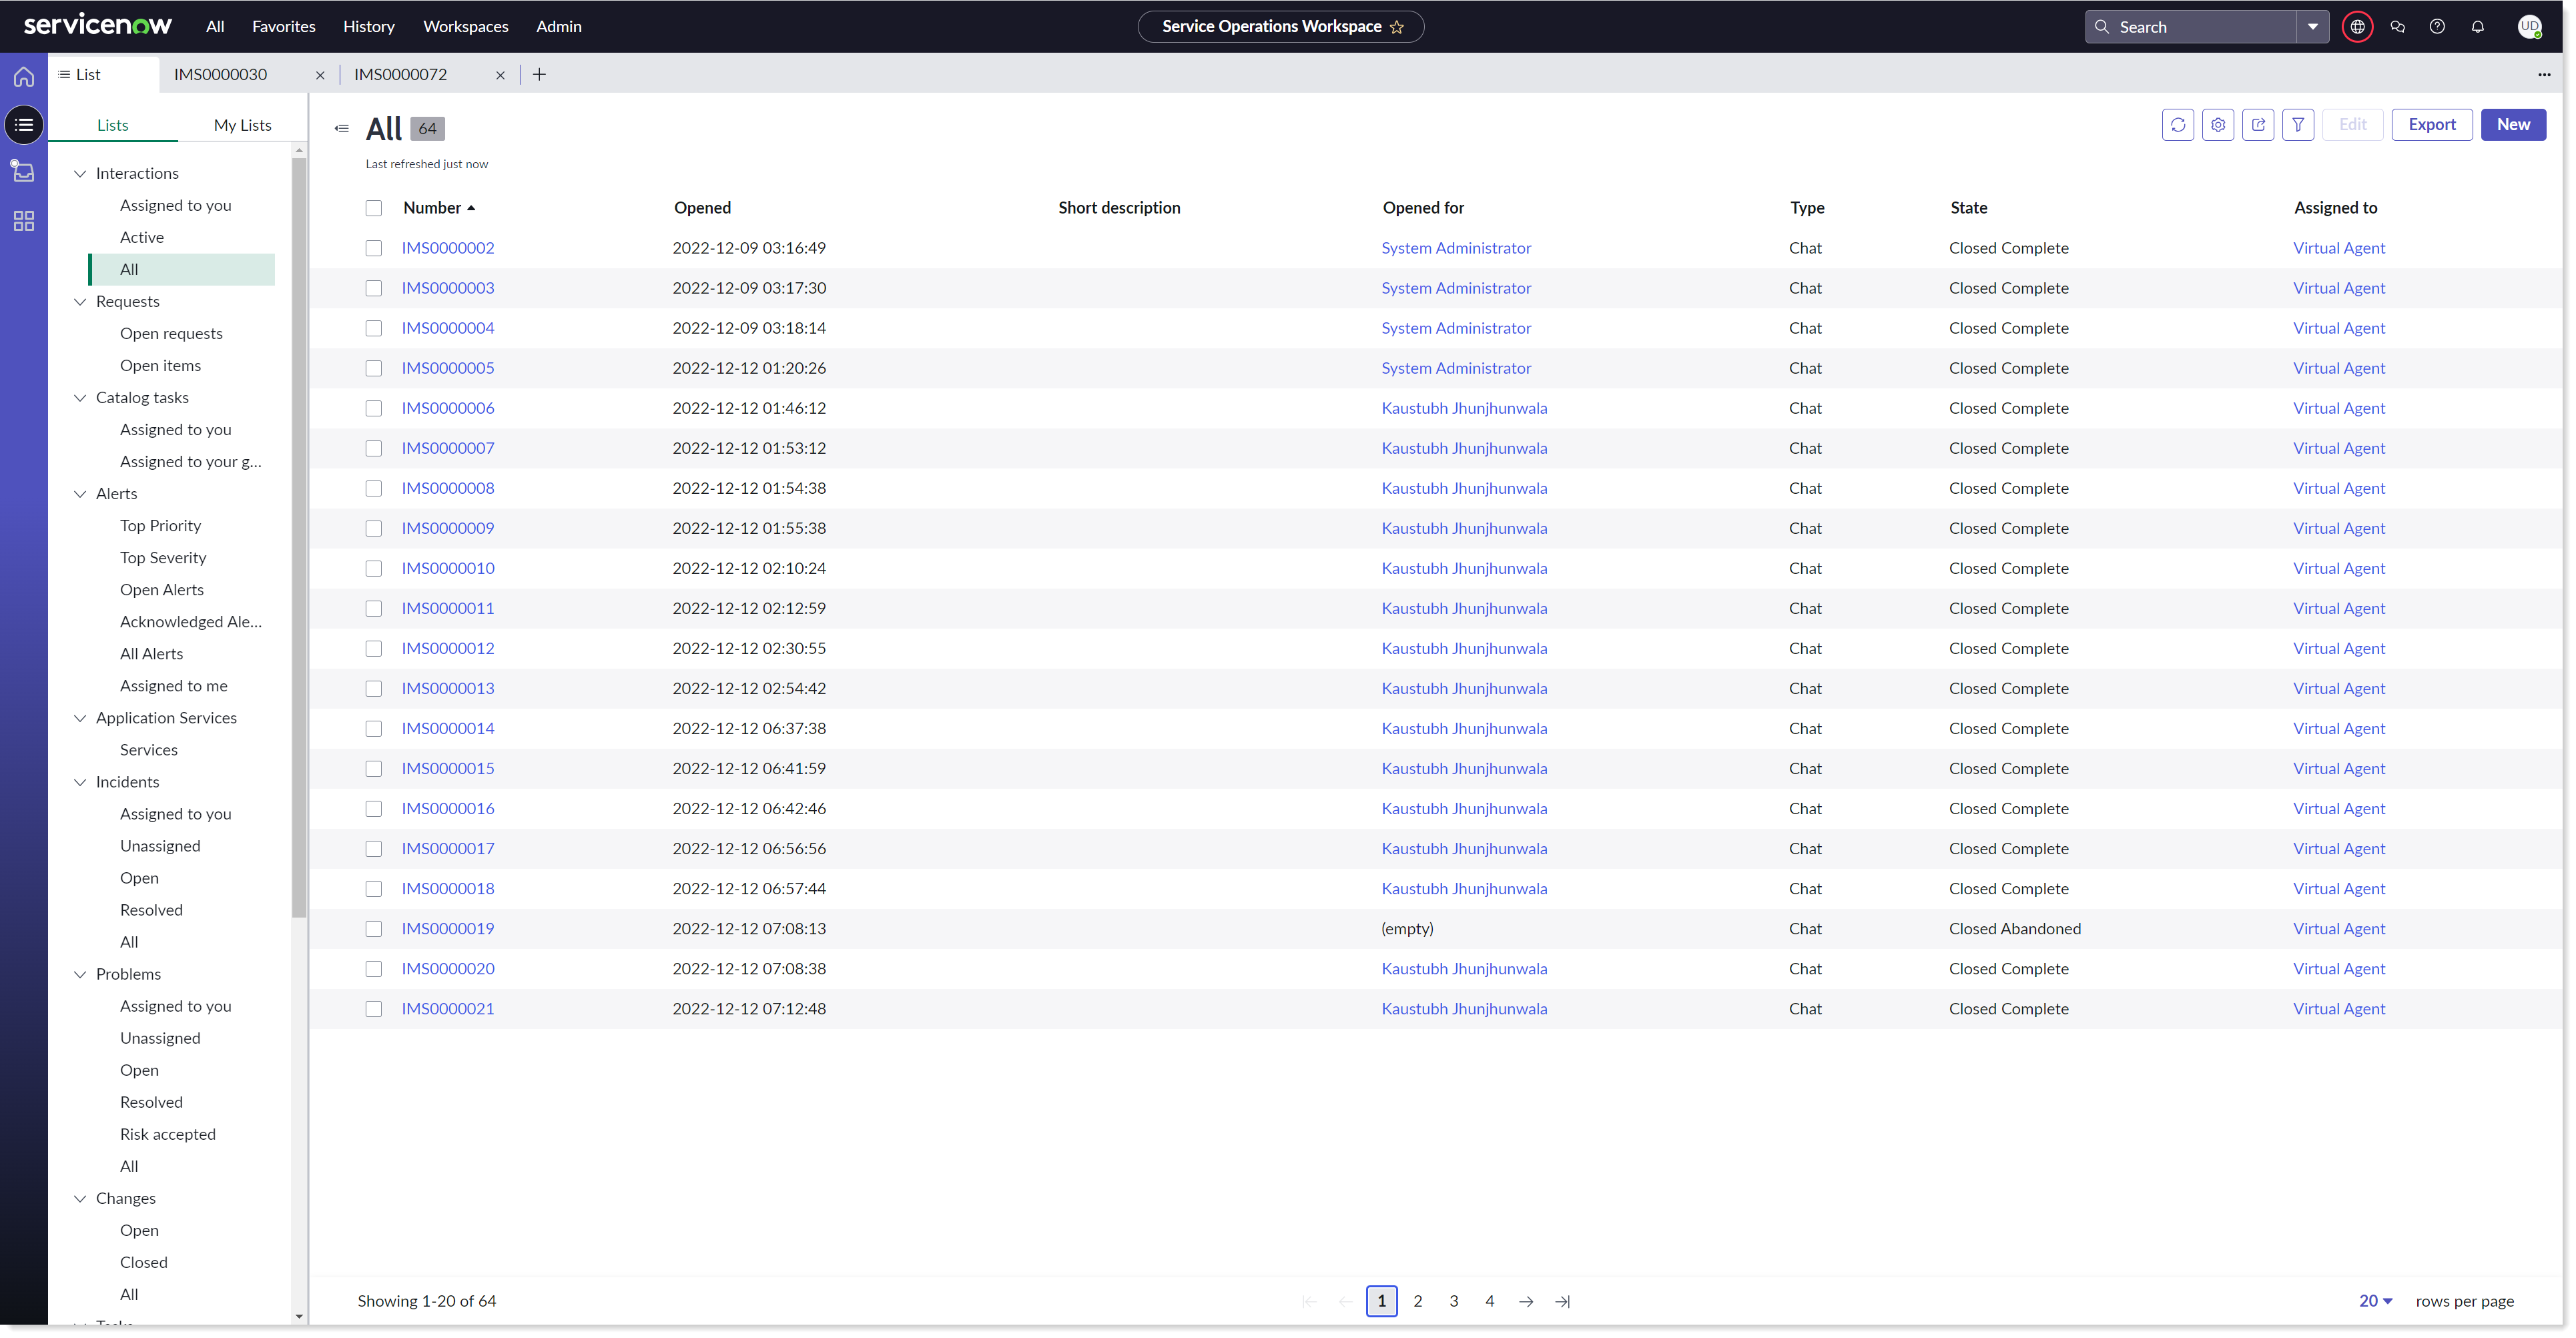
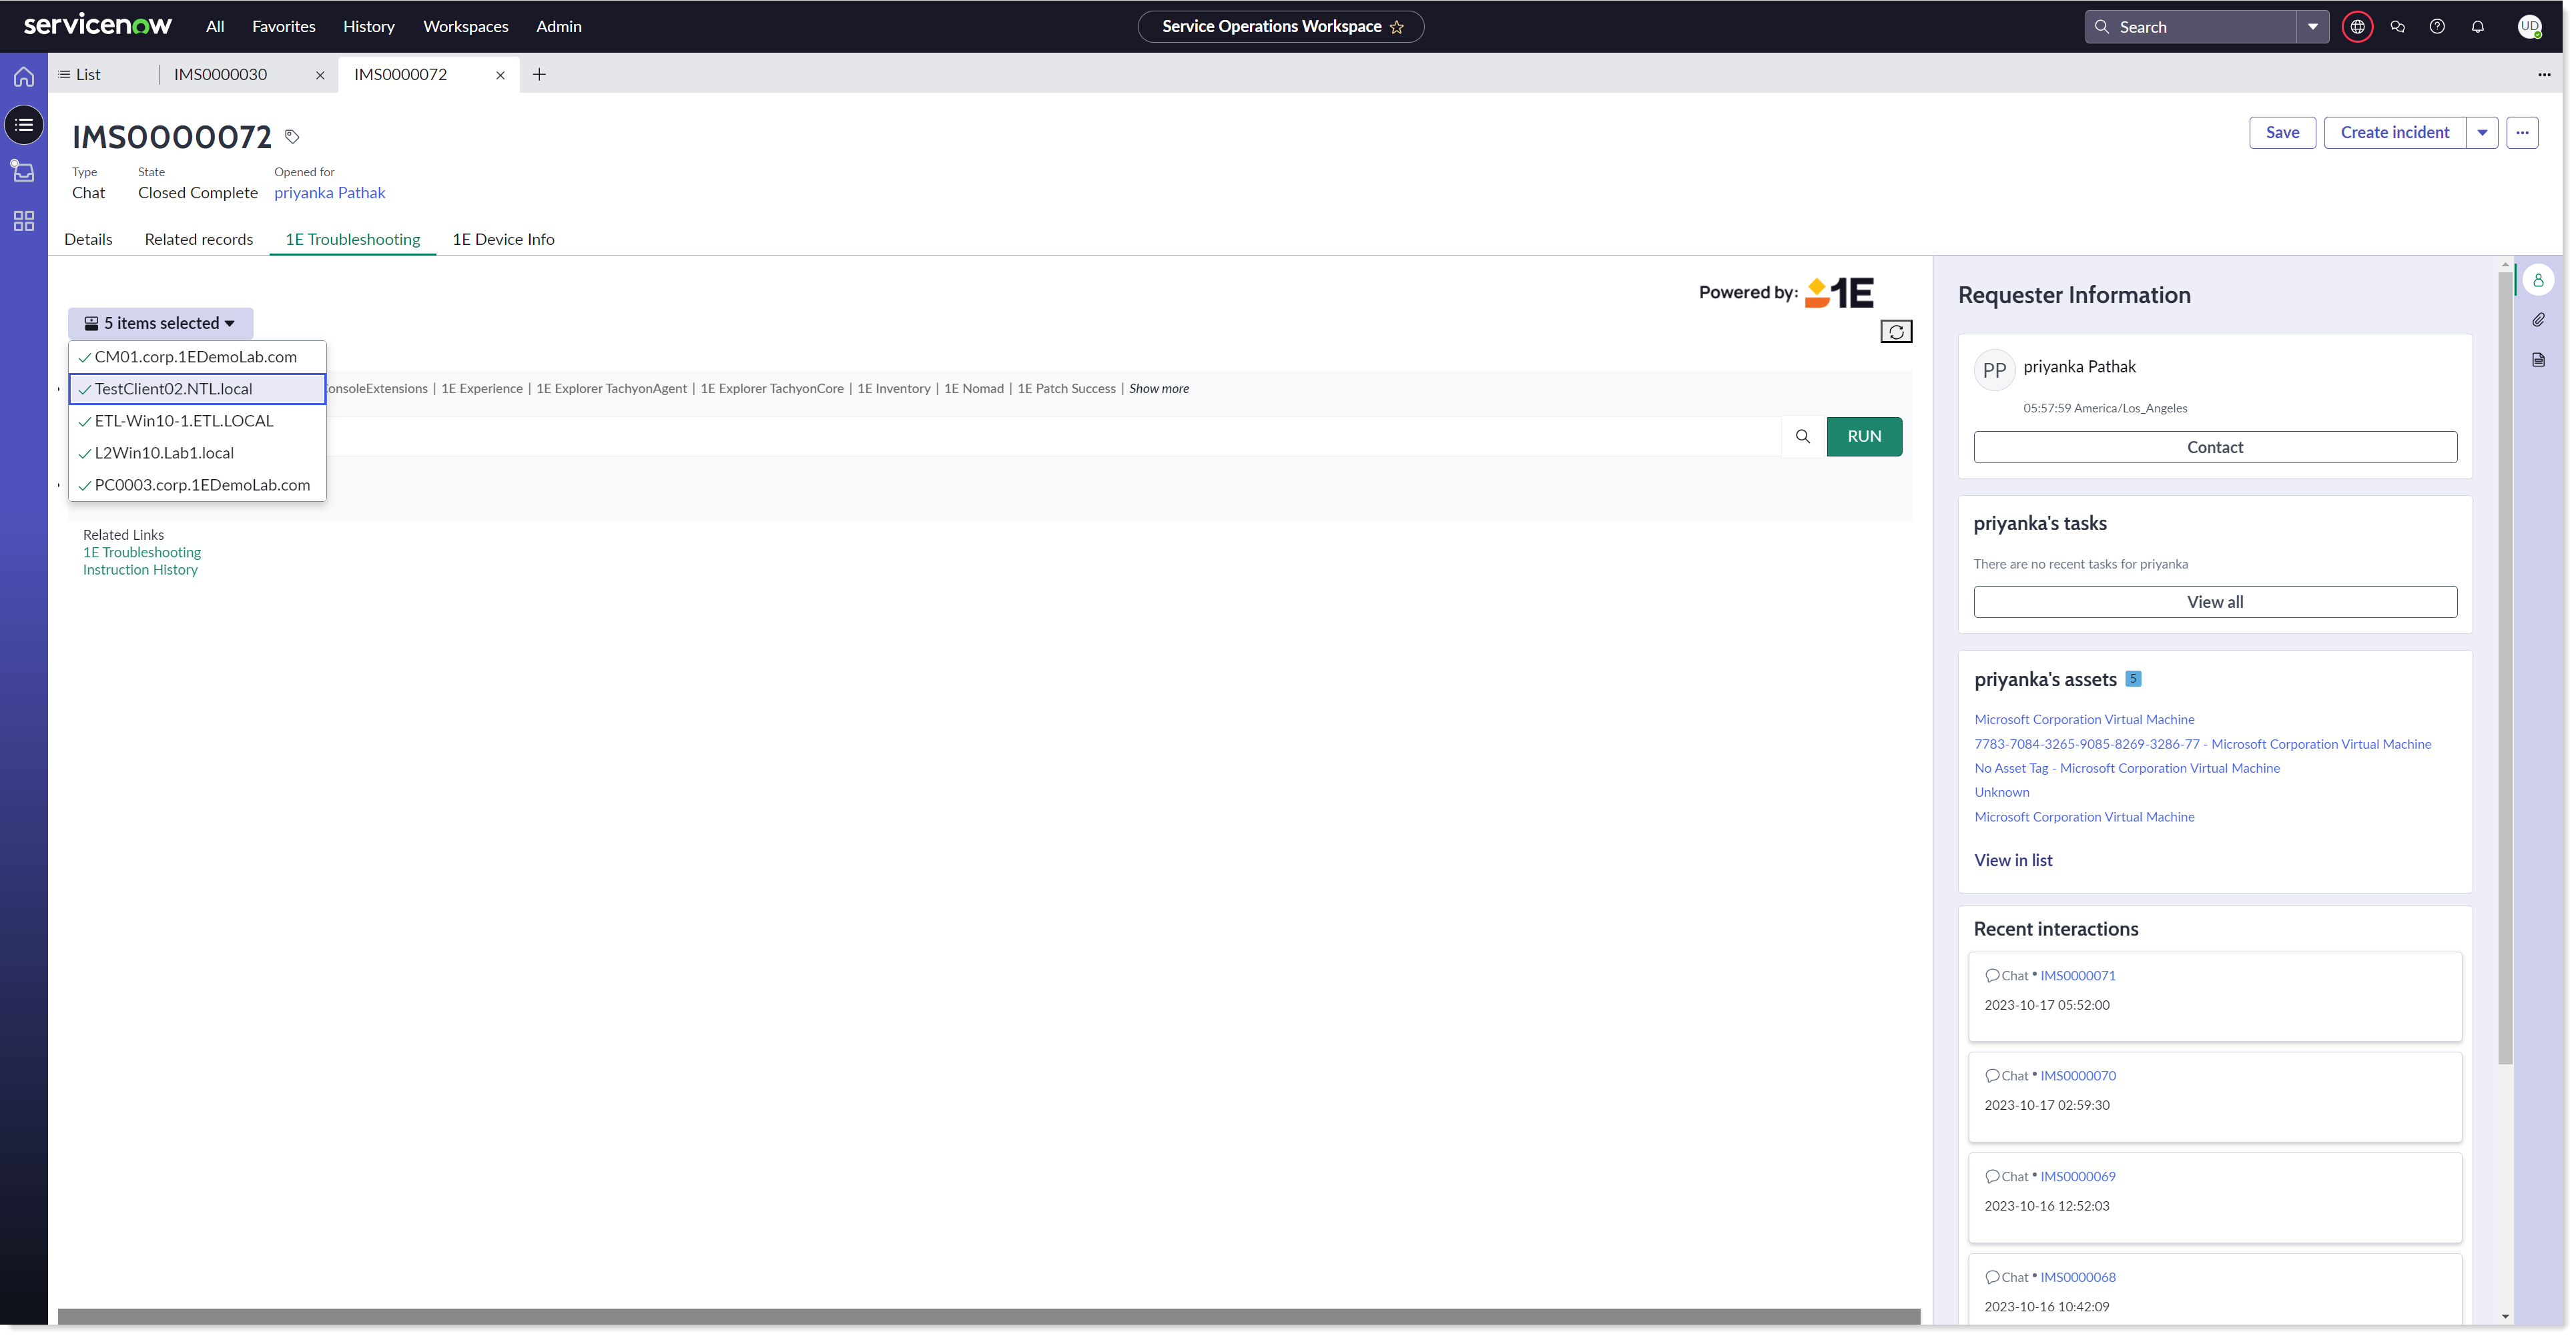
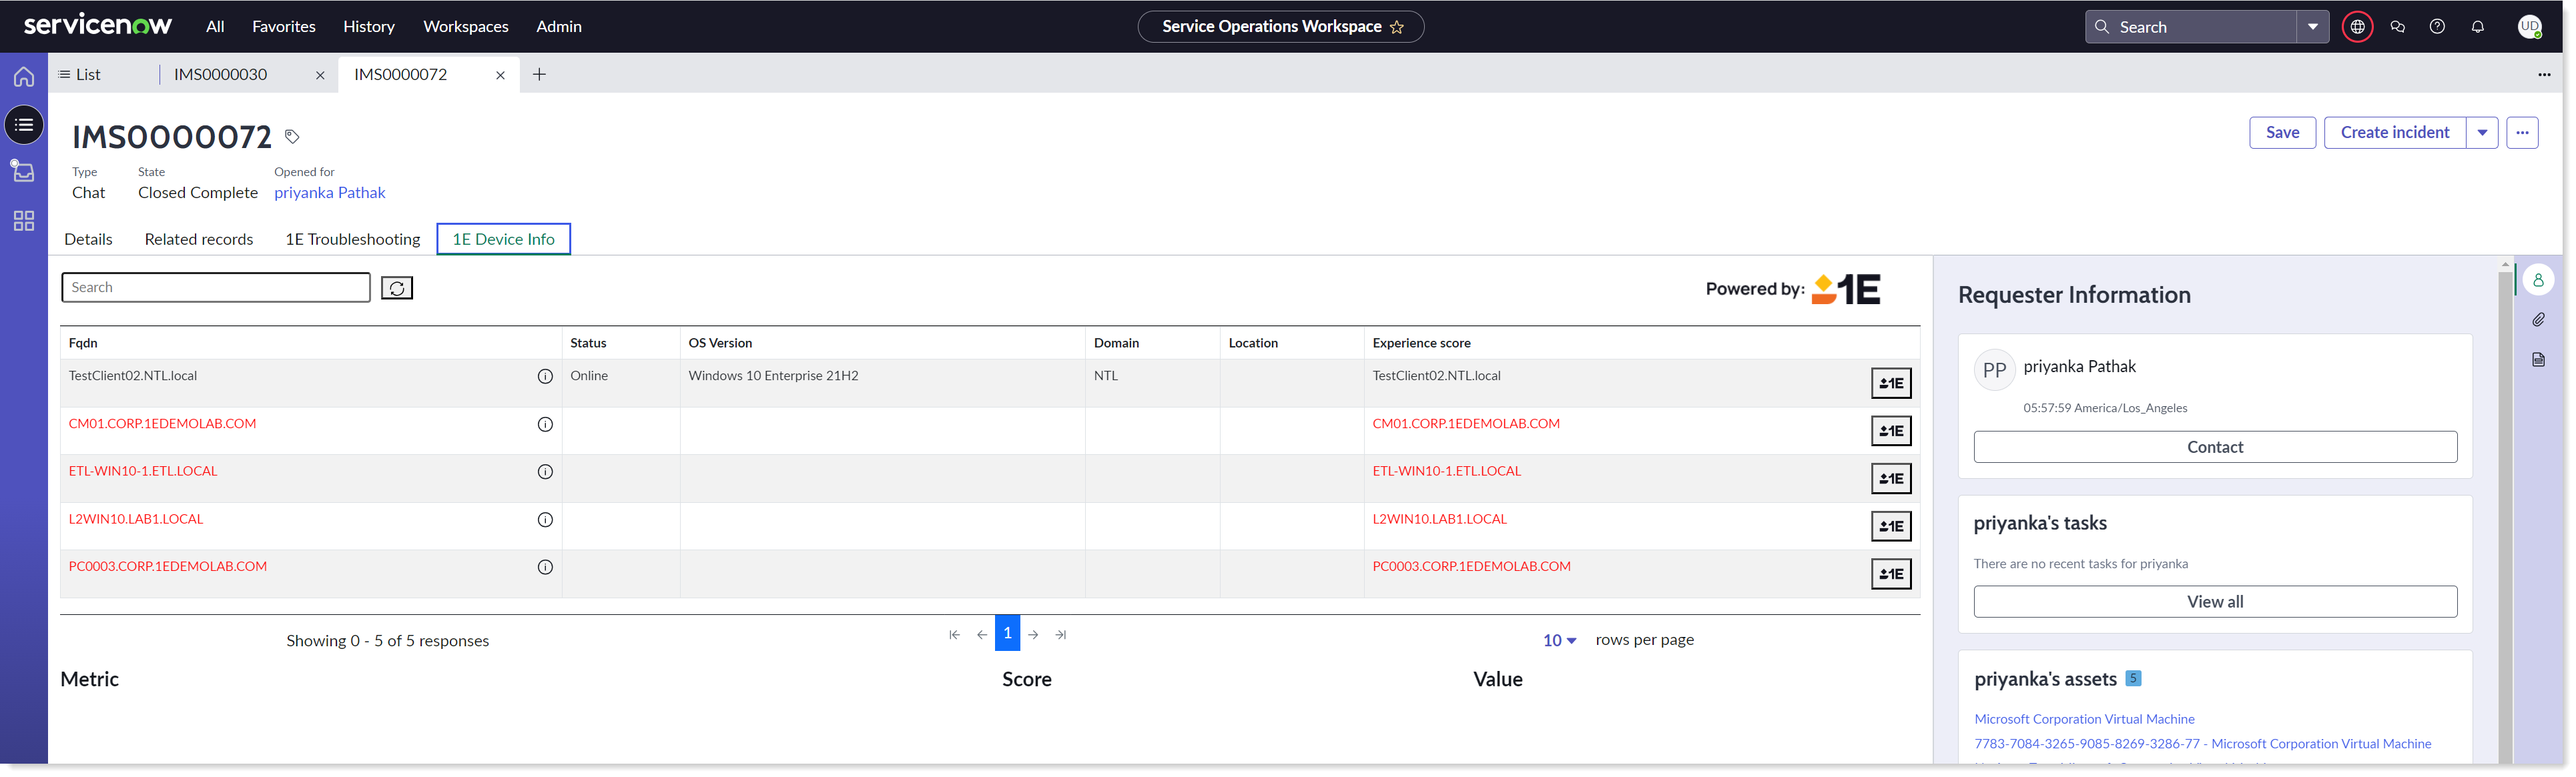
Select any interaction from the list which you want to work on and click on it. The details of the selected interaction are now displayed in a new tab, as shown in the picture below. Along with the Details, it also displays other tabs including Related records, 1E Troubleshooting, and 1E Device Info
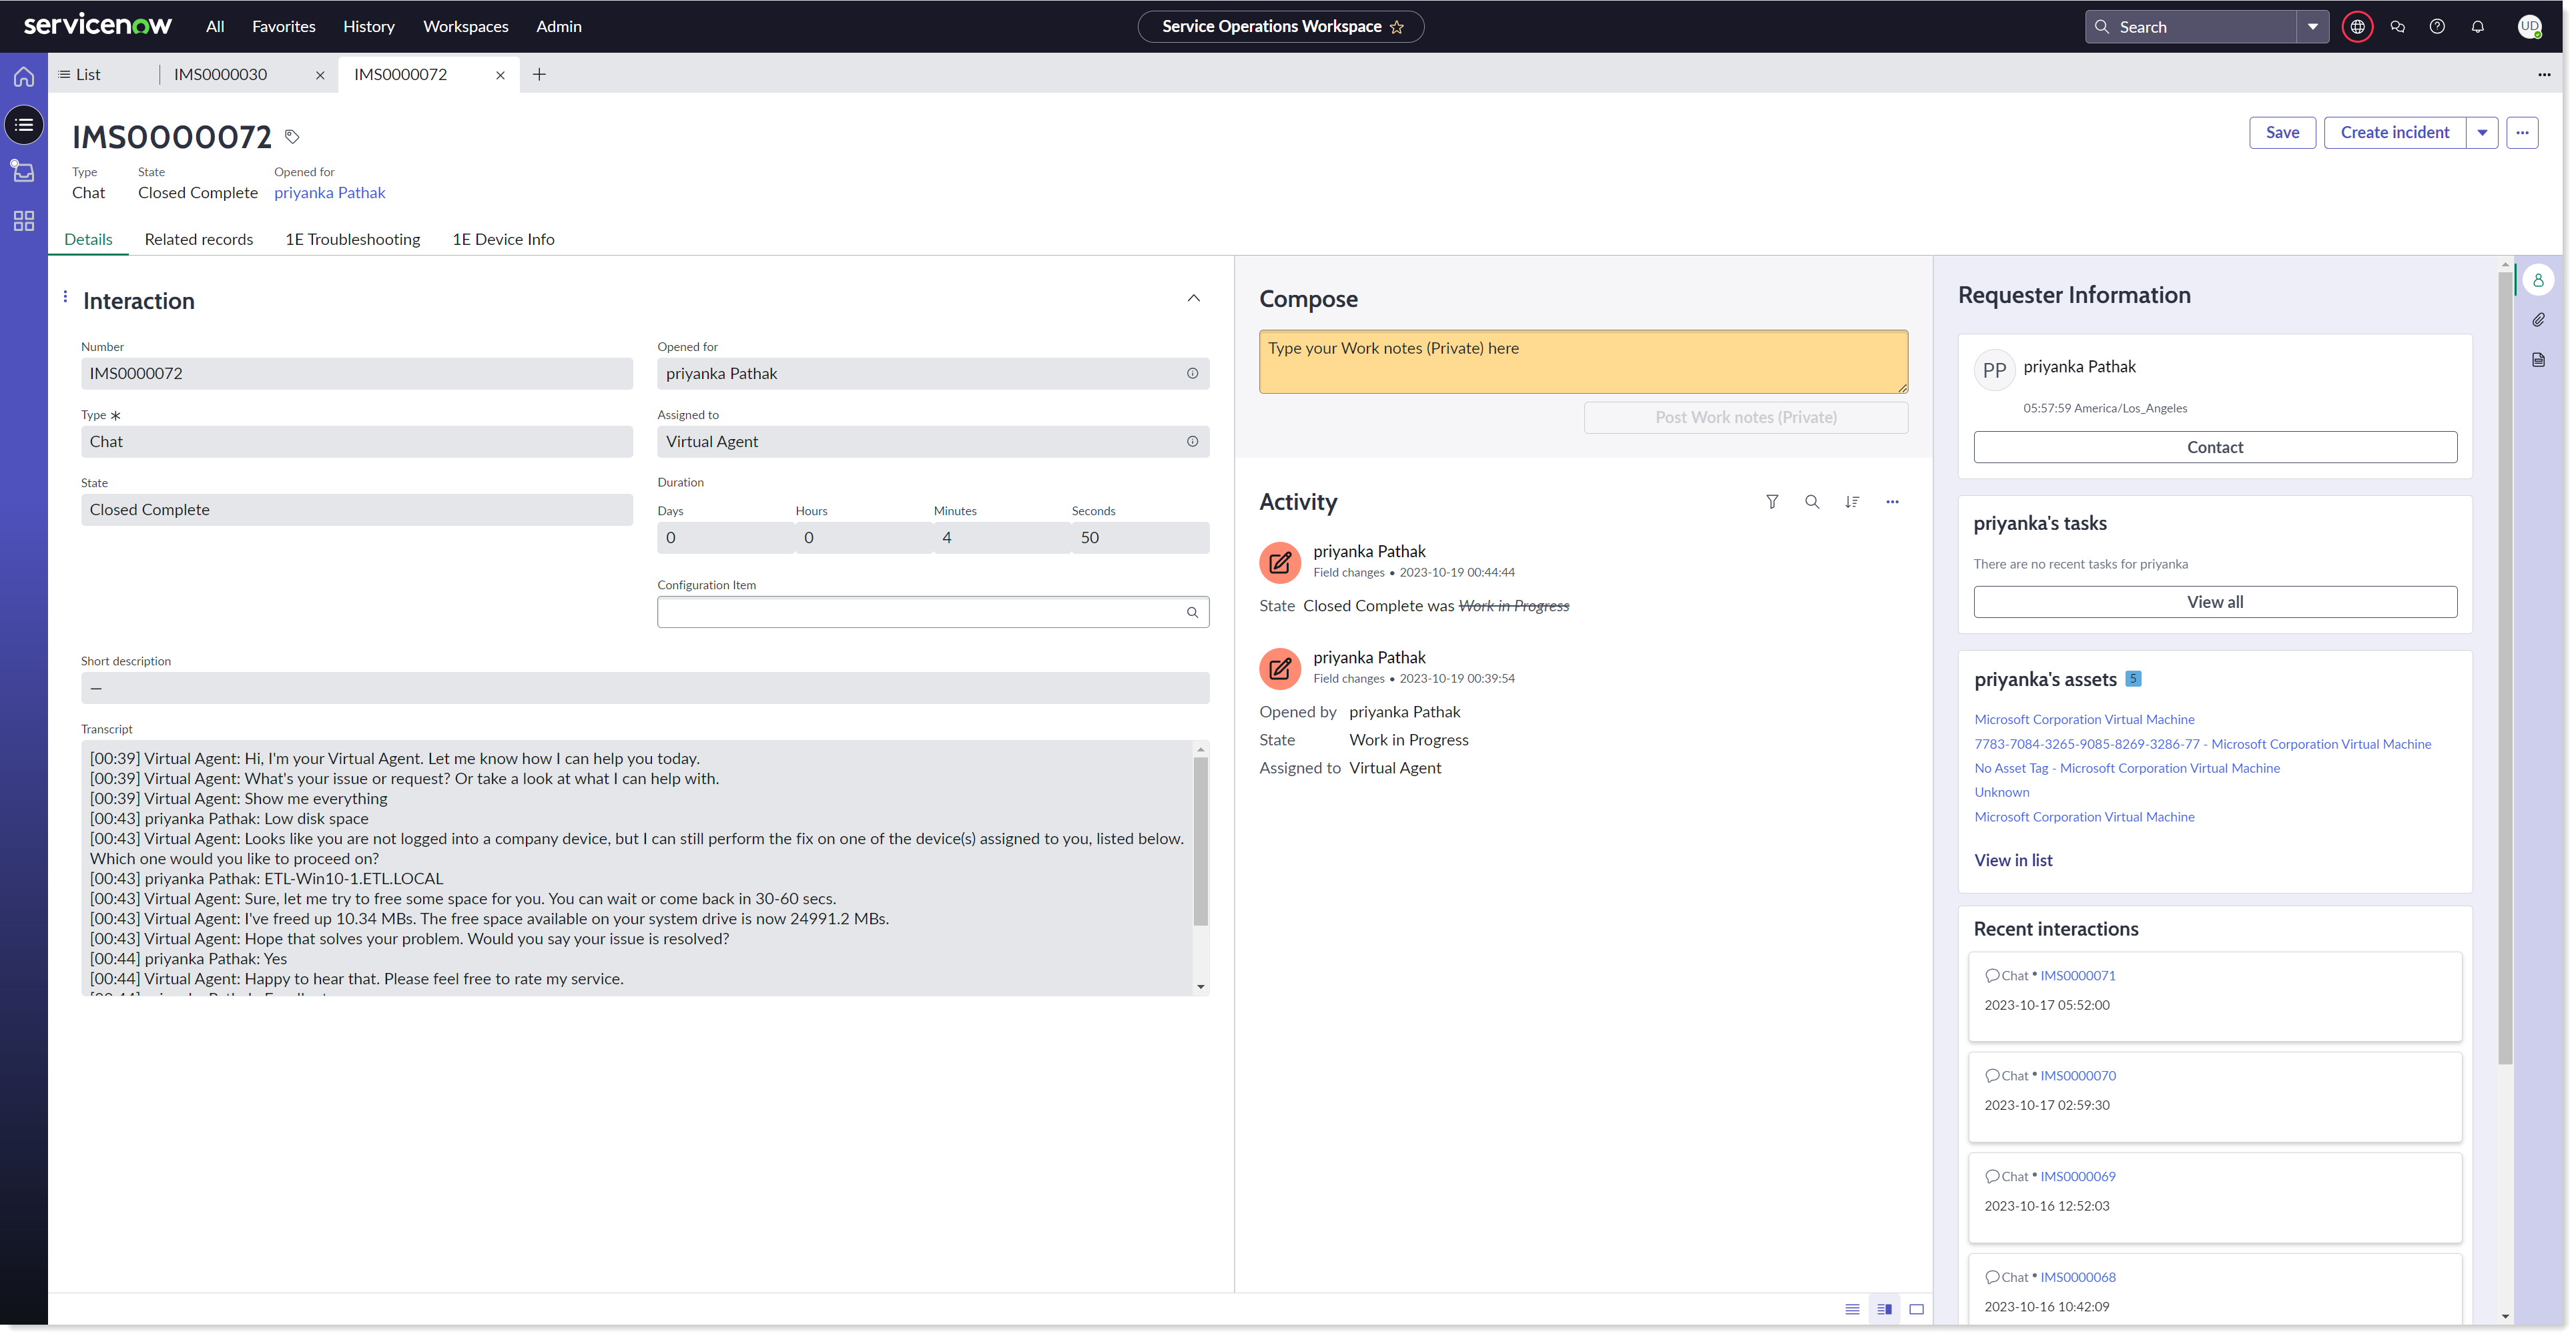
The Details tab gives you the detailed information of the interaction. It allows you to Compose work notes and view records related to the interaction.
Click on 1E Troubleshooting tab to execute the 1E instruction. The screen displays the impacted devices and allows you to run the instructions on the selected device(s) as shown below.
Note that this tab is visible only when there is at least one device assigned to Opened for or Configuration item is populated.
Select an instruction and fill the required parameters if there are any, and click on the RUN button to execute the instruction. The responses are received instantaneously and are displayed as shown below.
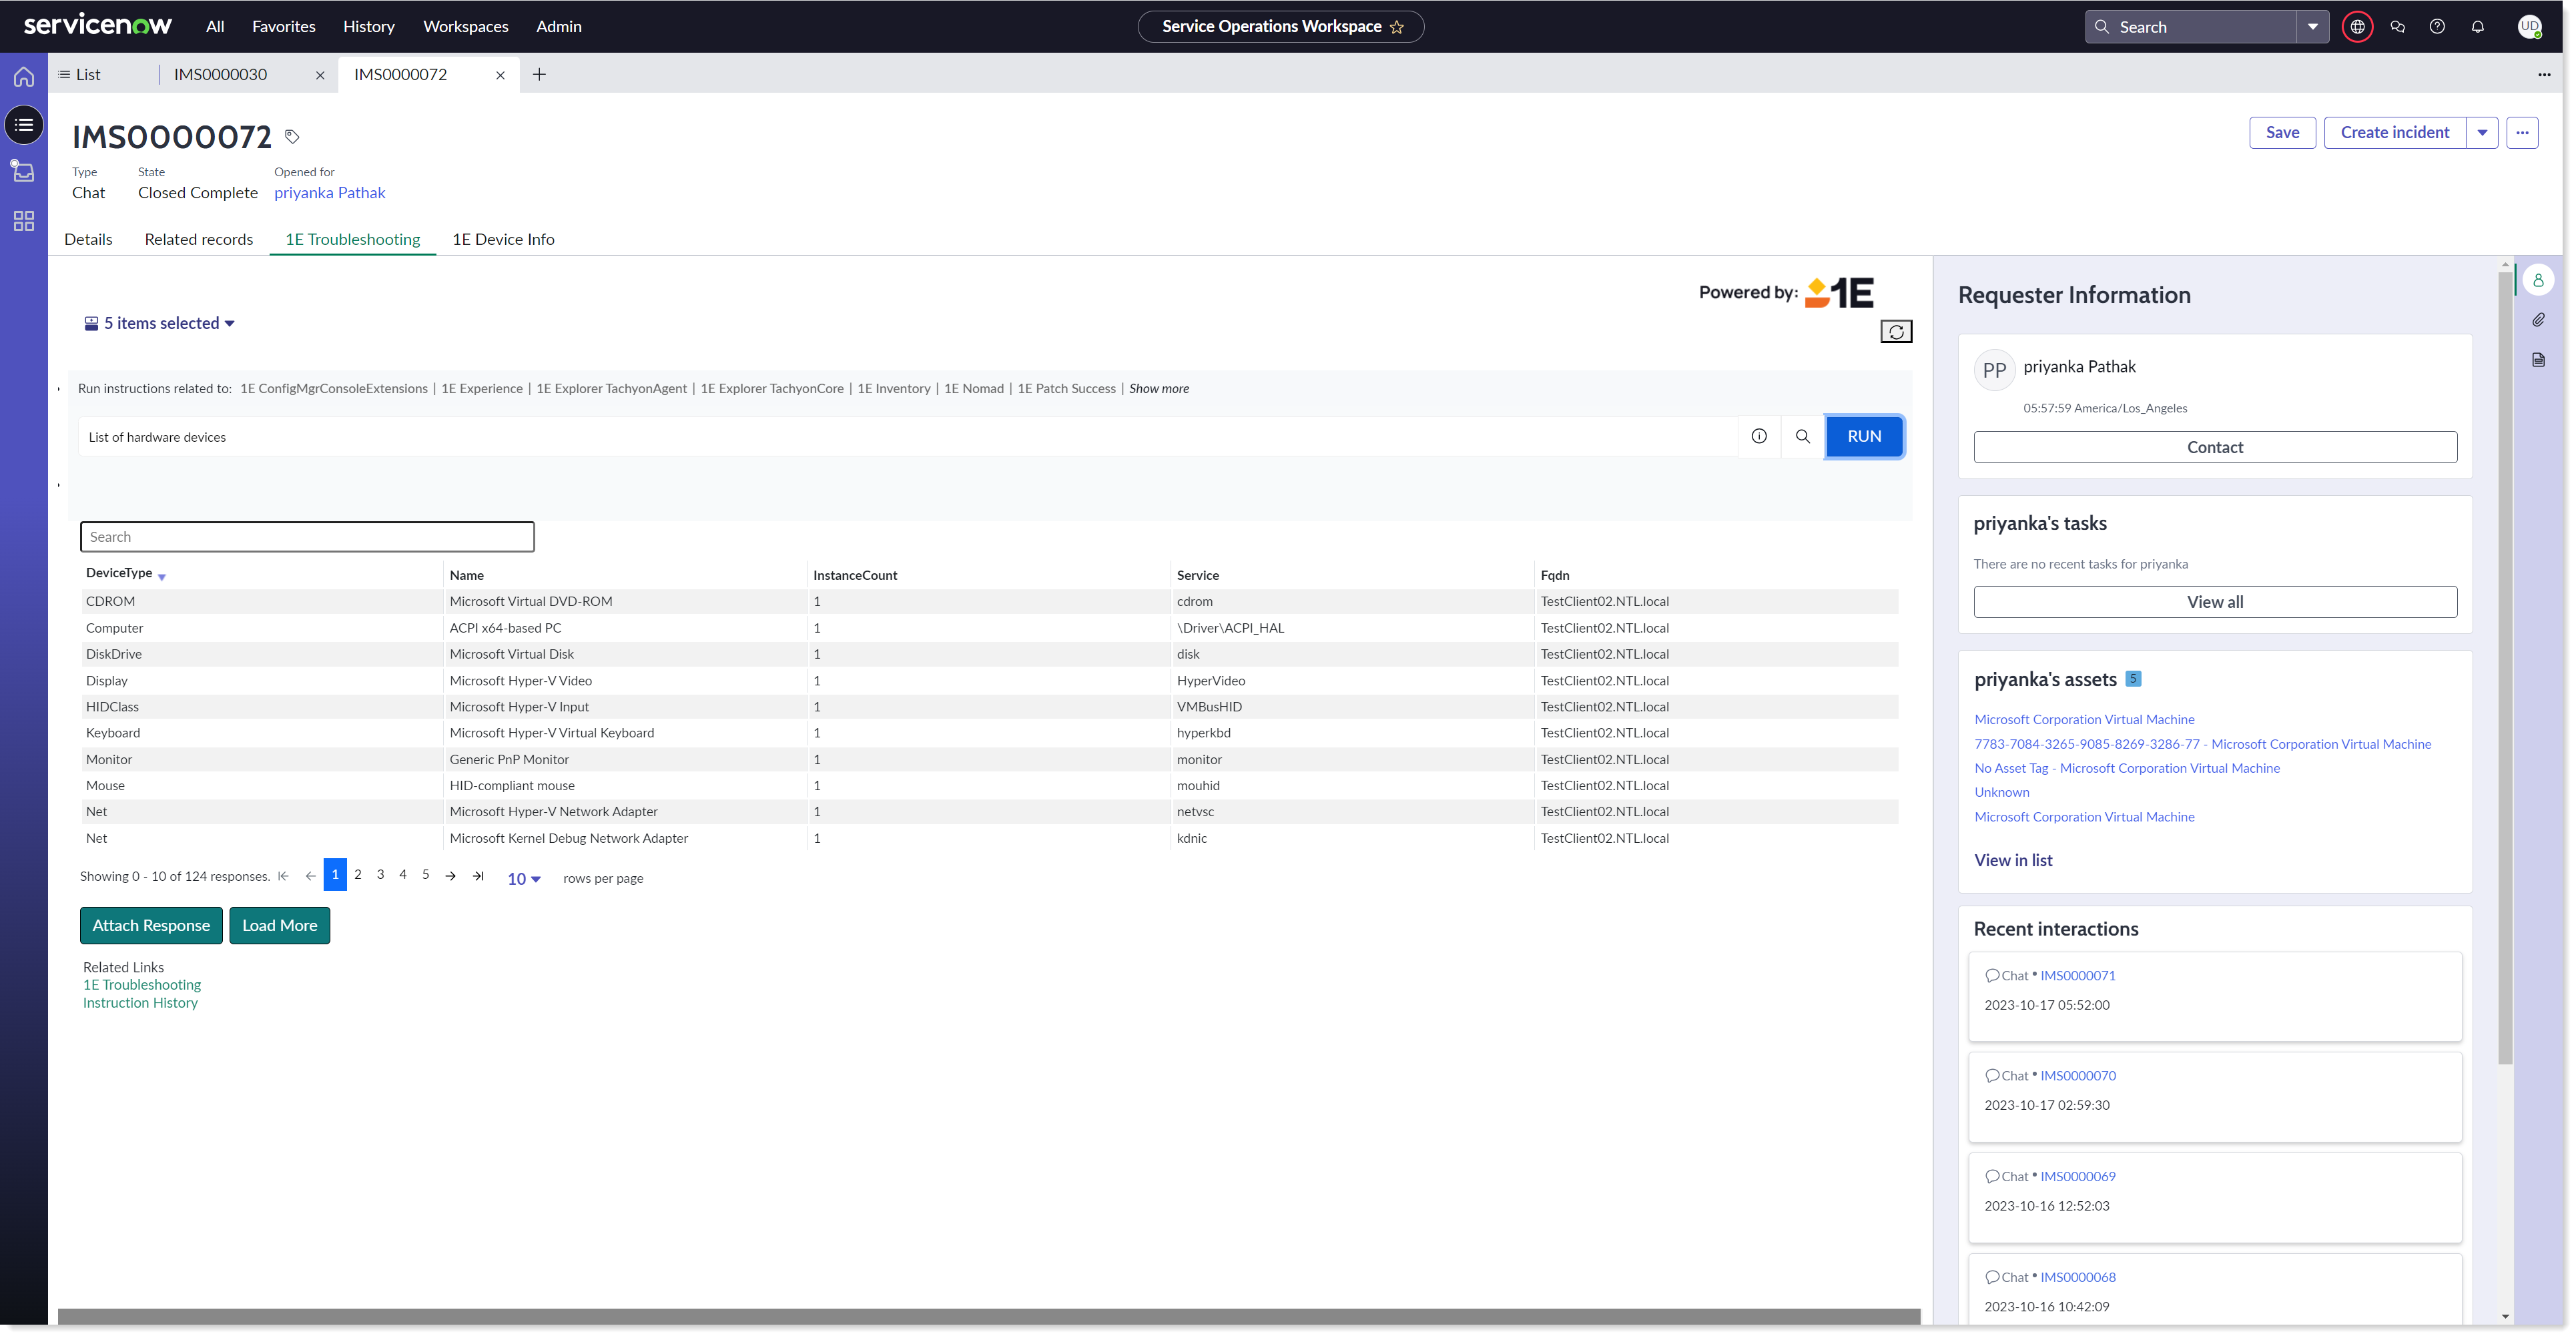
You can attach these responses using the Attach Response tab given at the bottom. The Load More tab helps you to load more responses for the selected device.
In case there is an approval required to execute the triggered instruction, then it will follow the approval workflow. The instruction is submitted for review and upon receiving an approval only the instruction will be executed on 1E. User will be able to see the responses of this instruction on Instruction History page.
1E Device Info
To see the details of 1E Device Info, follow the below steps:
In your workspace, select any incident from the list which you want to work on. The details of the selected incidents are now displayed in a new tab.
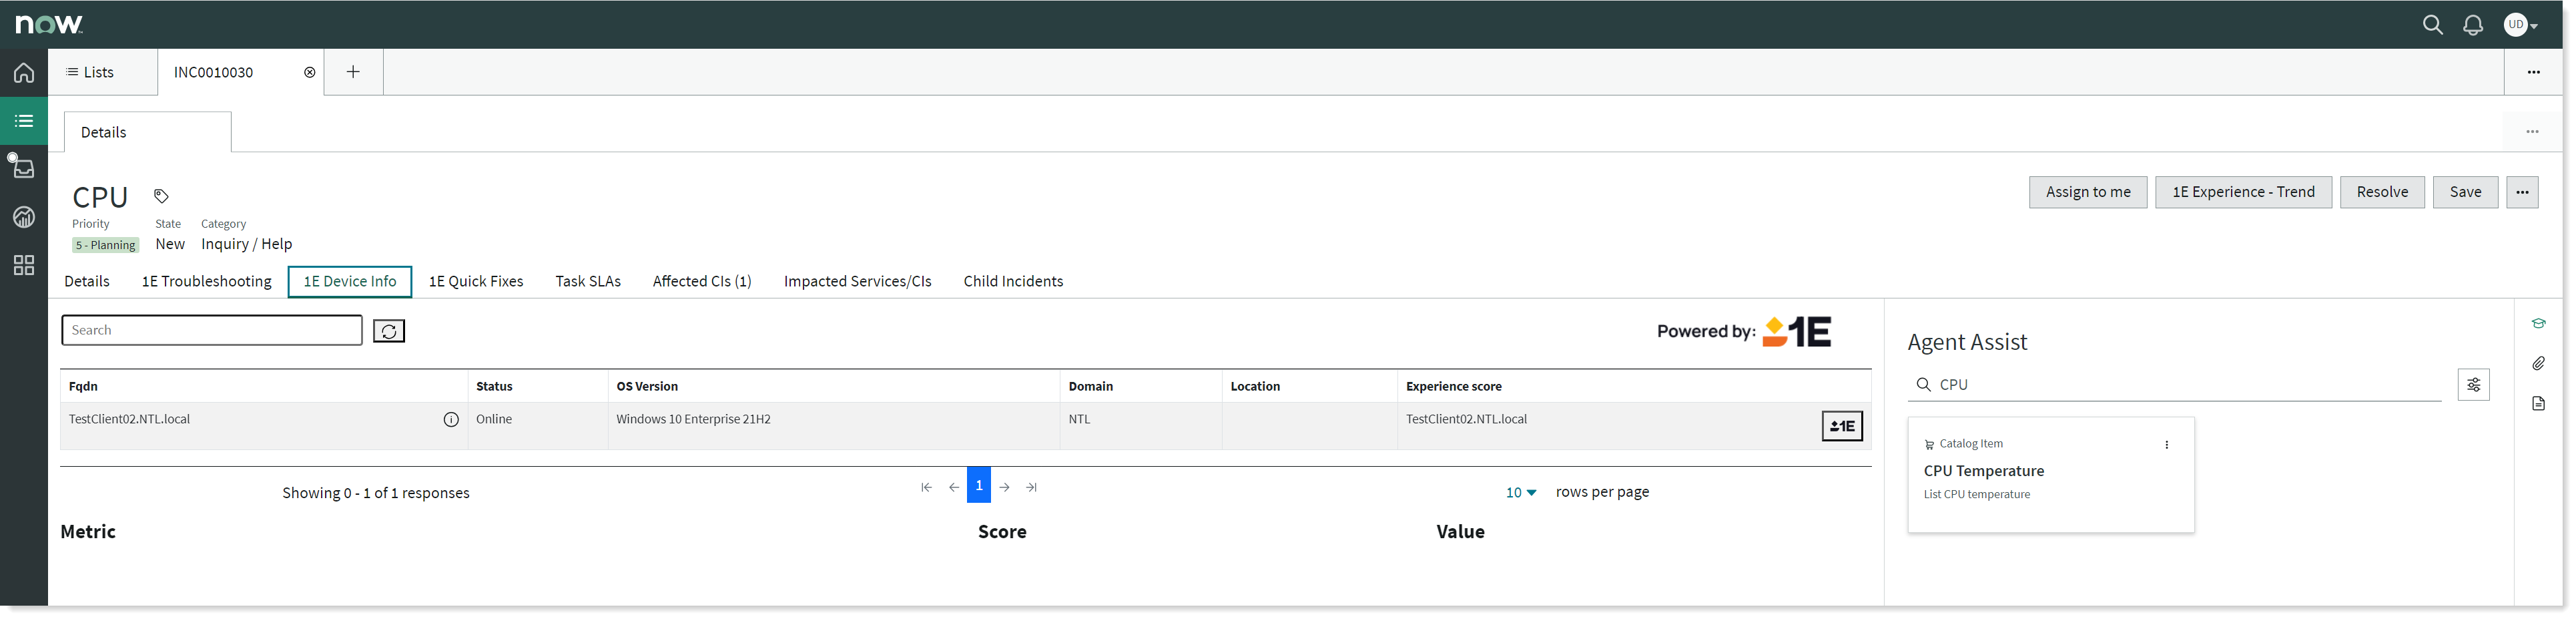
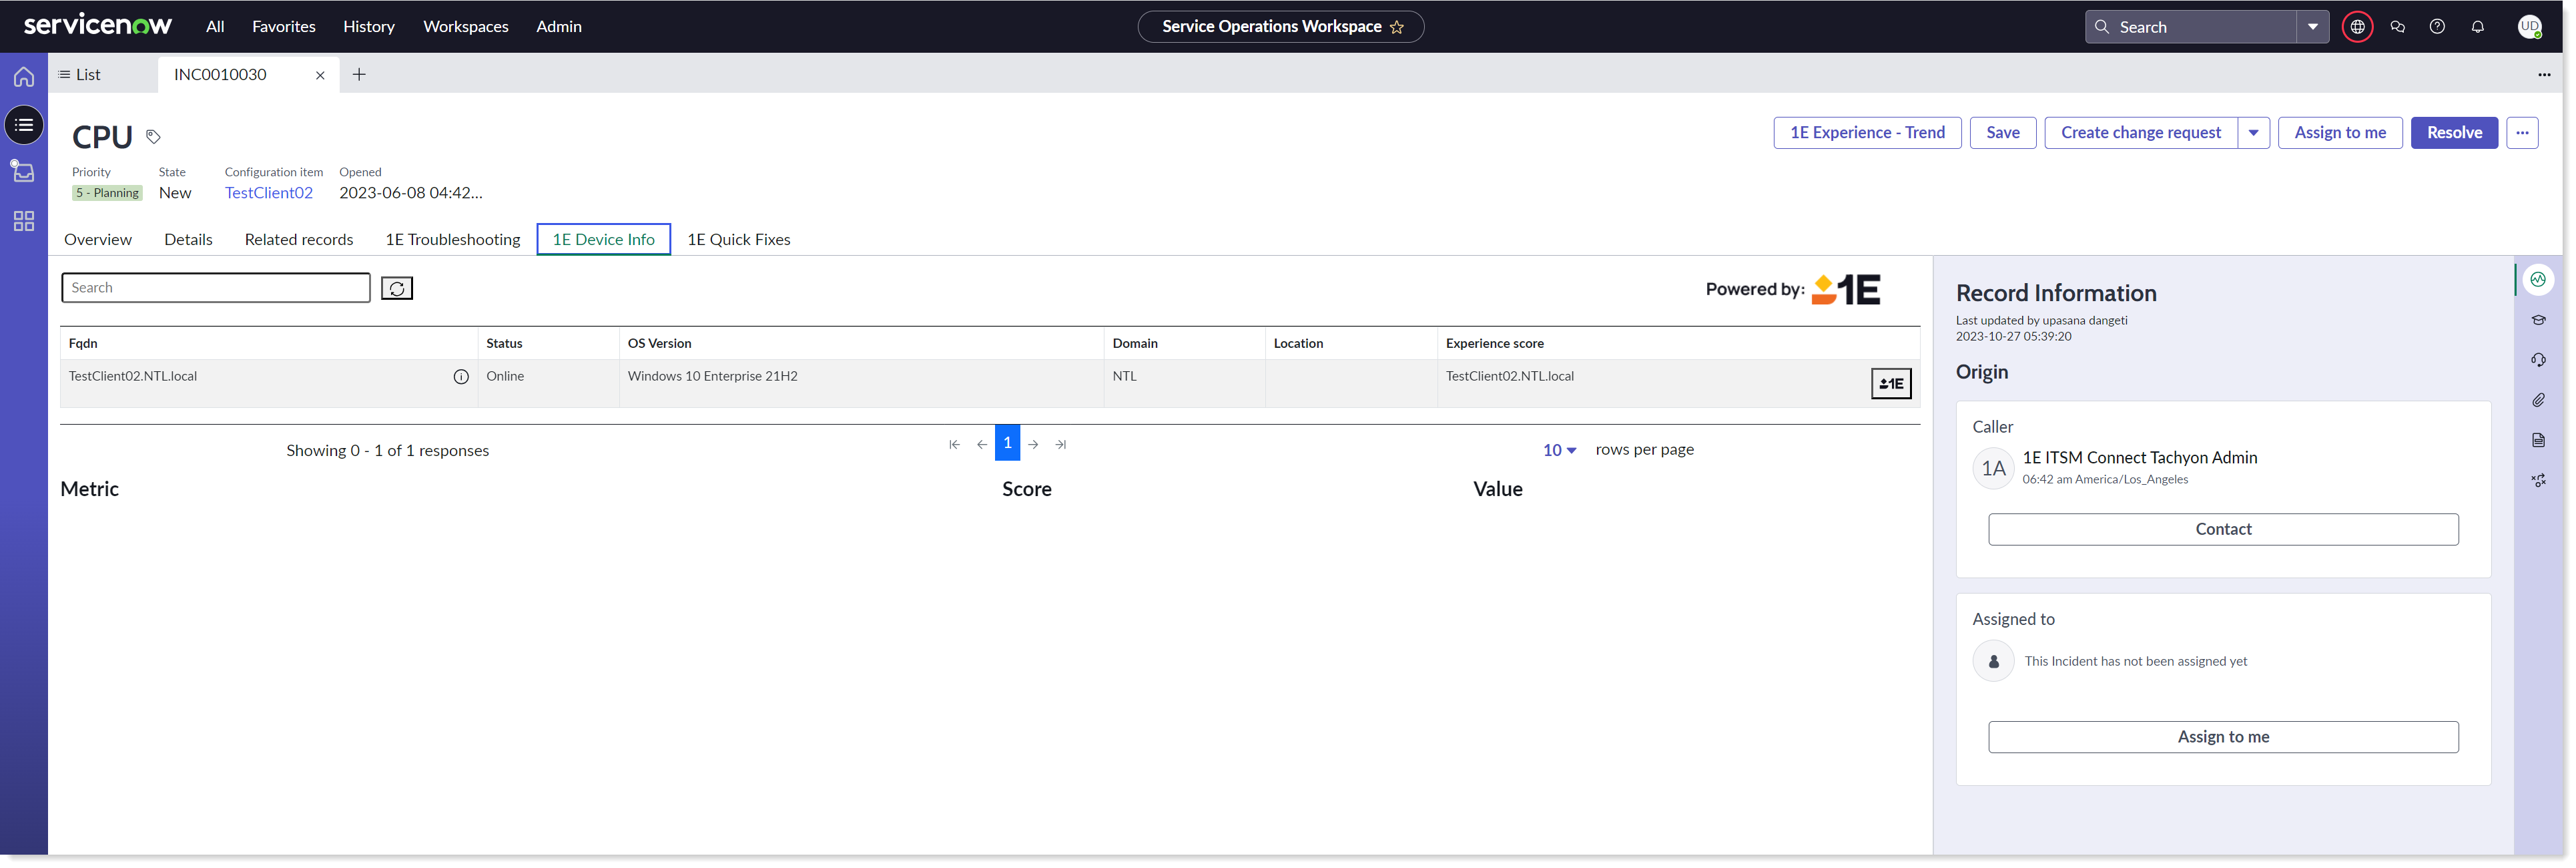
Click on the 1E Device Info tab. It will display the list of all the devices those have Fqdn and are from valid CI class as shown in the picture below. There is also a search box given in order to search for a specific device from the list. There is a refresh button on the right-hand side of the search box that allows you to refresh the data in the list. The information icon
 given against each device will navigate you to that respective device record.
1E Device Info in Agent Workspace -
1E Device Info in Service Operations Workspace for an Incident -
1E Device Info in Service Operations Workspace for an Interaction -
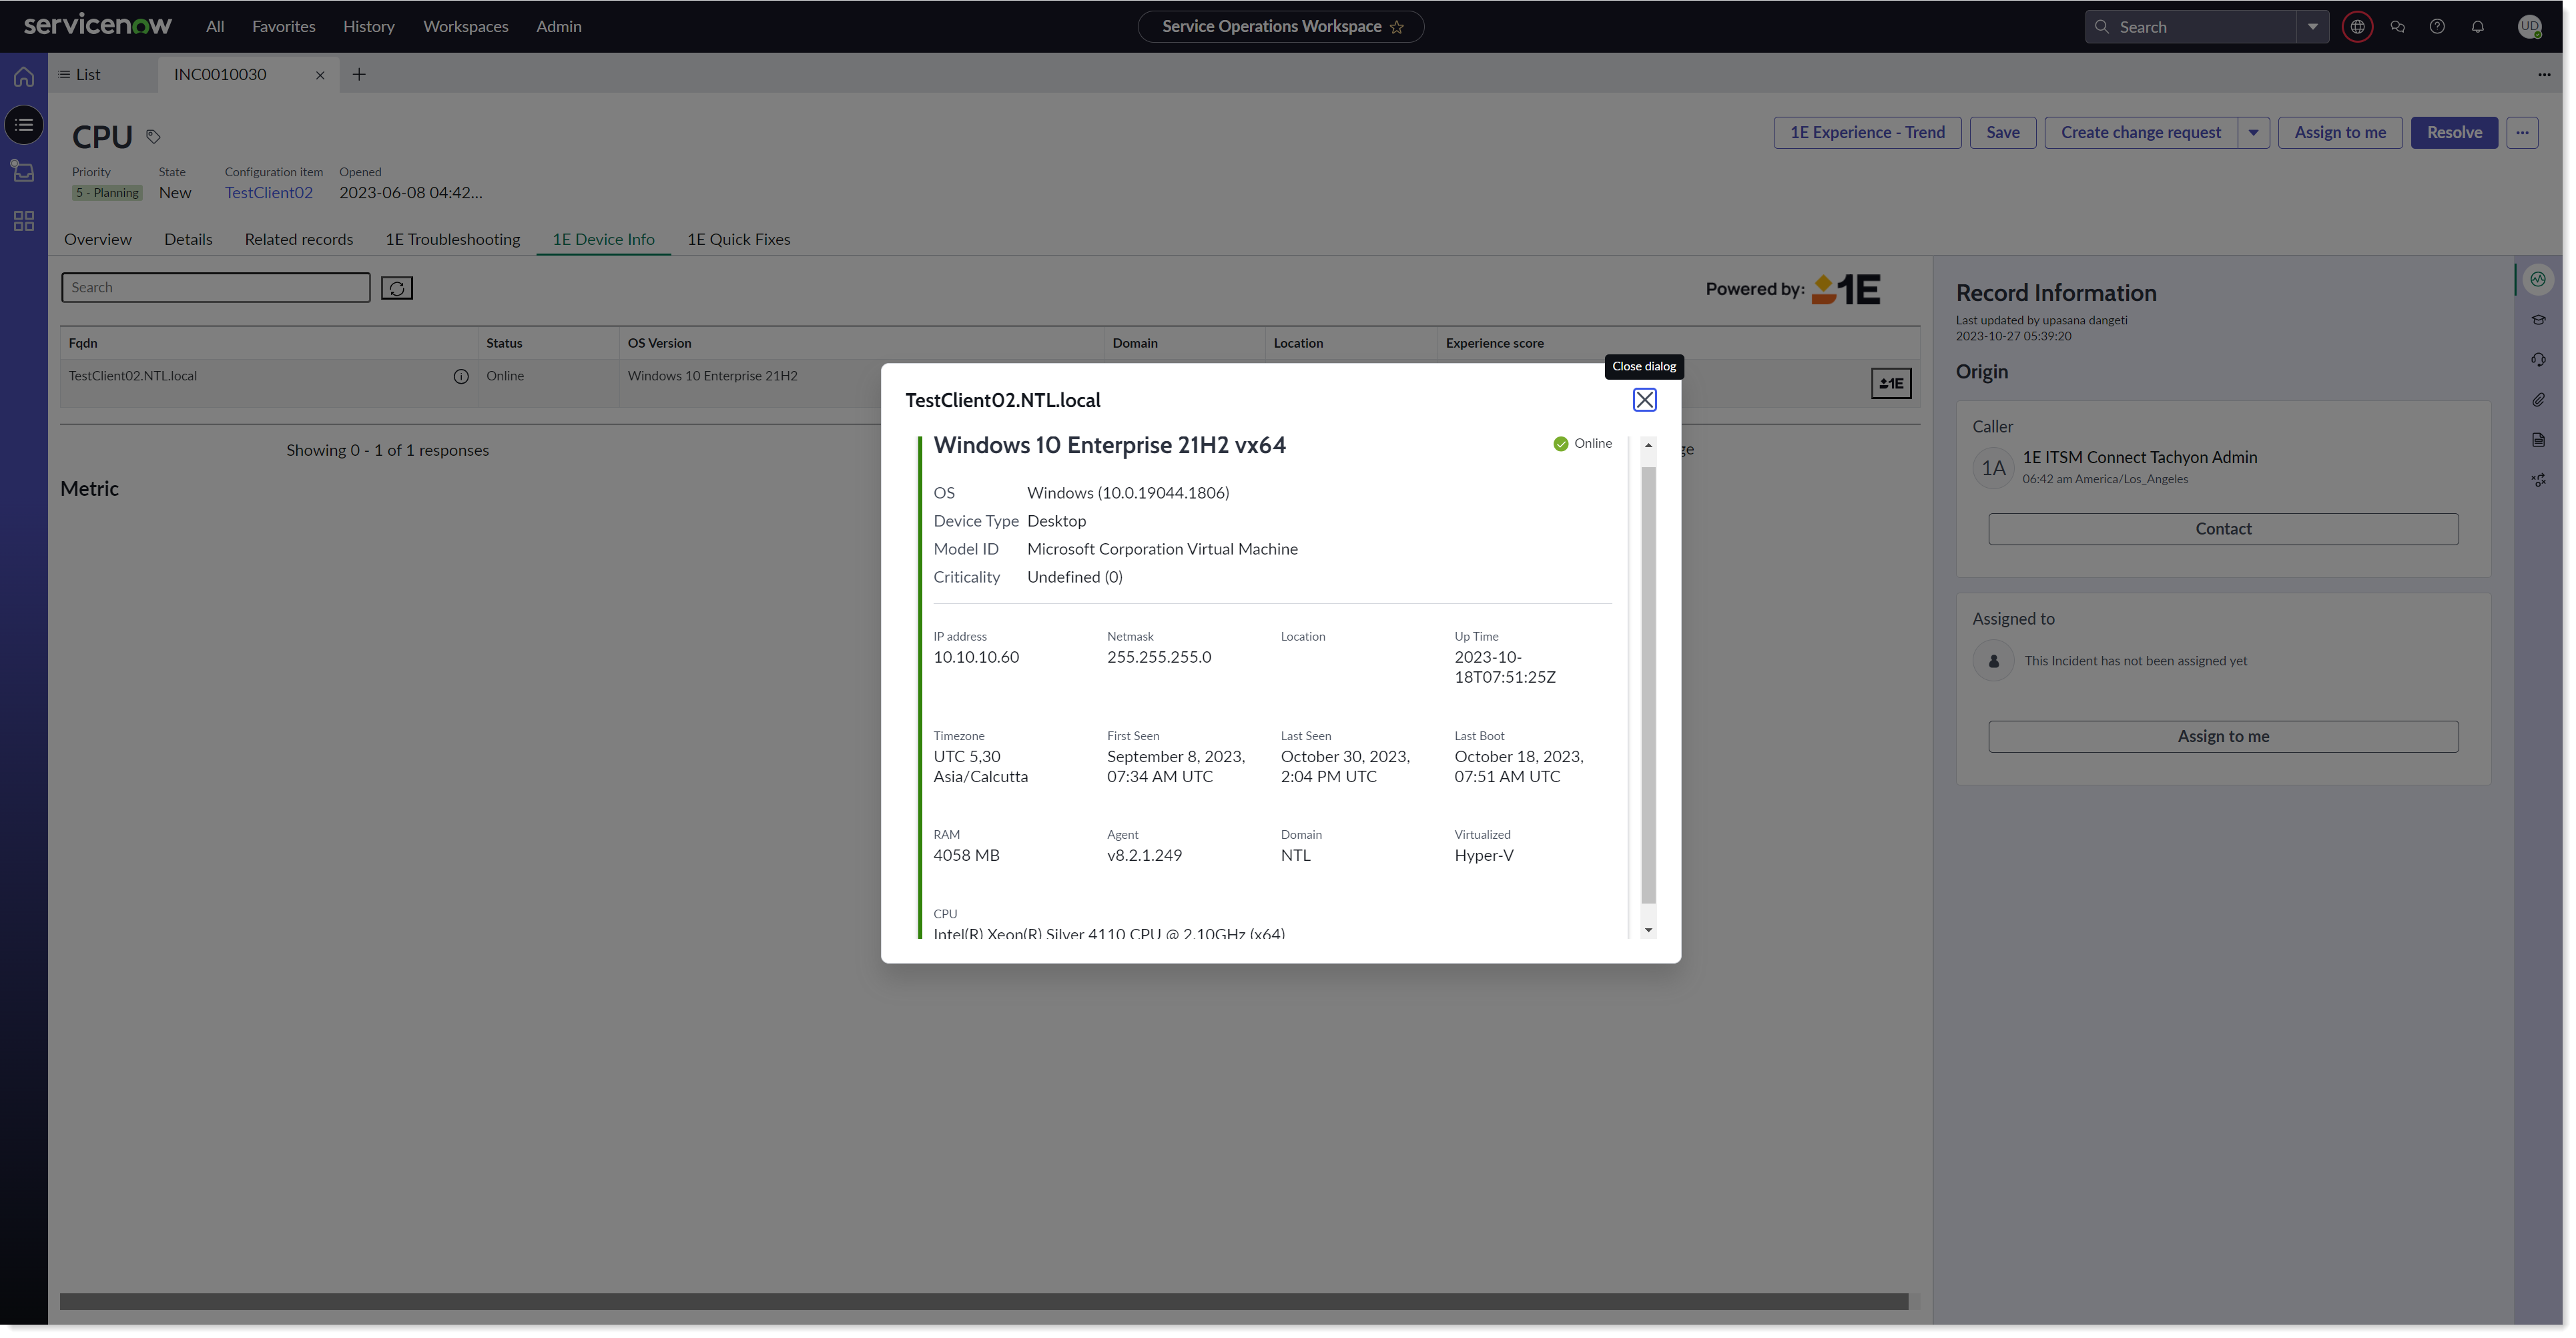
Click on any of the fields to see more details about the selected device.
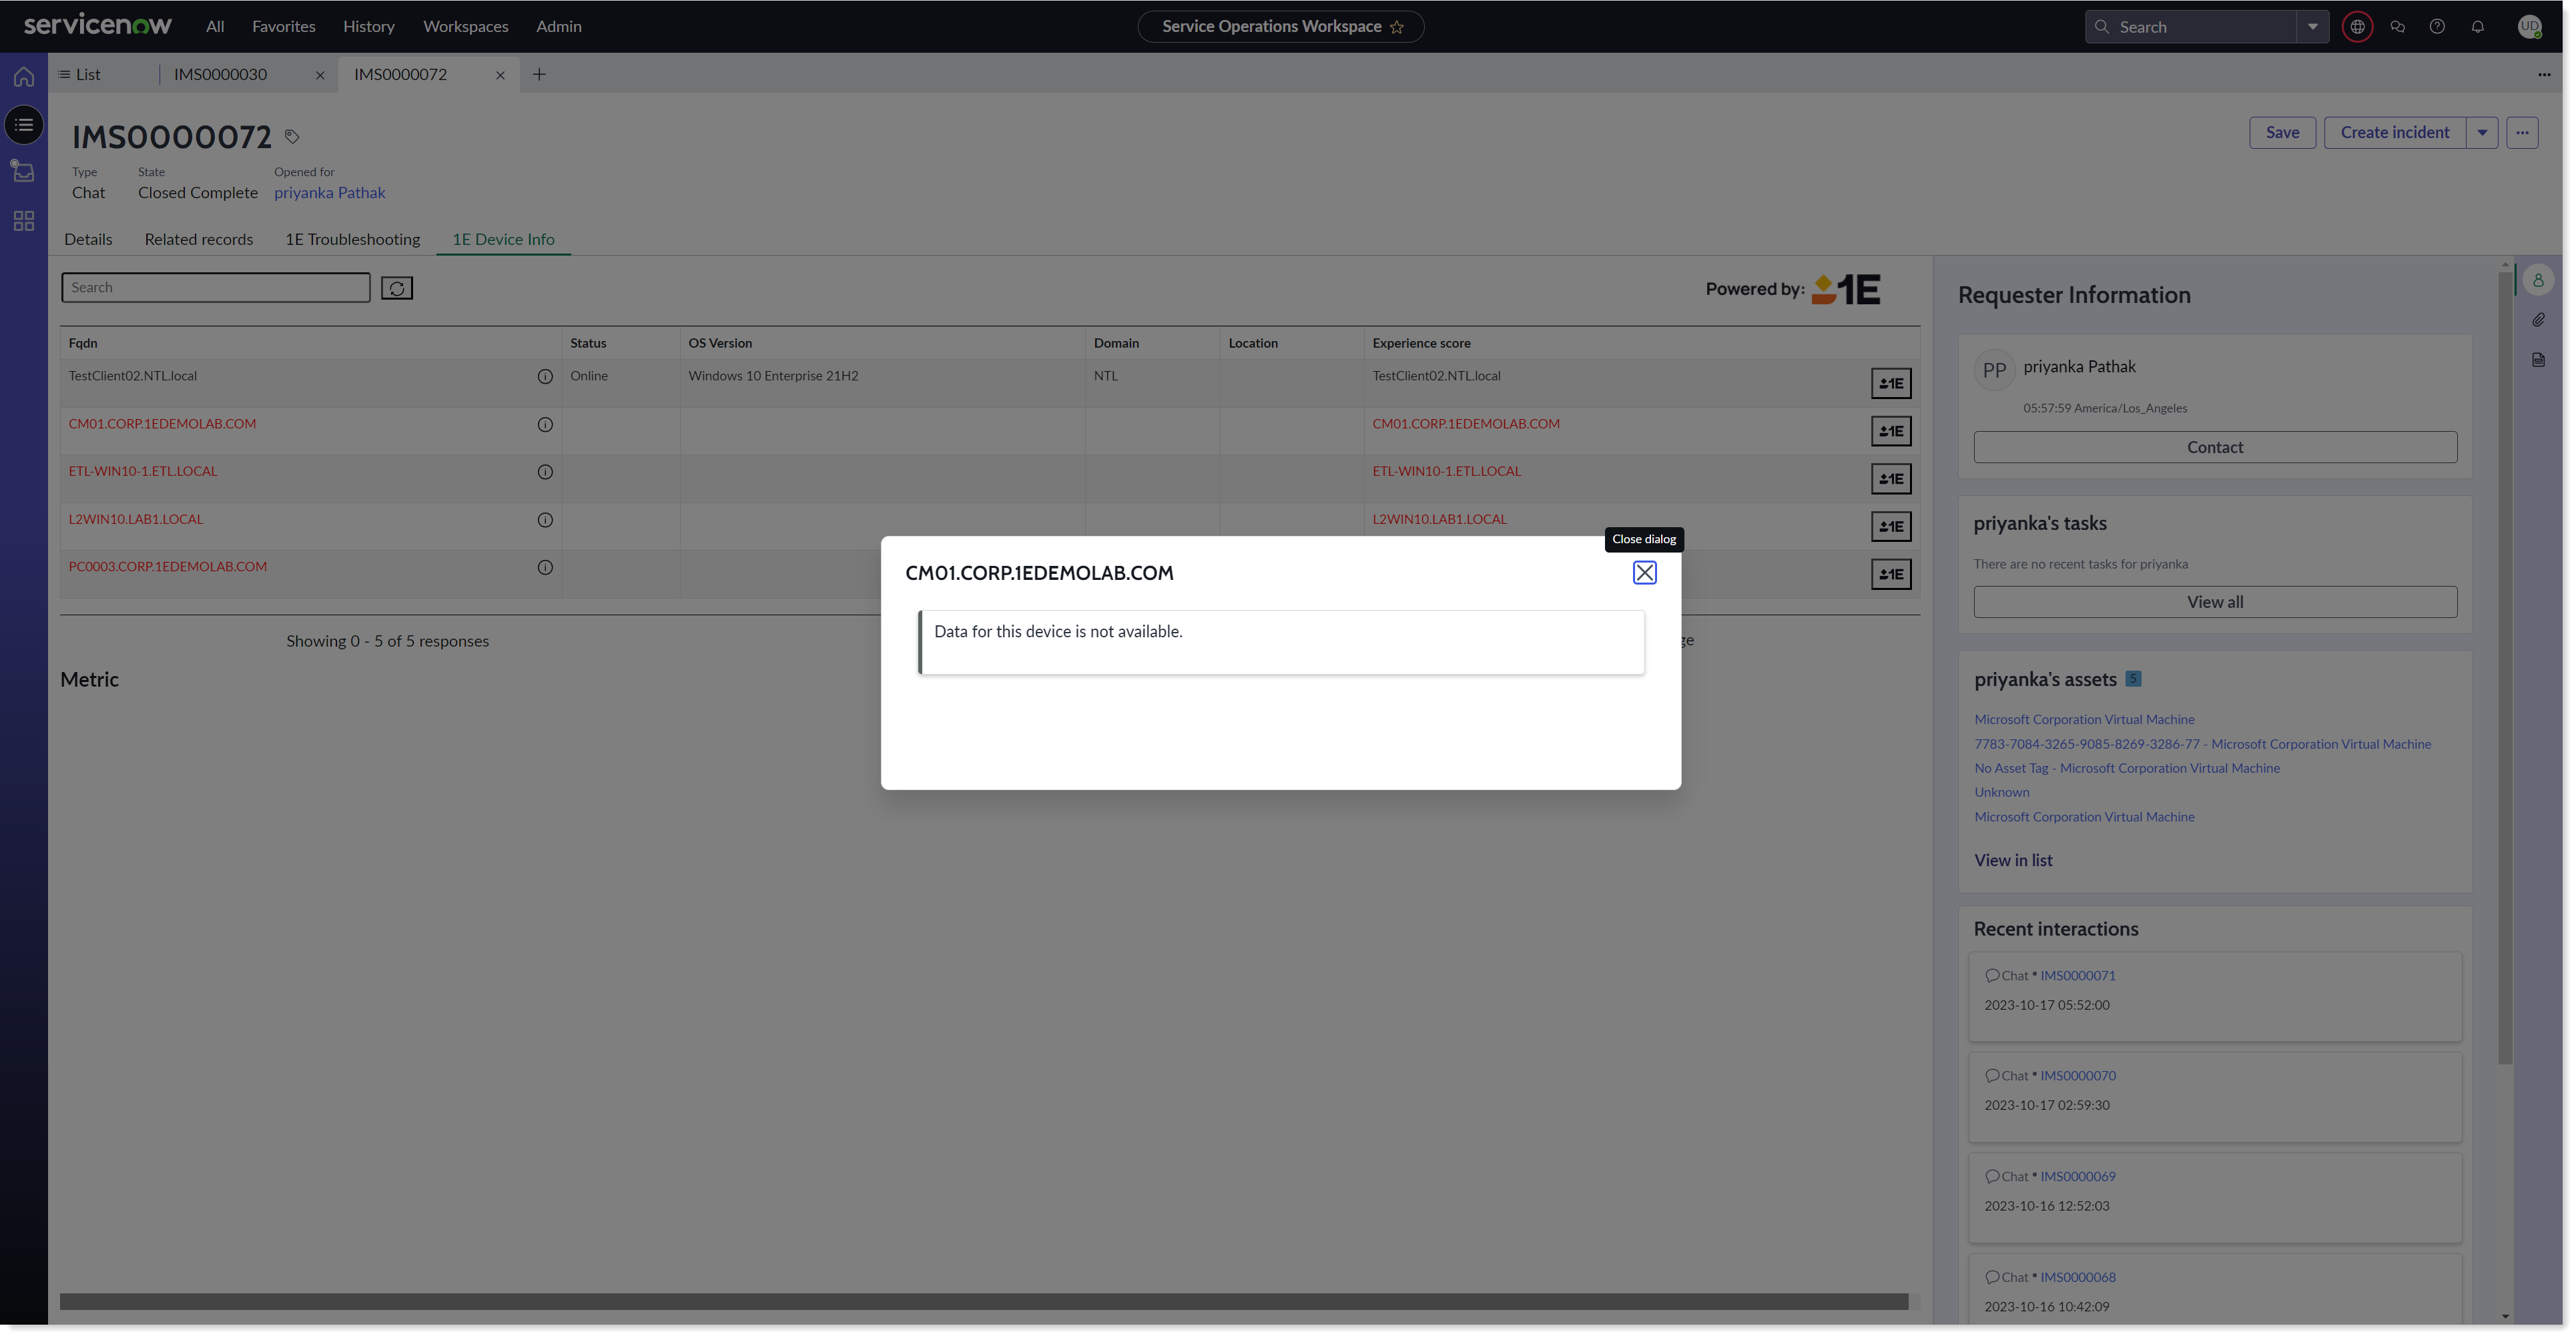
A device from the list of devices will be highlighted in red when either the Fqdn of this device is incorrect or 1E is unable to identify it, which means that there is some error while getting the data for this device from 1E.
Recommended Actions
The 1E Troubleshooting tab available under Incidents in Agent Workspace and Service Operations Workspace allows you to run 1E instructions. With the help of Recommended Actions, you can also suggest 1E instructions based on the short description provided for the incident.
An admin user can control the number of Recommended Actions displayed to the user. This value is defined under property name x_1e_connect.suggestions_count. By default, this value is 5 and if this value is zero, then Recommended Actions will not be shown to the user.
The Recommended Actions tab is displayed only when the short description of the incident matches the intent, which is further mapped to the 1E instruction(s) in the Instruction Definition table, as shown in the picture below.
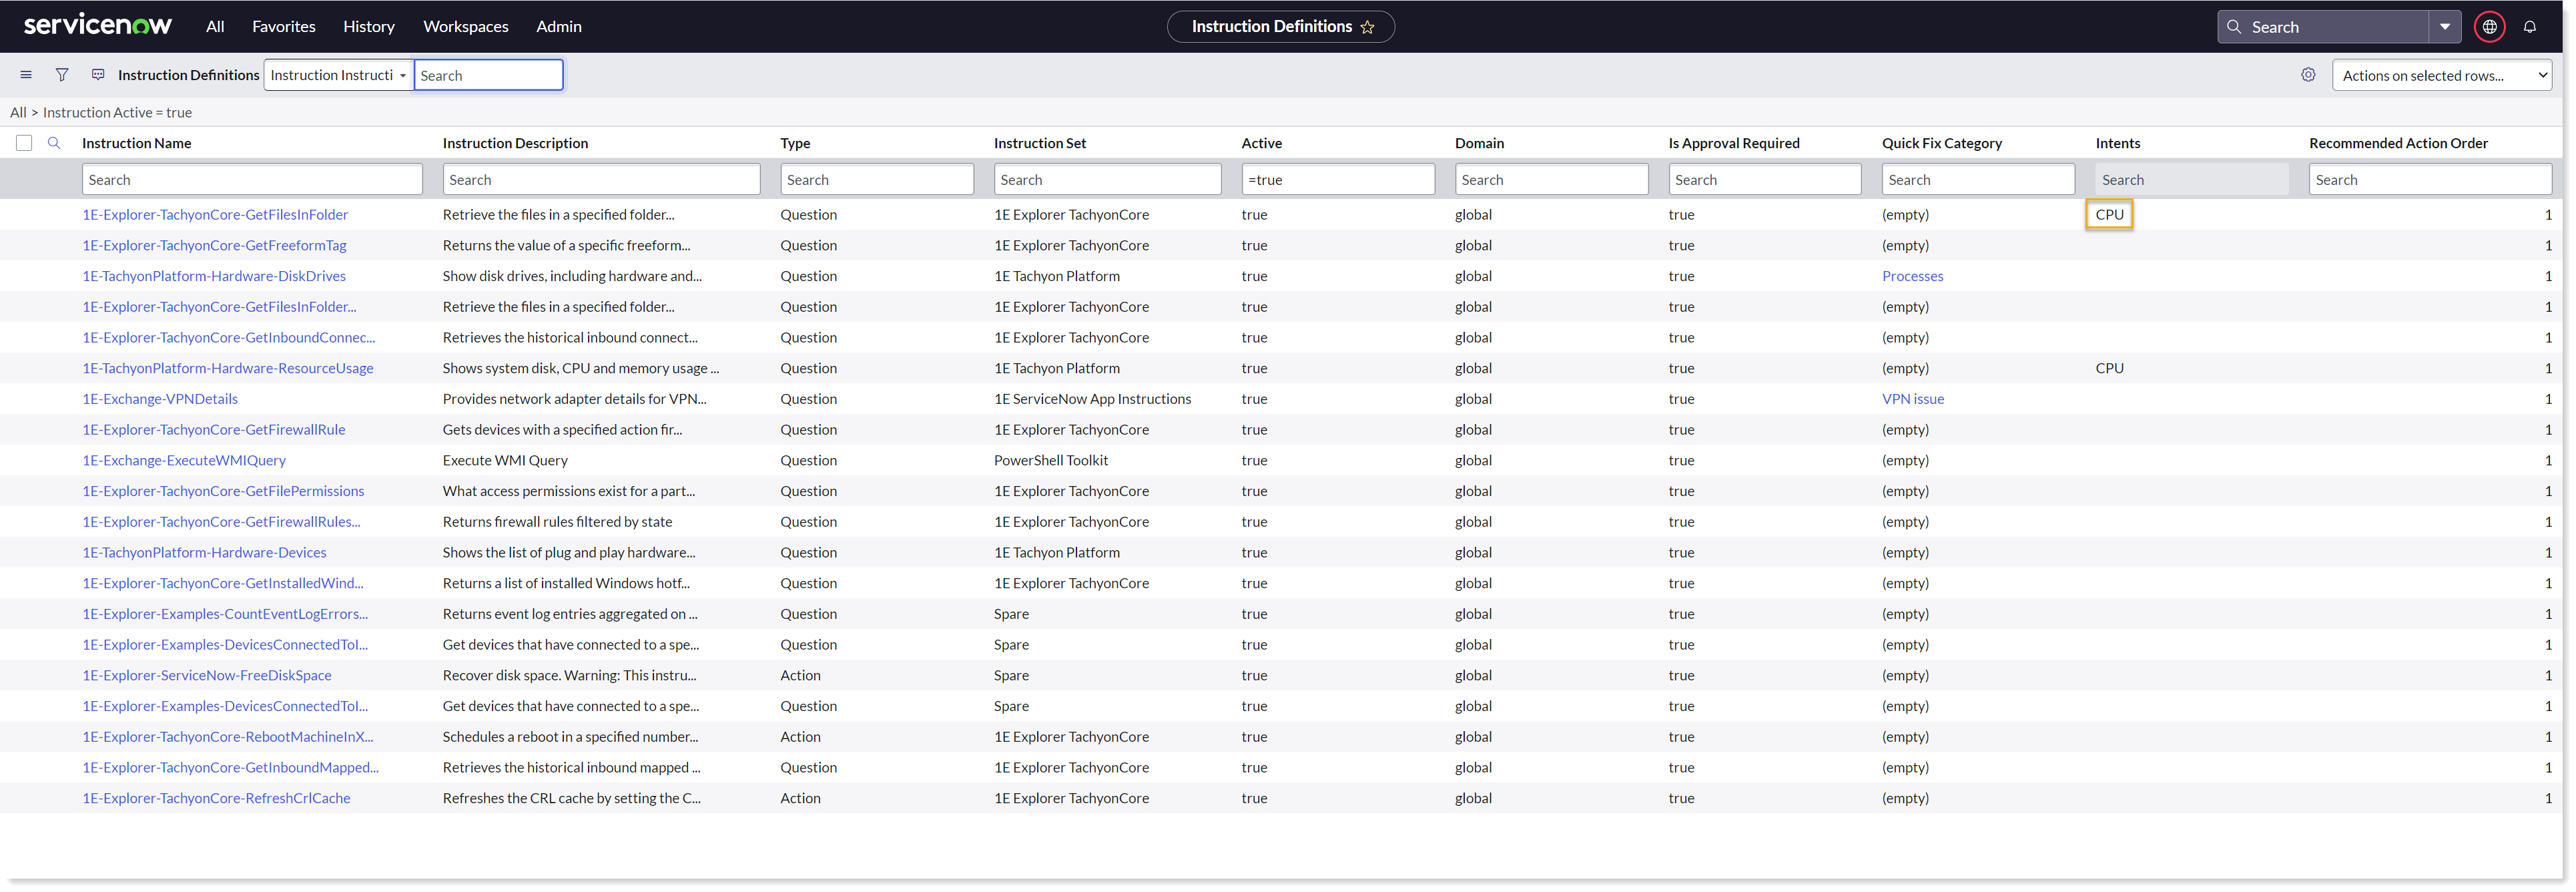
The Recommended Action Order specifies the order of the instruction suggested to the user, which means higher the value the top of the list the action is displayed. By default, this value is set to 1.
Note
1E Recommended Actions NLU model should be trained and published before using this feature.
1E Quick Fixes
1E Quick Fixes allows you to run instructions of type Questions instantly on the selected device(s).
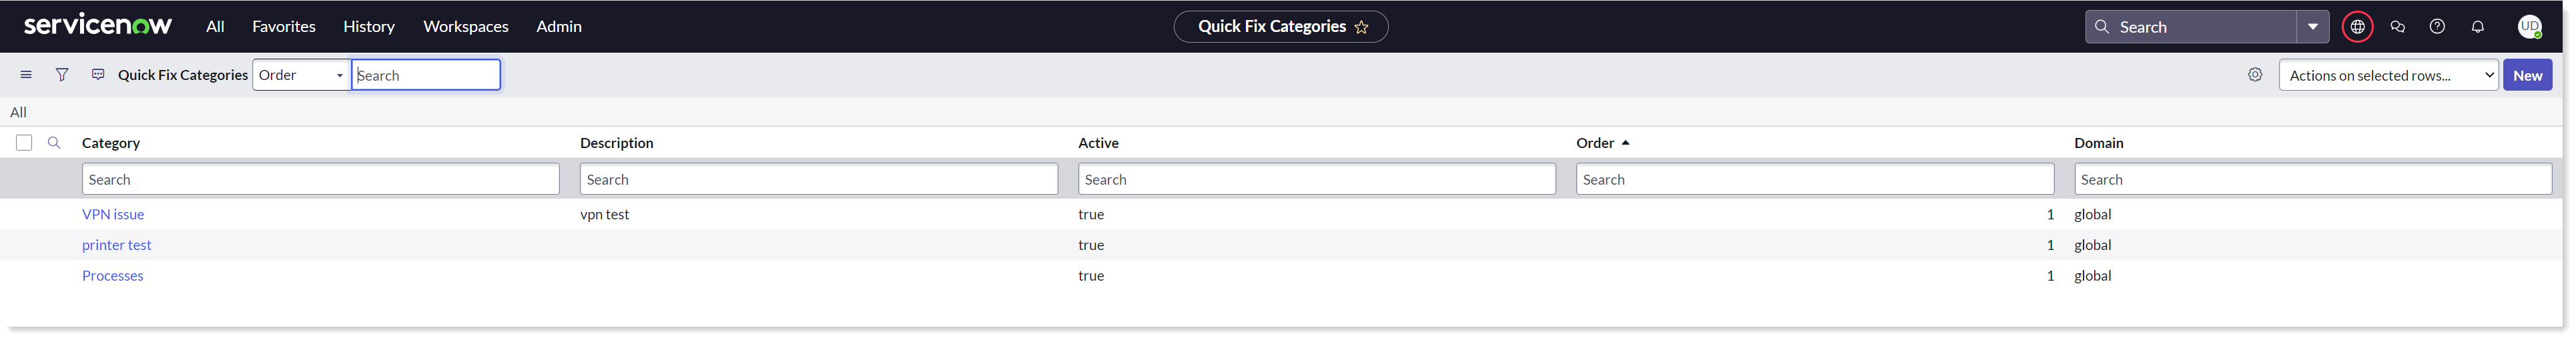
You need to first create quick fix categories manually from the Quick Fix Categories module and map them to the instructions from Instruction Definitions page.
To see the 1E Quick Fixes in Agent Workspace and Service Operations Workspace, follow the below steps:
In your workspace, select any incident from the list which you want to work on. The details of the selected incidents are now displayed in a new tab.
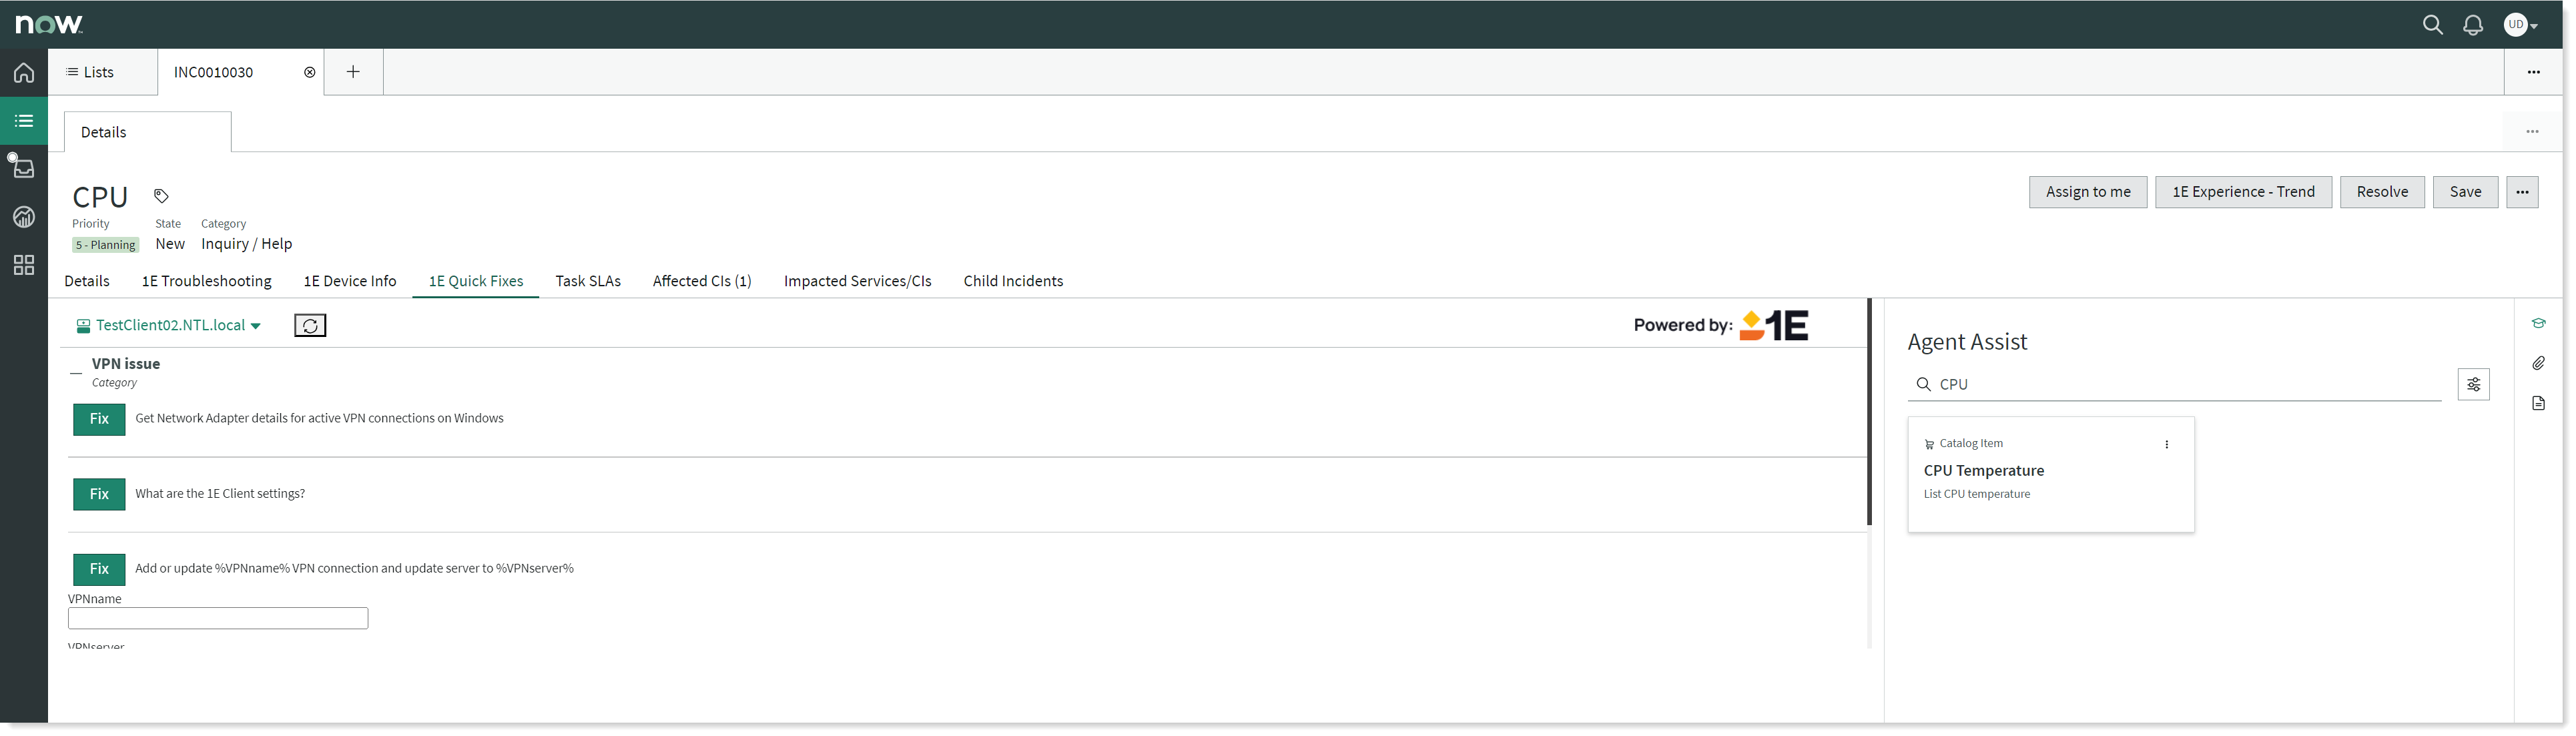
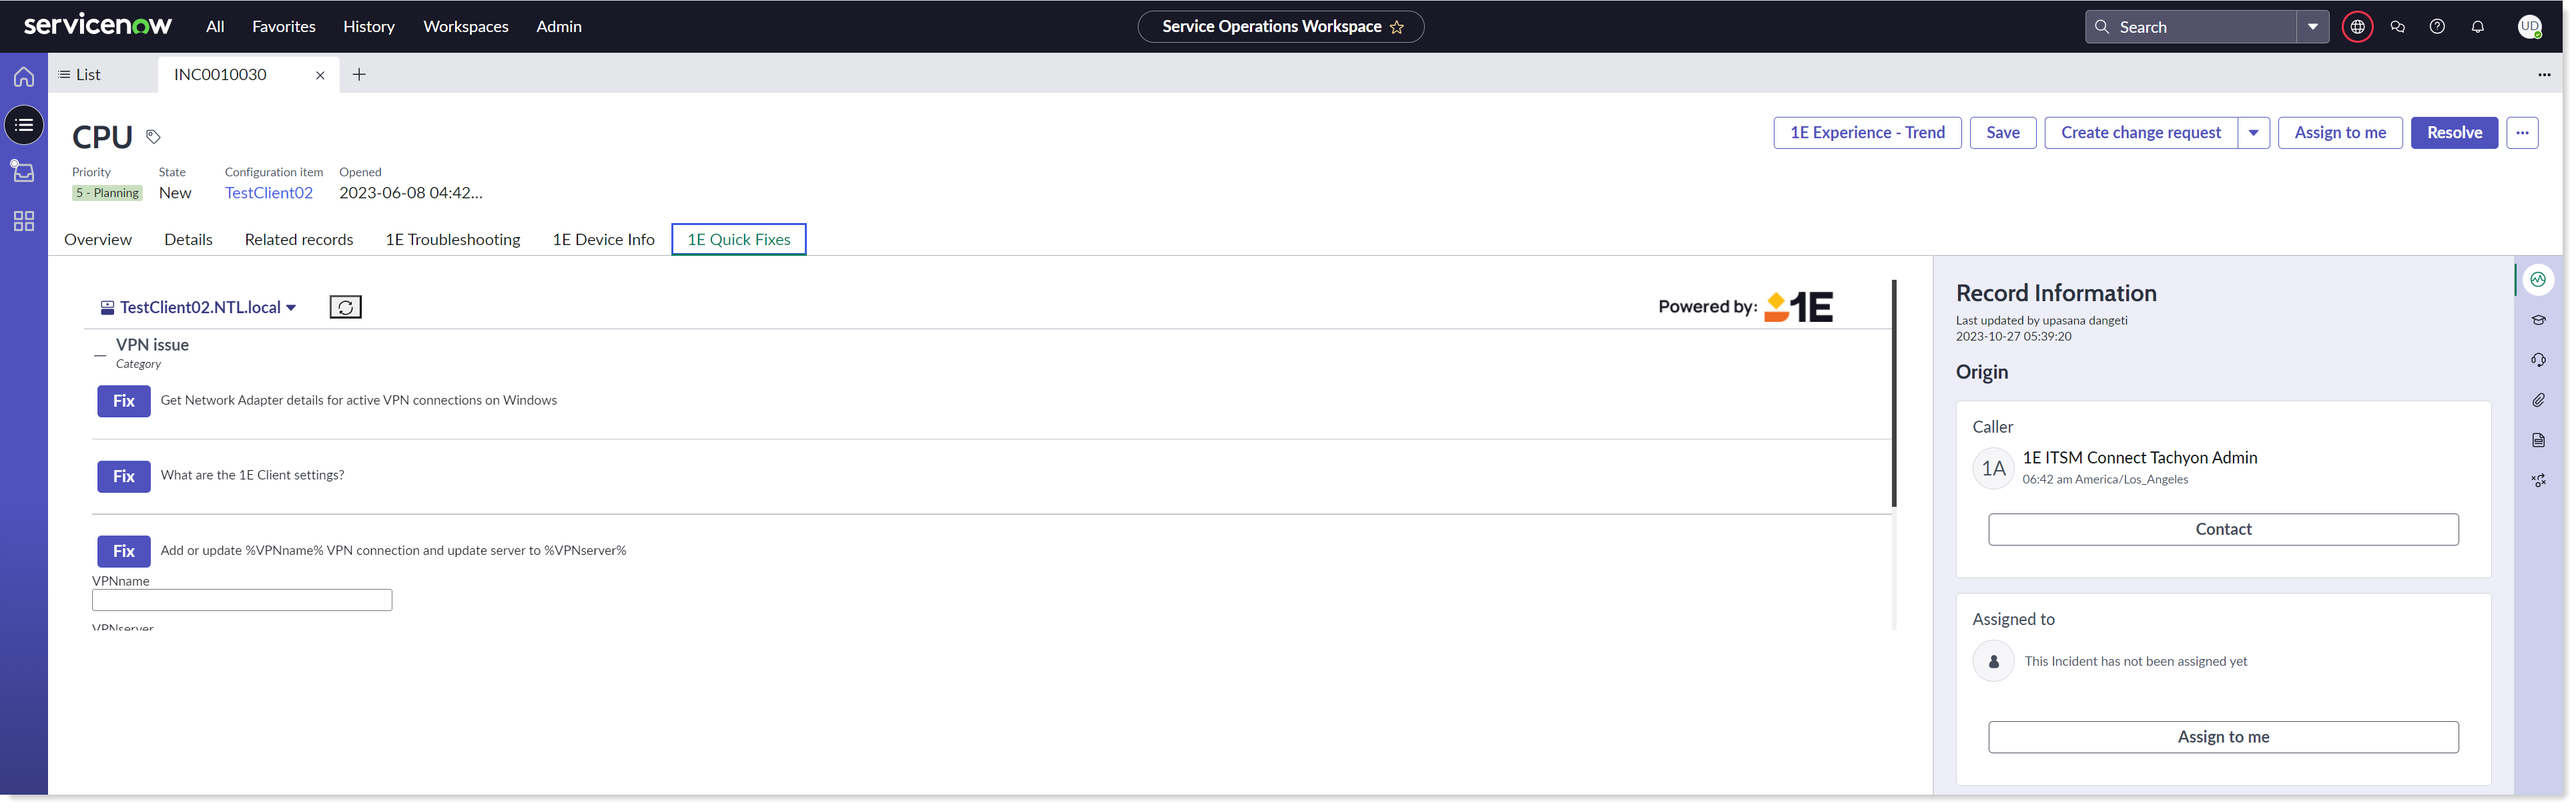
Click on the 1E Quick Fixes tab. It will display the list of instructions that can be run, as shown in the picture below. Select the device(s) from the dropdown on which you want to run the instruction and click on Fix button to run the instruction. Note that it also supports the parameterized instructions.
Select the device(s) from the dropdown on which you want to run the instruction and click on Fix button to run the instruction.
Agent Workspace -
Service Operations Workspace -
You can check the status of the quick fix executed by clicking on the Check Status link that pops up after 5 seconds of the instruction execution. It will take you to the Instruction History table as shown below.
Now verify the status of the latest triggered instruction by opening the respective record. Click on View Responses button to see the 1E responses received. You can also attach the responses to the selected incident by clicking on the Attach Response button.