Dashboard
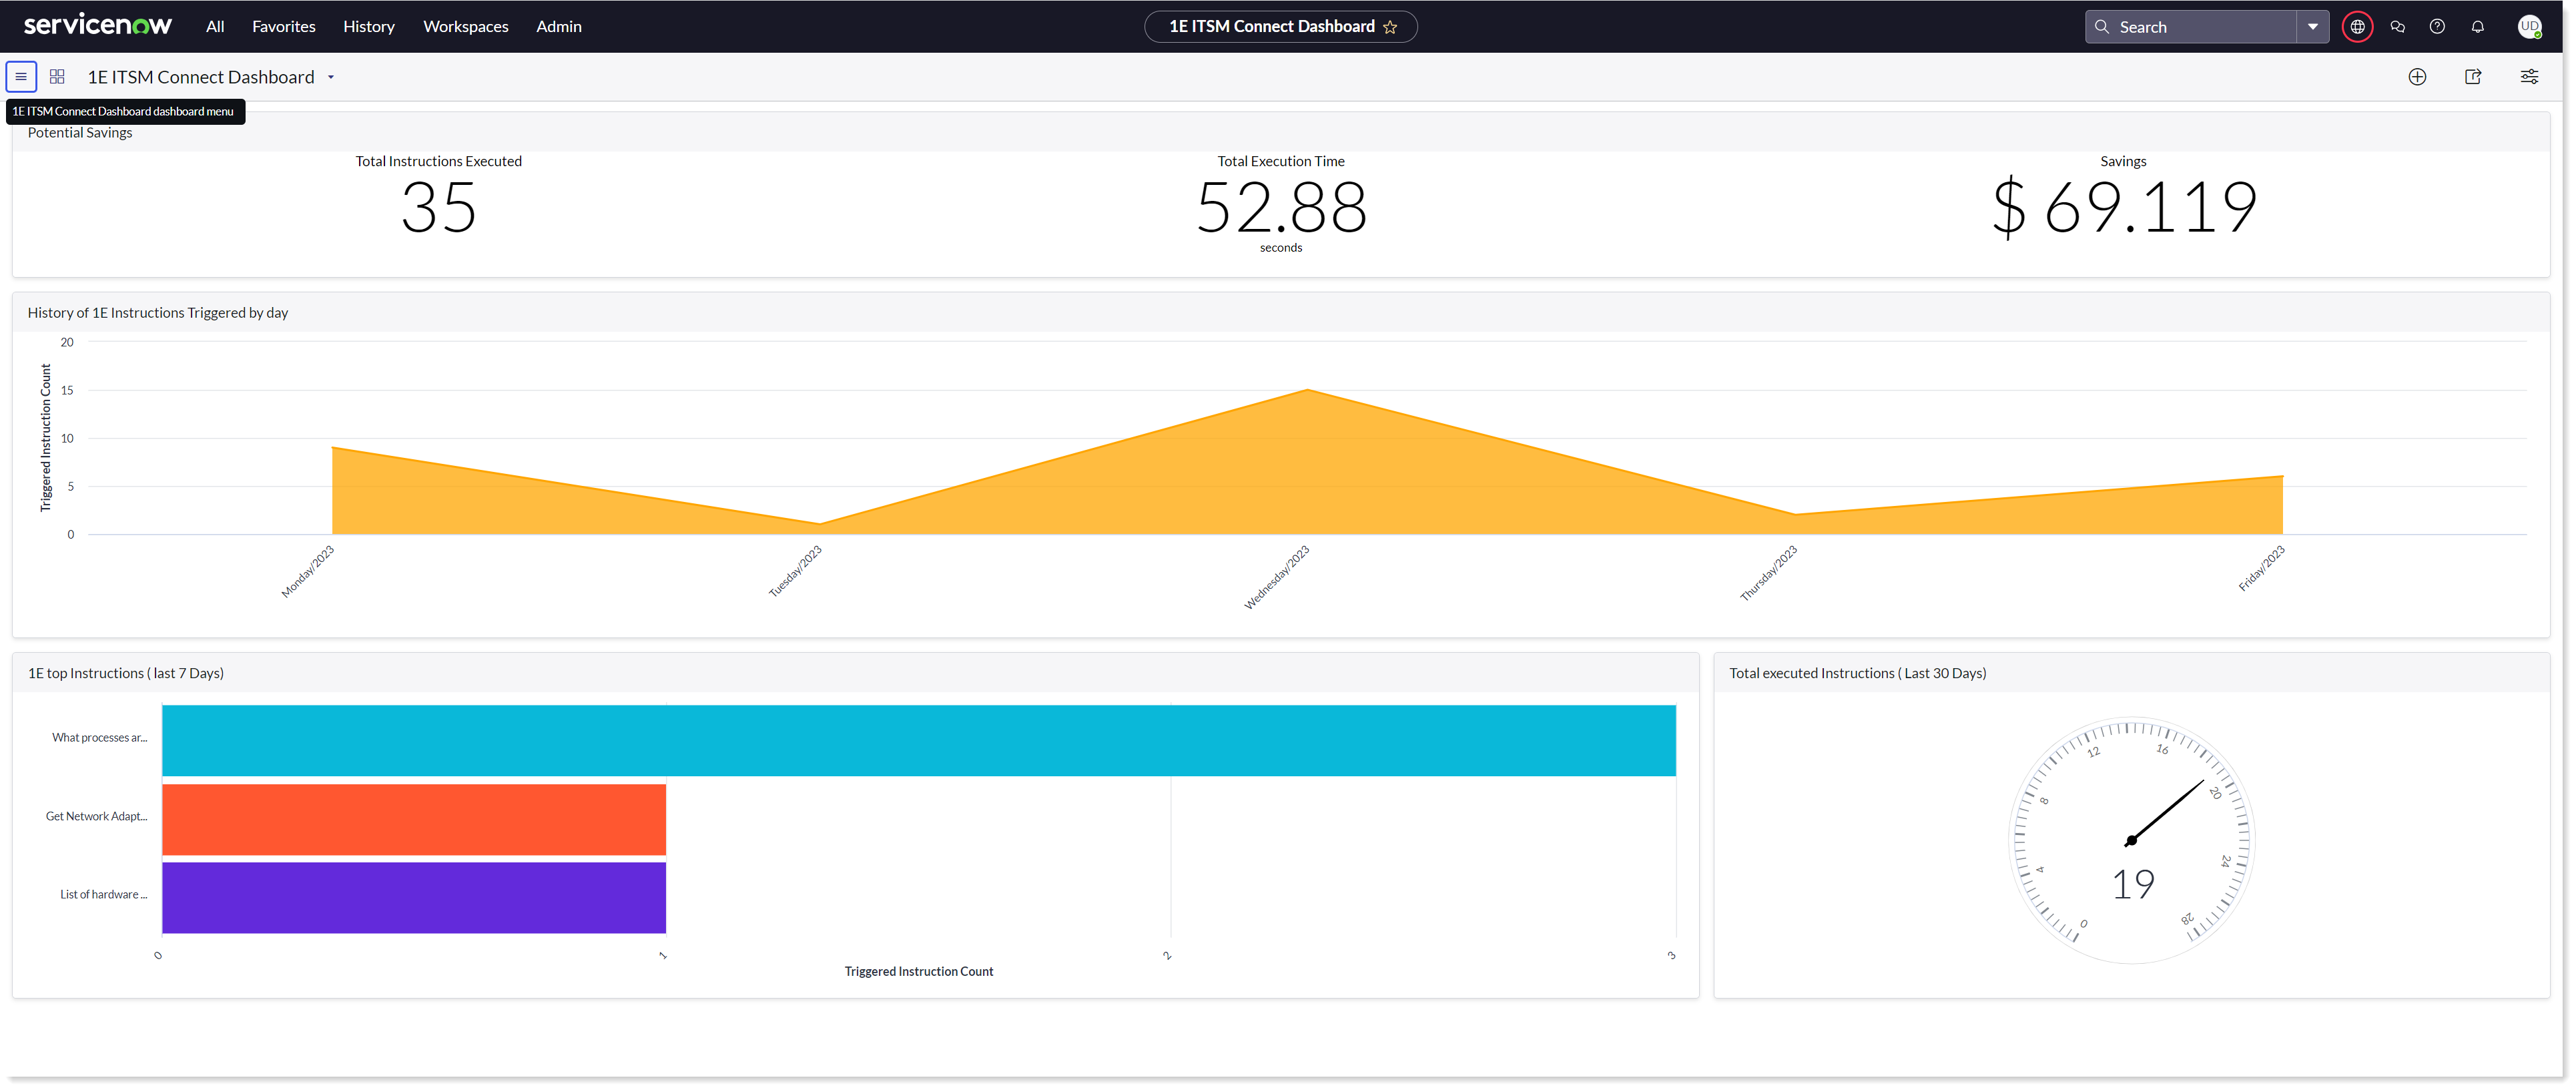
The 1E ITSM Connect Dashboard visualizes the pre-configured reports. You can navigate via 1E ITSM Connect → Dashboard to view Dashboard. There are four reports available on the Dashboard, as shown in the picture below.
Fields | Description |
|---|---|
Potential Savings | The Potential Savings widget on 1E ITSM Connect Dashboard allows both 1E admin and 1E user to visualize the savings incurred from triggered instructions. Each triggered instruction with the status marked as Completed counts for calculating the Potential Savings. For the Potential Savings to reflect in the widget, a record in the ROI Configurations (x_1e_connect_roi_configuration) table must be created first. |
History of 1E Instructions triggered by day | This section visualizes the total count of 1E instructions triggered in a day. The instruction count is given with respect to the date on which it was triggered. |
1E top Instructions (last 7 days) | This report displays the top 1E instructions that are executed in the last seven days and how many times these instructions were executed. |
Total executed Instructions (last 30 days) | This section displays the total number of 1E instructions executed in the last 30 days. |