Device Information and Experience scores
1E ITSM Connect lets you view the device information and Experience scores from 1E.
Device Info View
Online/Offline status of device
Experience Scores
Remediation options
Instructions UI refresh.
Device Information
Device Information in Native UI
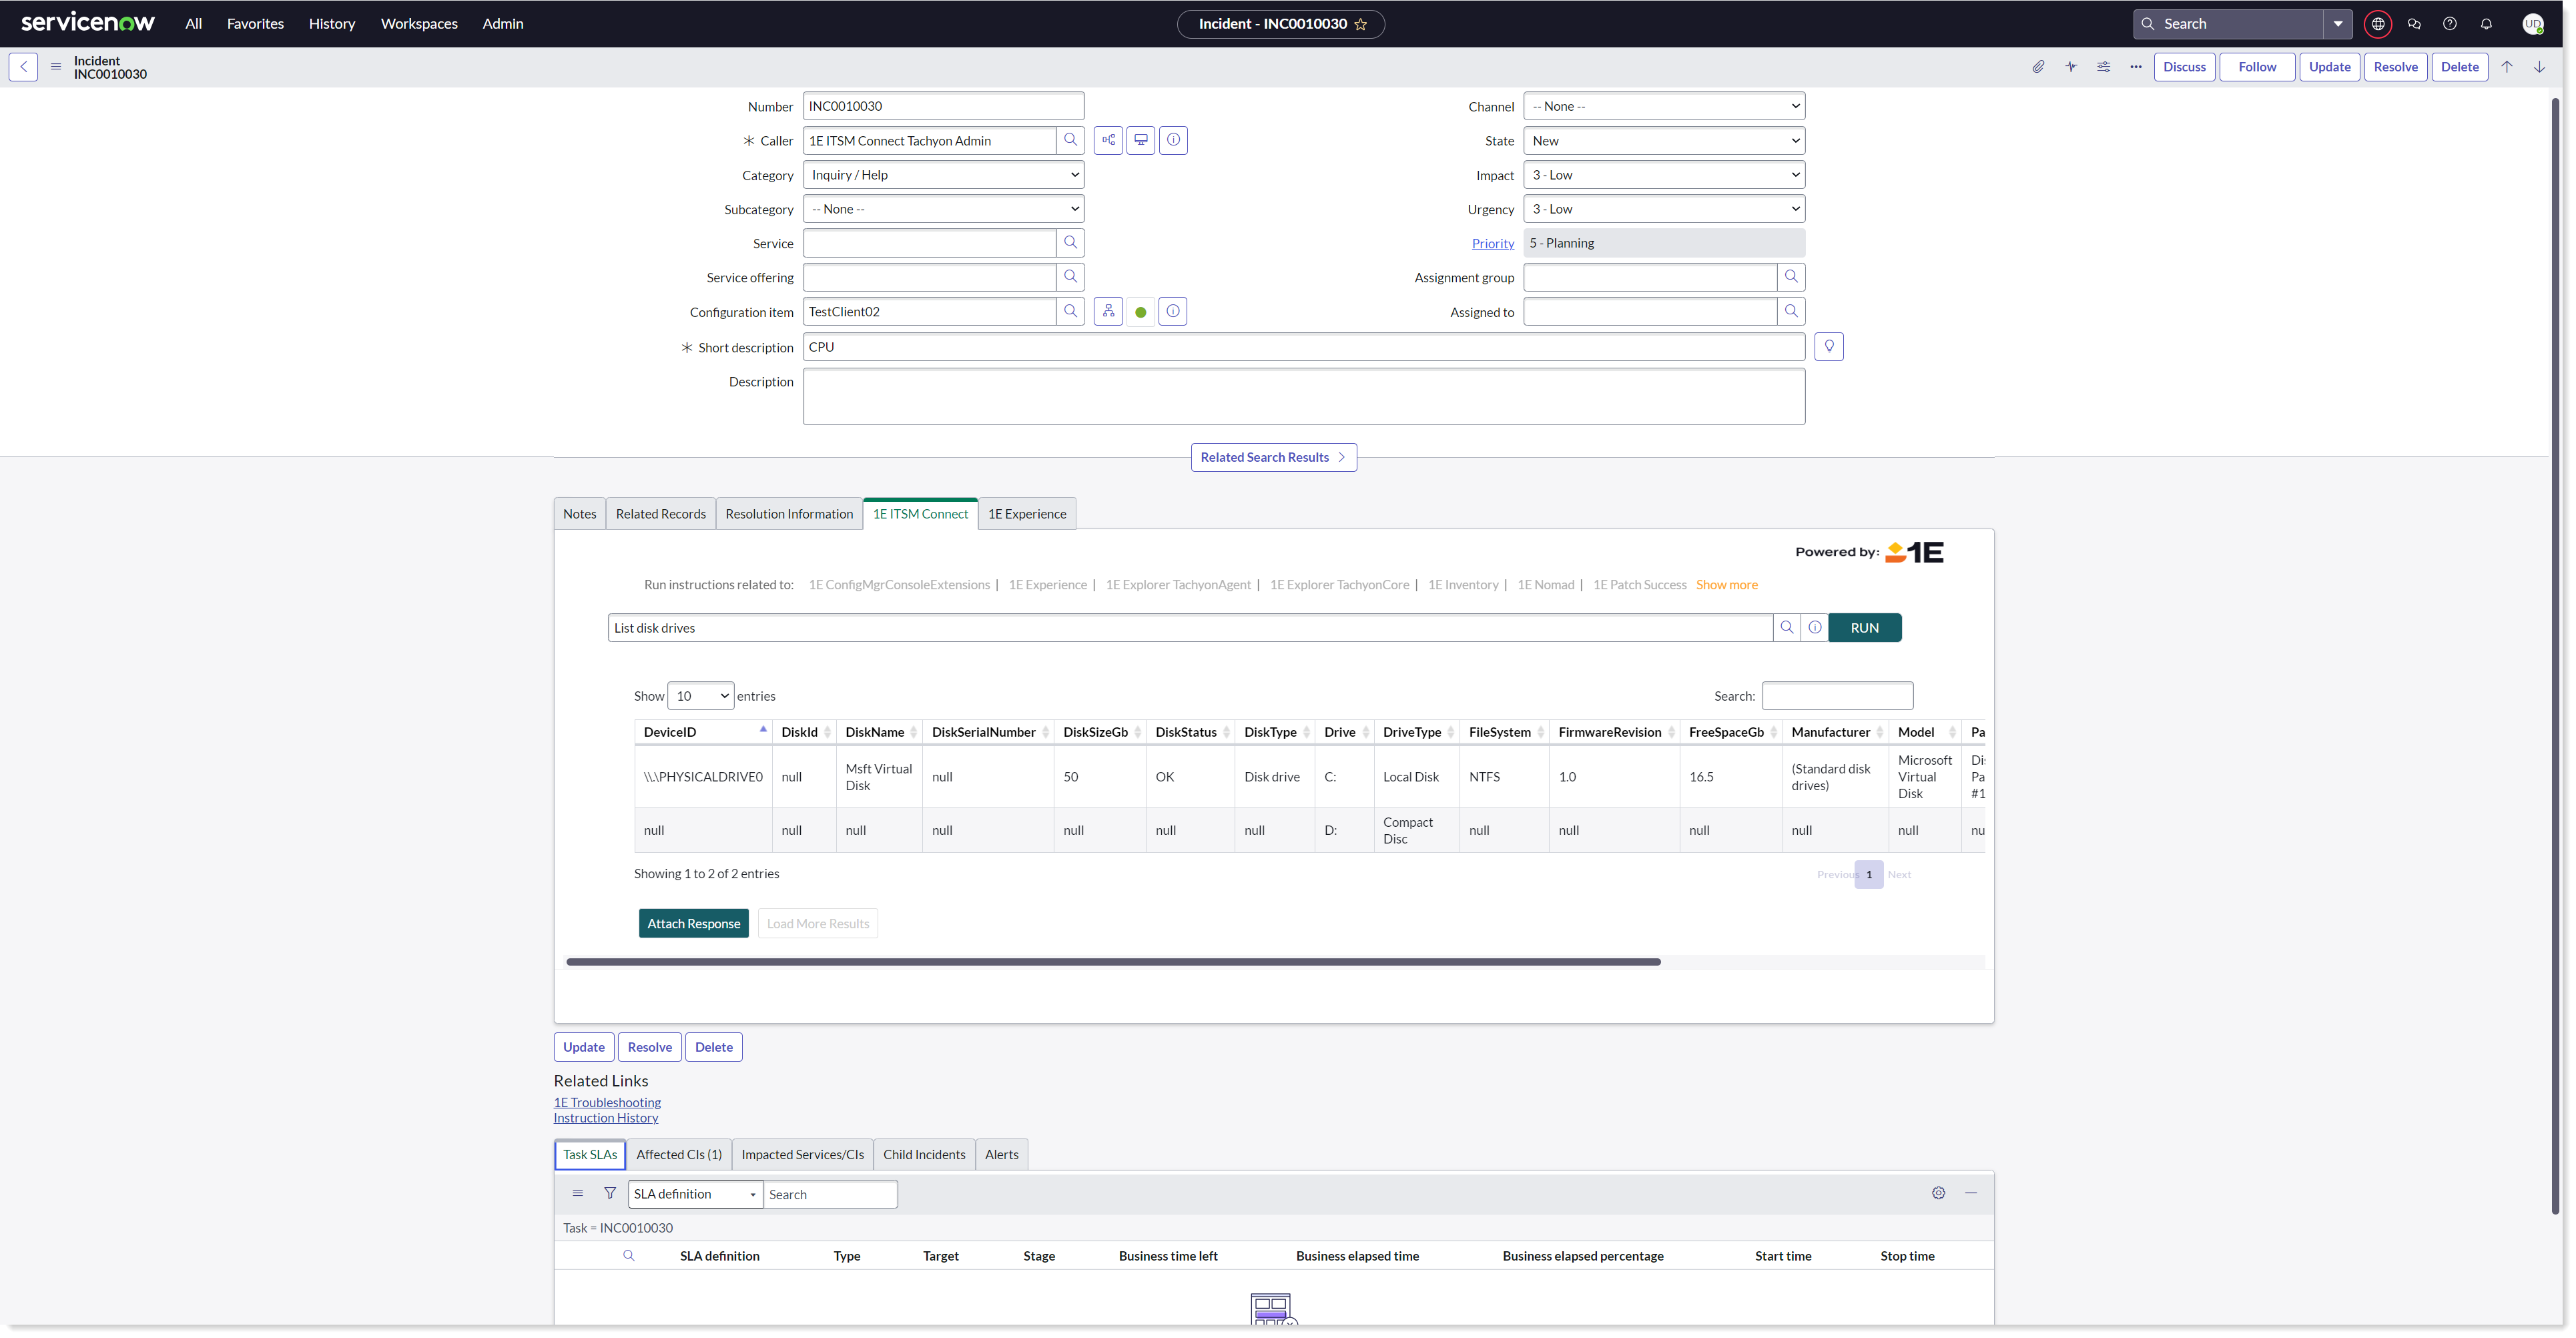
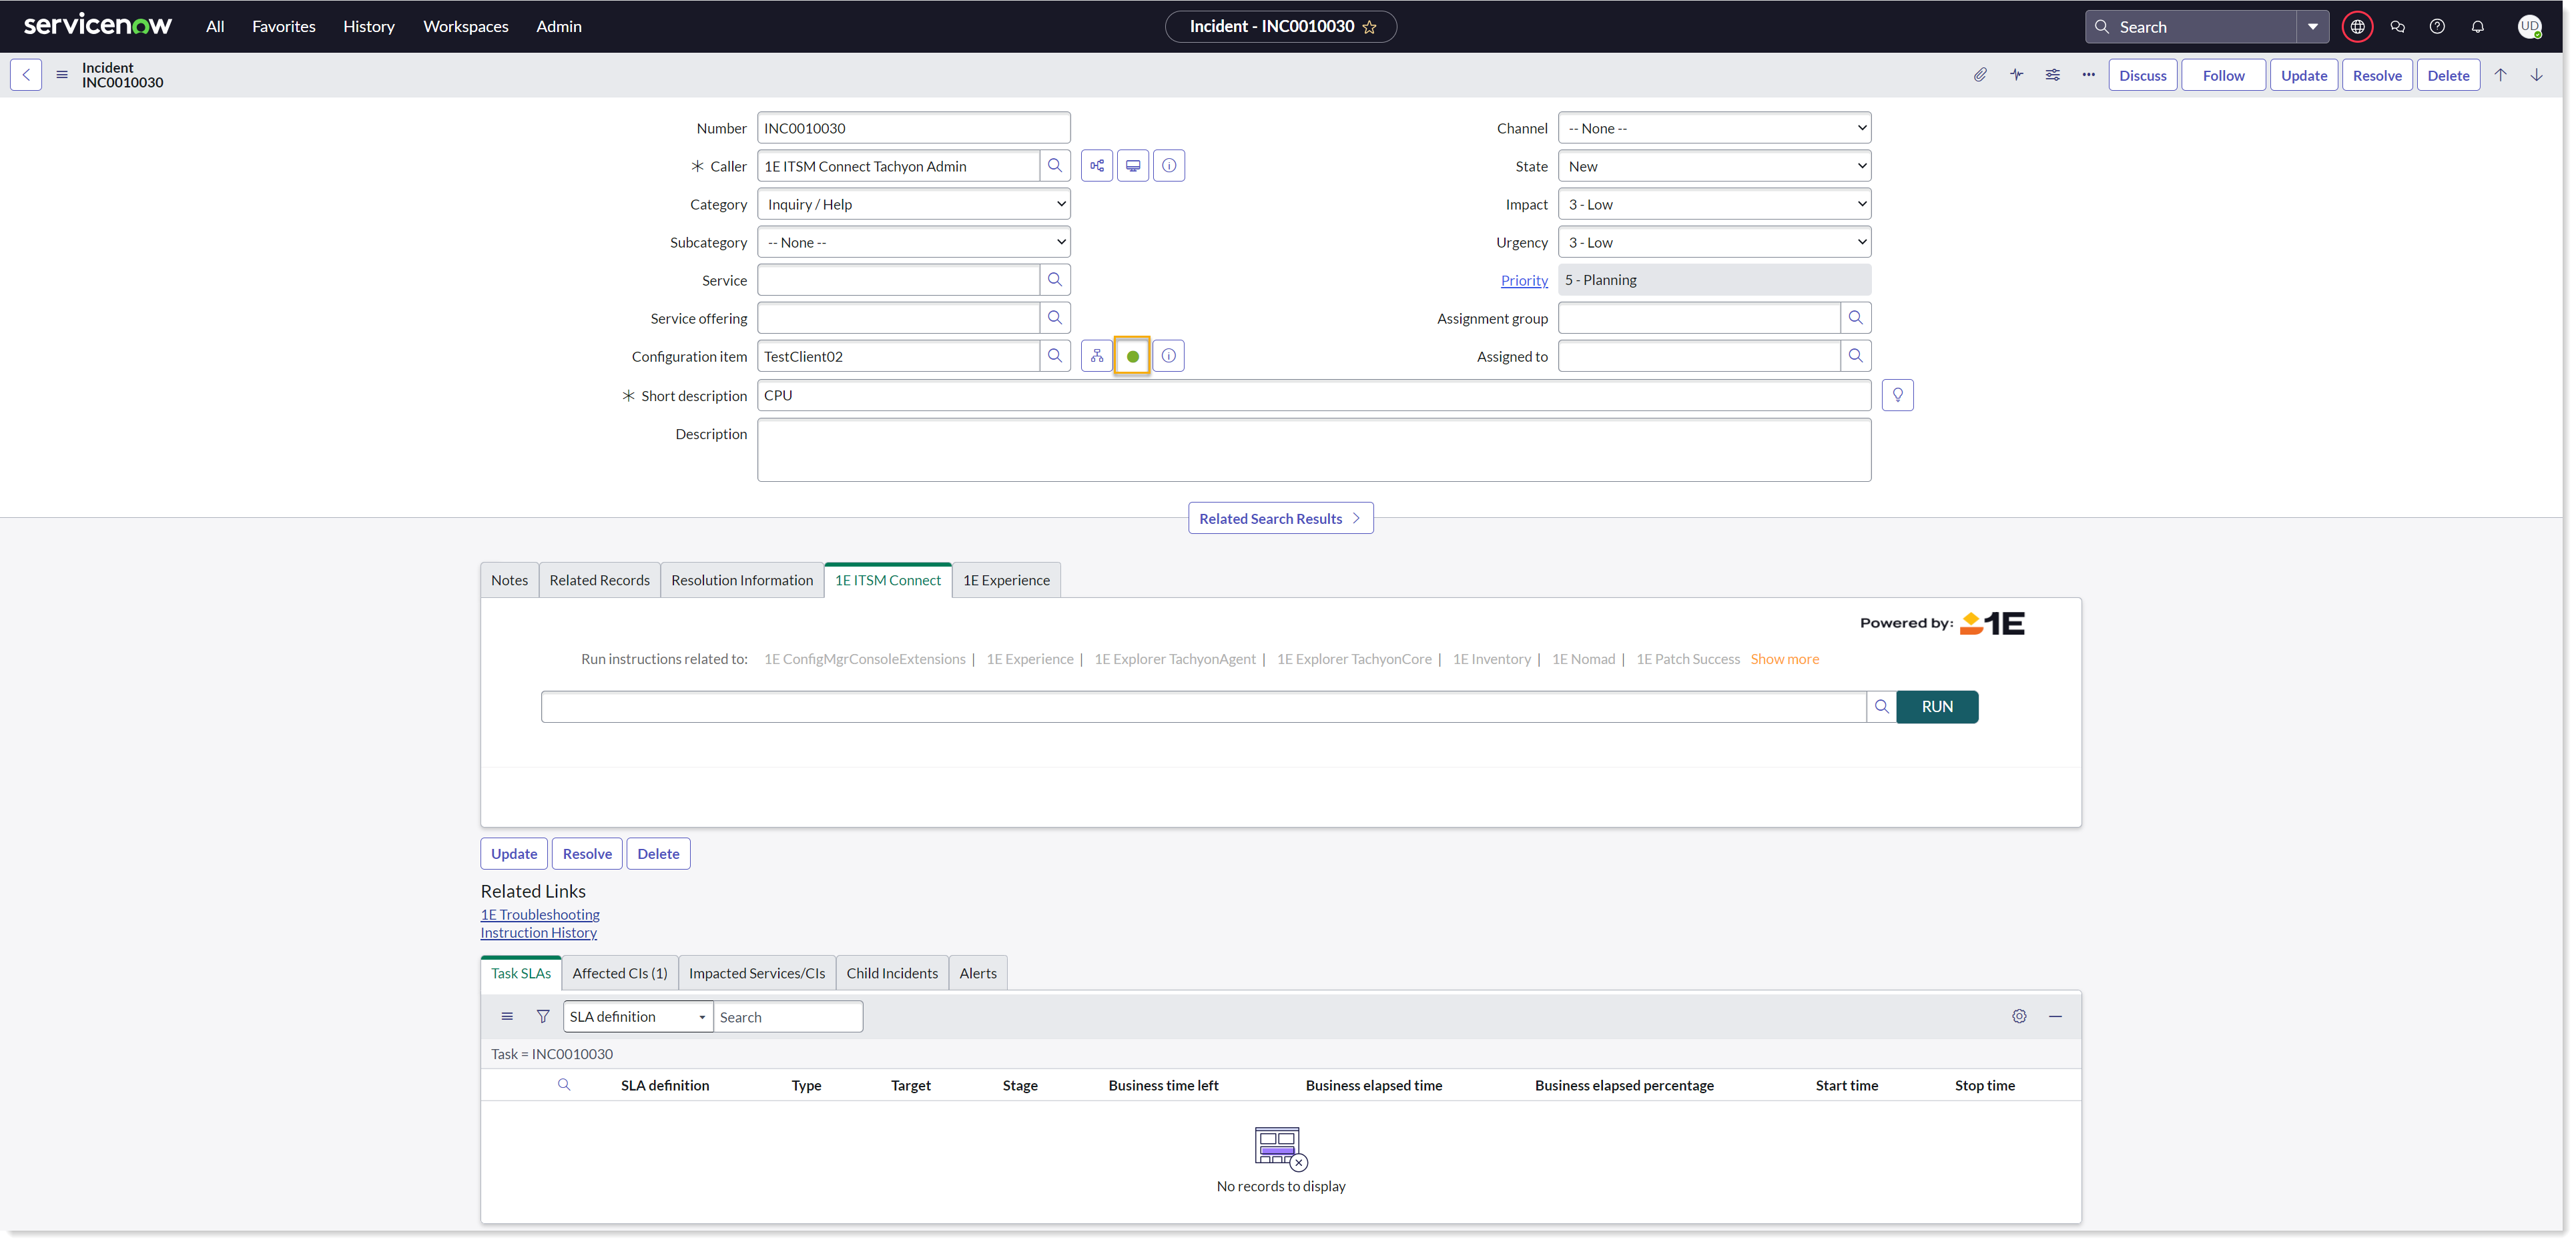
Device Information shows the details of the selected device retrieved from 1E. It is the icon (dot) present adjacent to the Configuration Item (CI) field. The status of the device can be identified by looking at the color of the Device Info icon. When it is green, it means the device is online and when it is red, it means the device is offline. If you hover on the icon, it shows the last connect date and time stamp of the device. To see device information, click on the status icon shown as a green dot in the picture.
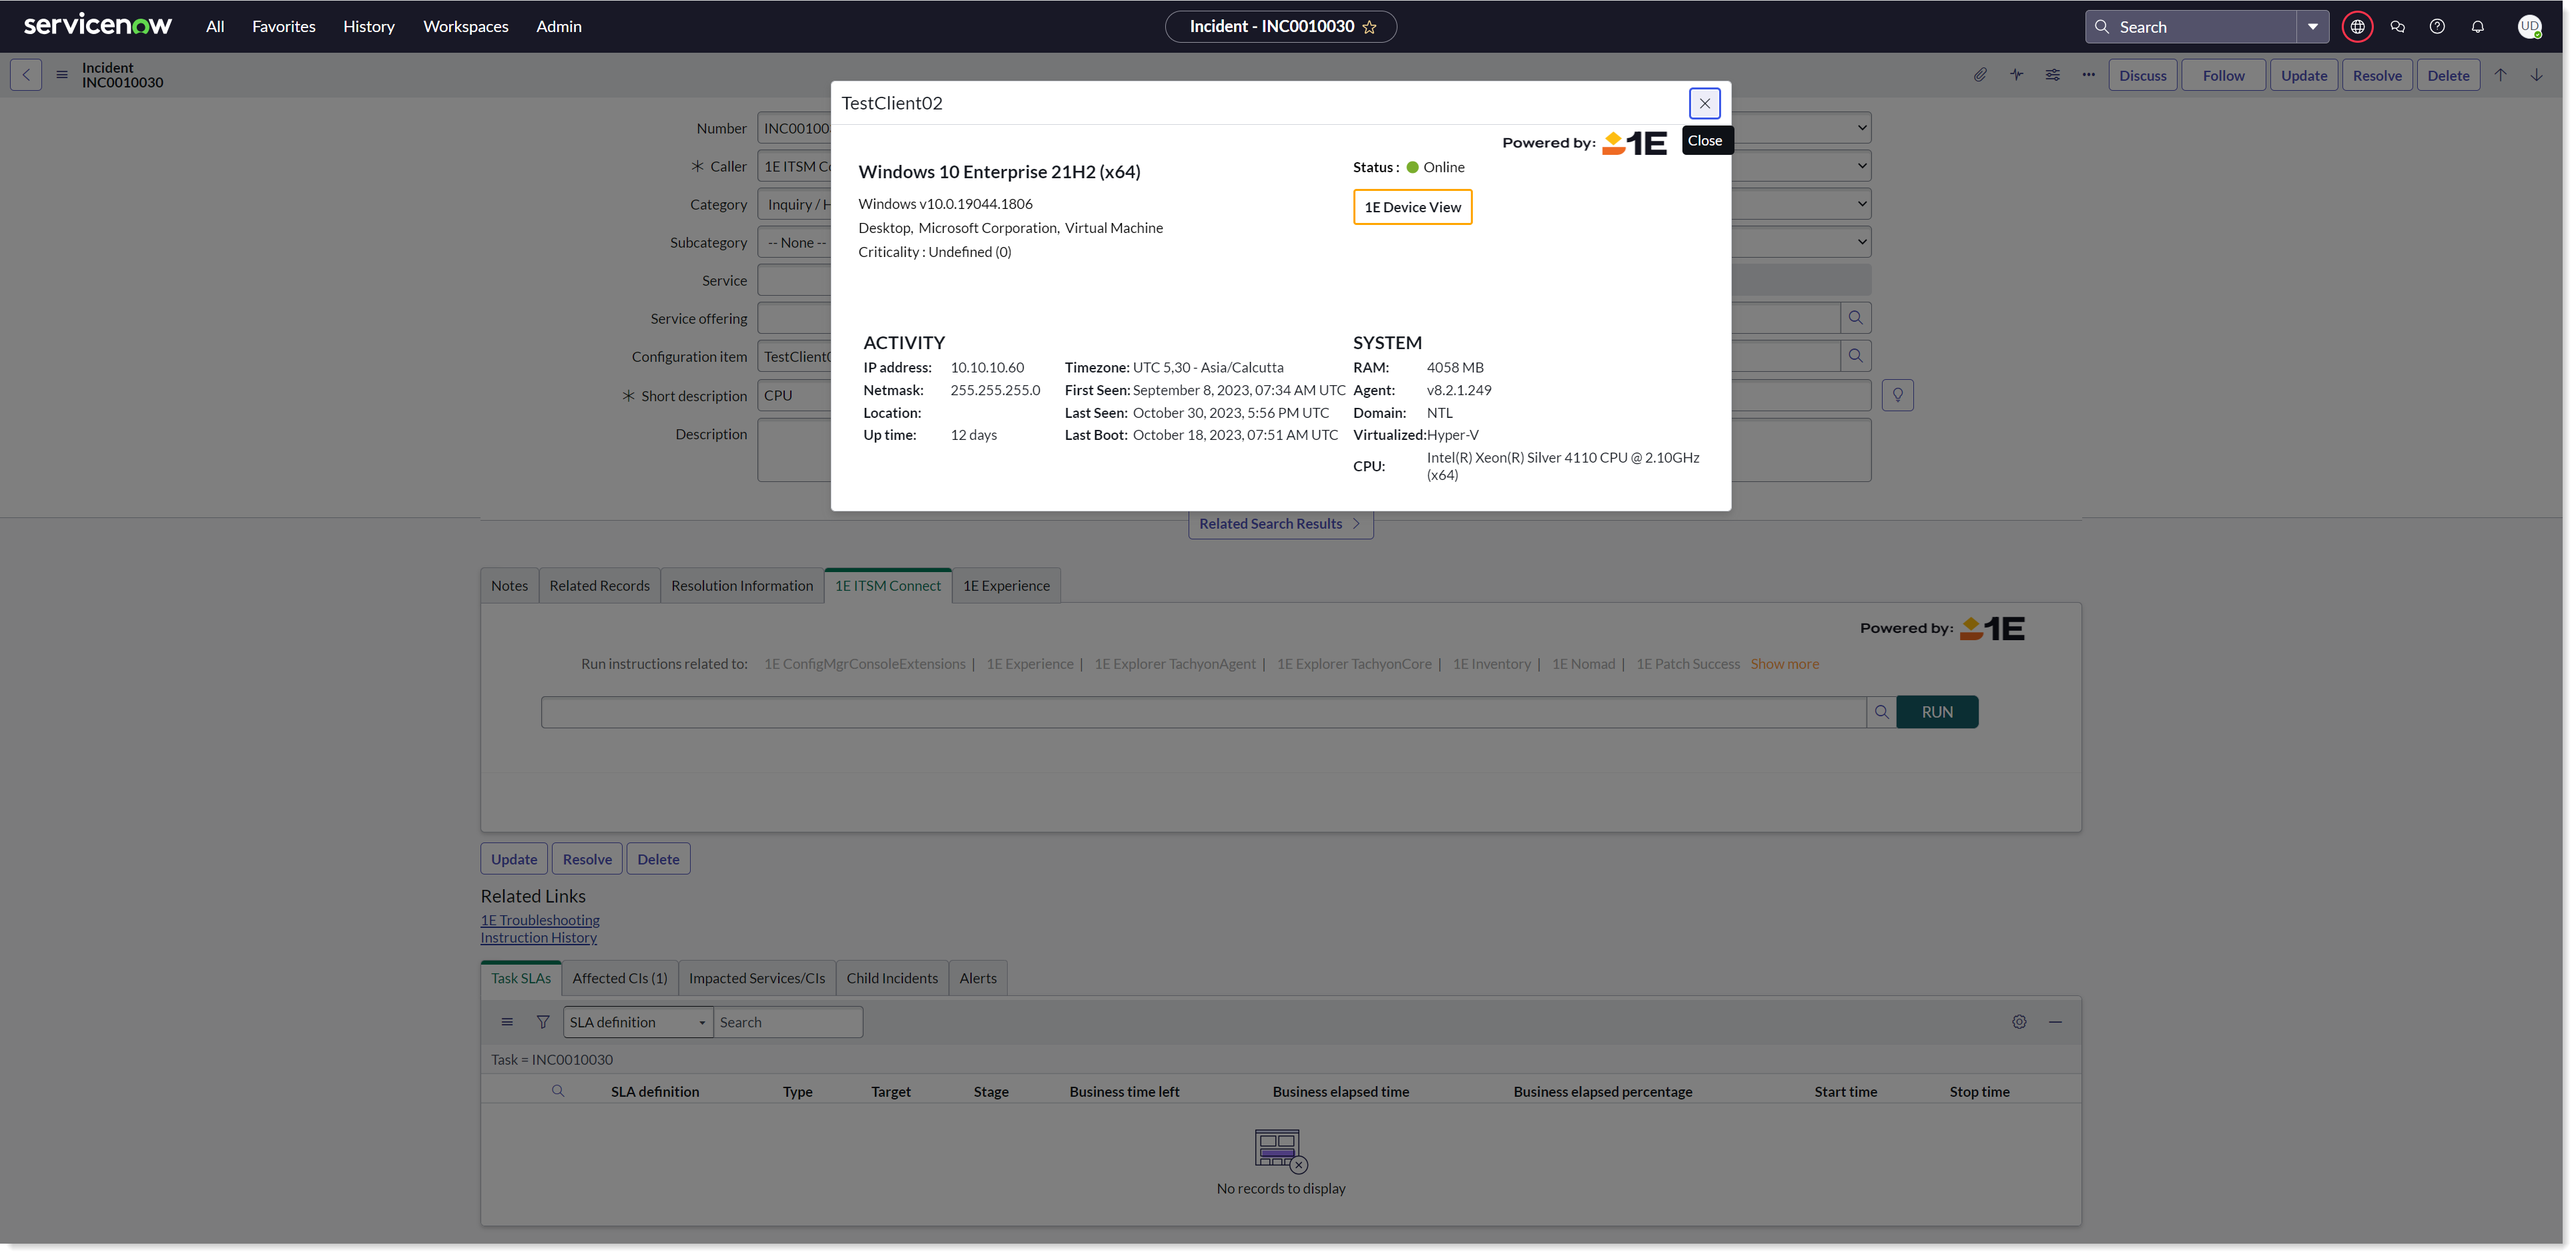
If you click on the icon, a pop-up appears with the detailed information about the selected device, as shown in the picture below. The pop-up screen subsequently displayed shows details collected for the device by 1E such as CPU, RAM, Last Boot, Last Connected and Status. The information of the device will get refreshed when the data changes.
The Device Info icon appears only after it is configured using Form layout setup. The device selected here should match the criteria defined in x_1e_connect.device_info_ci_criteria property. The default value of this property is sys_class_name=cmdb_ci_pc_hardware^ORsys_class_name=cmdb_ci_computer which states that the selected device class should be either ci_pc_hardware or cmdb_ci_computer. An admin user can update this criterion any time.
The system property x_1e_connect.DeviceInfoSyncTime accepts an encoded query that is used to filter device information data from x_1e_connect_device_info table.
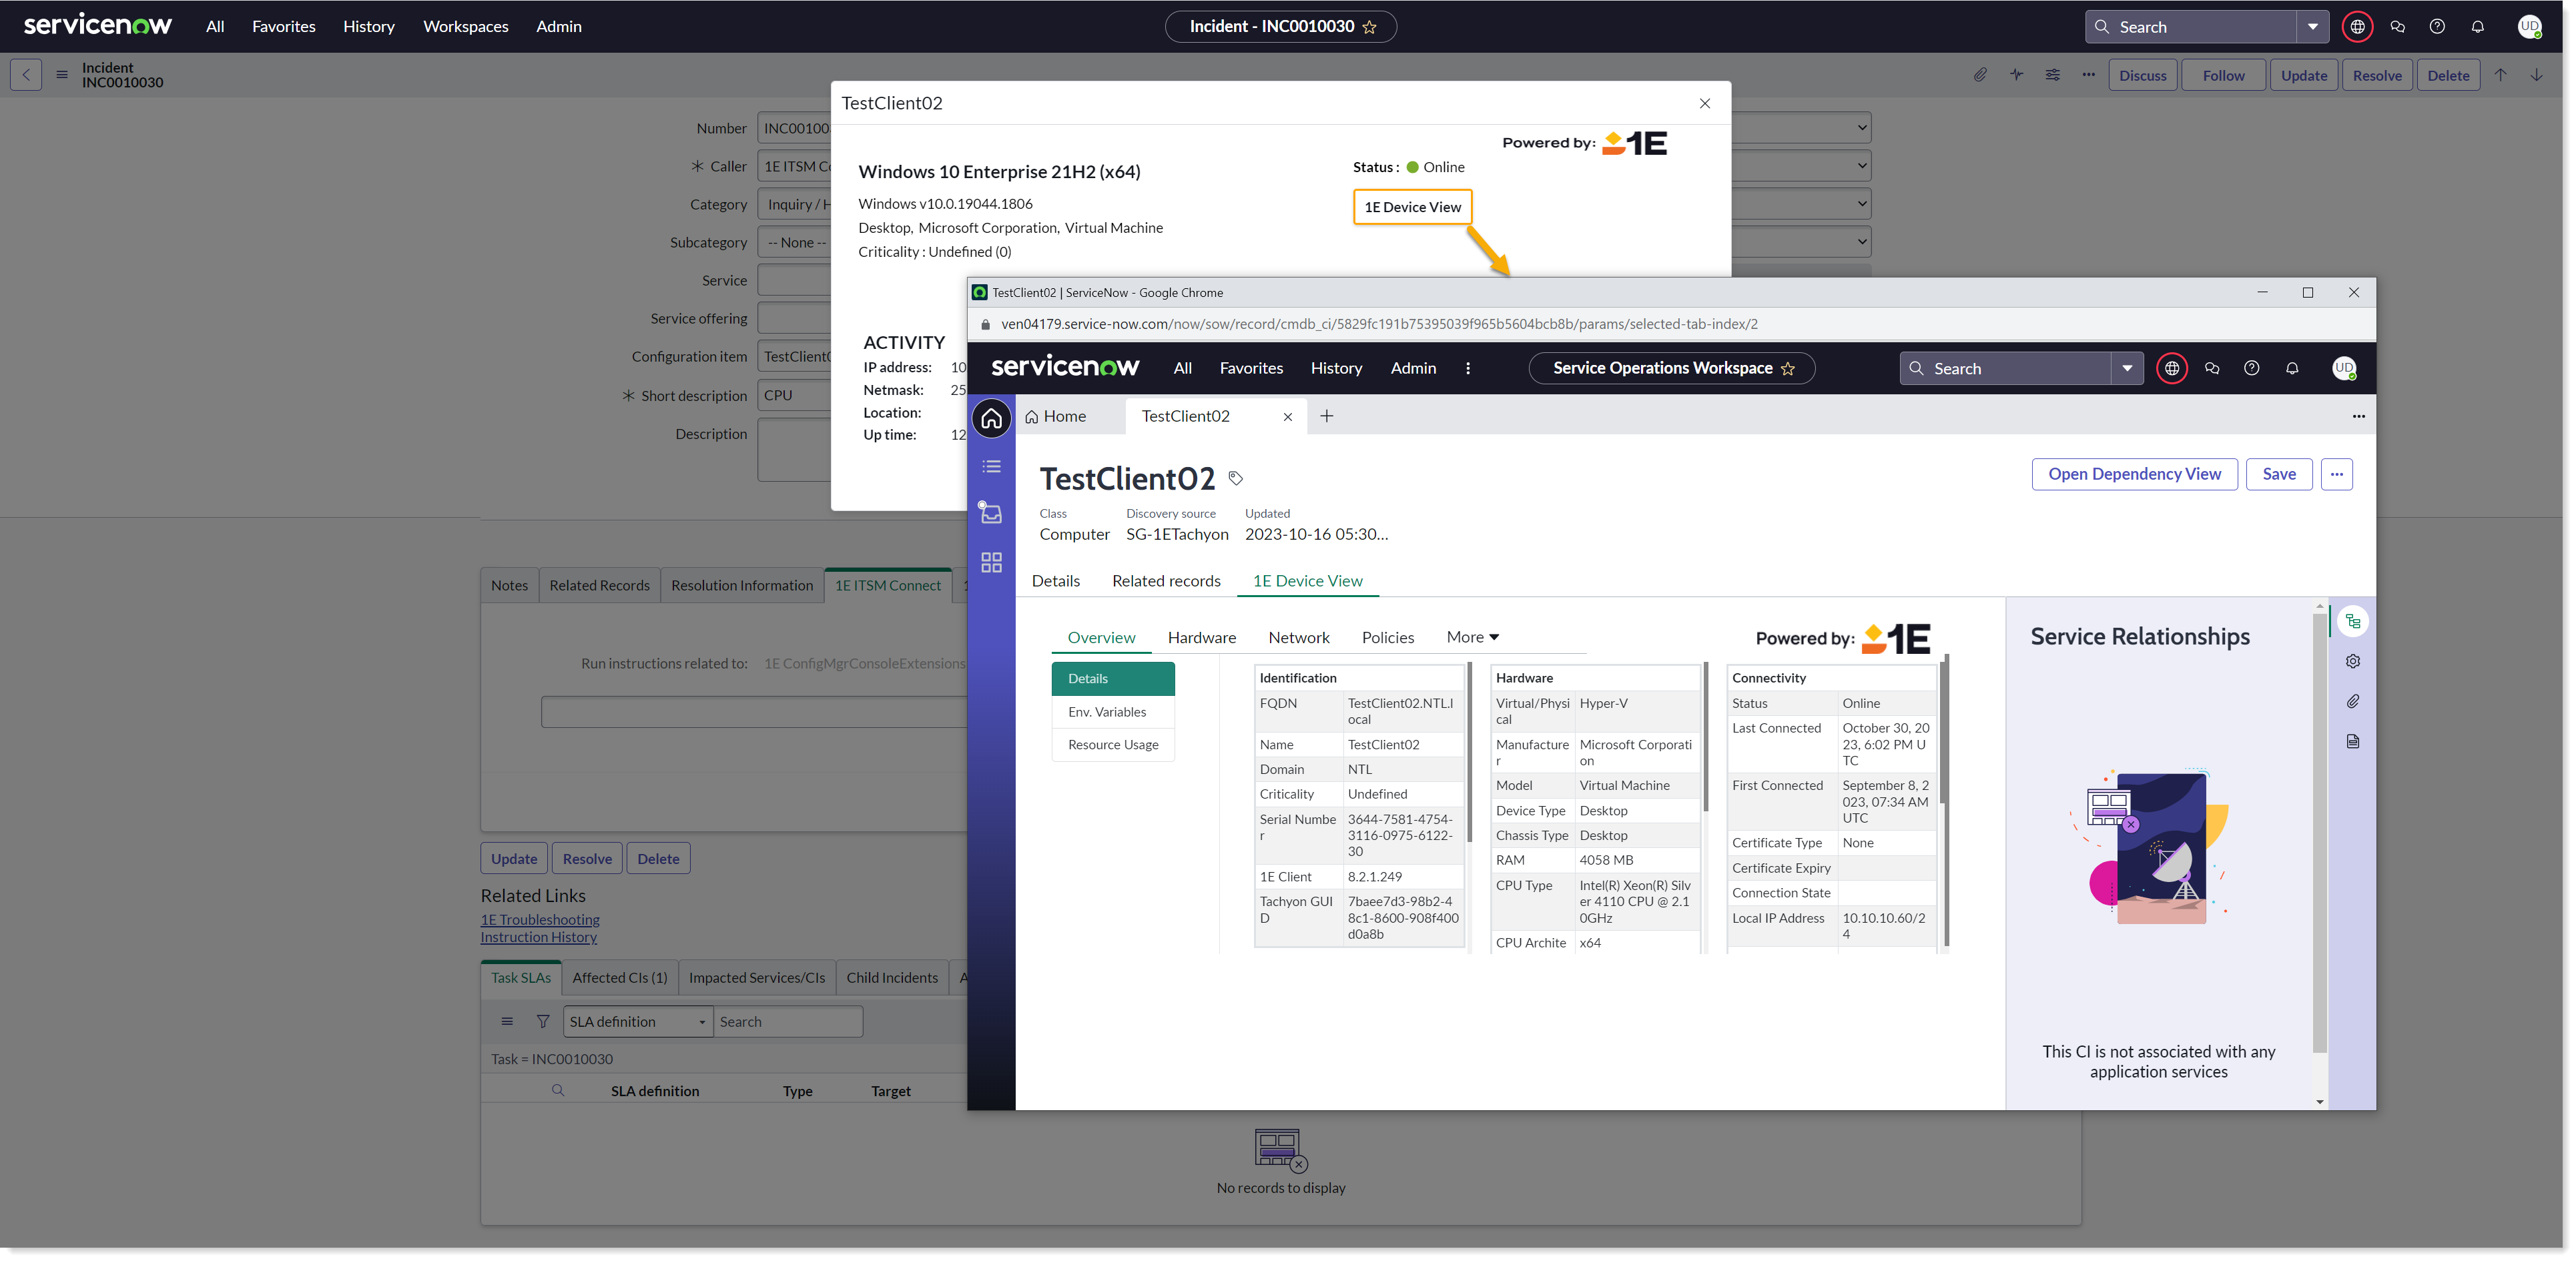
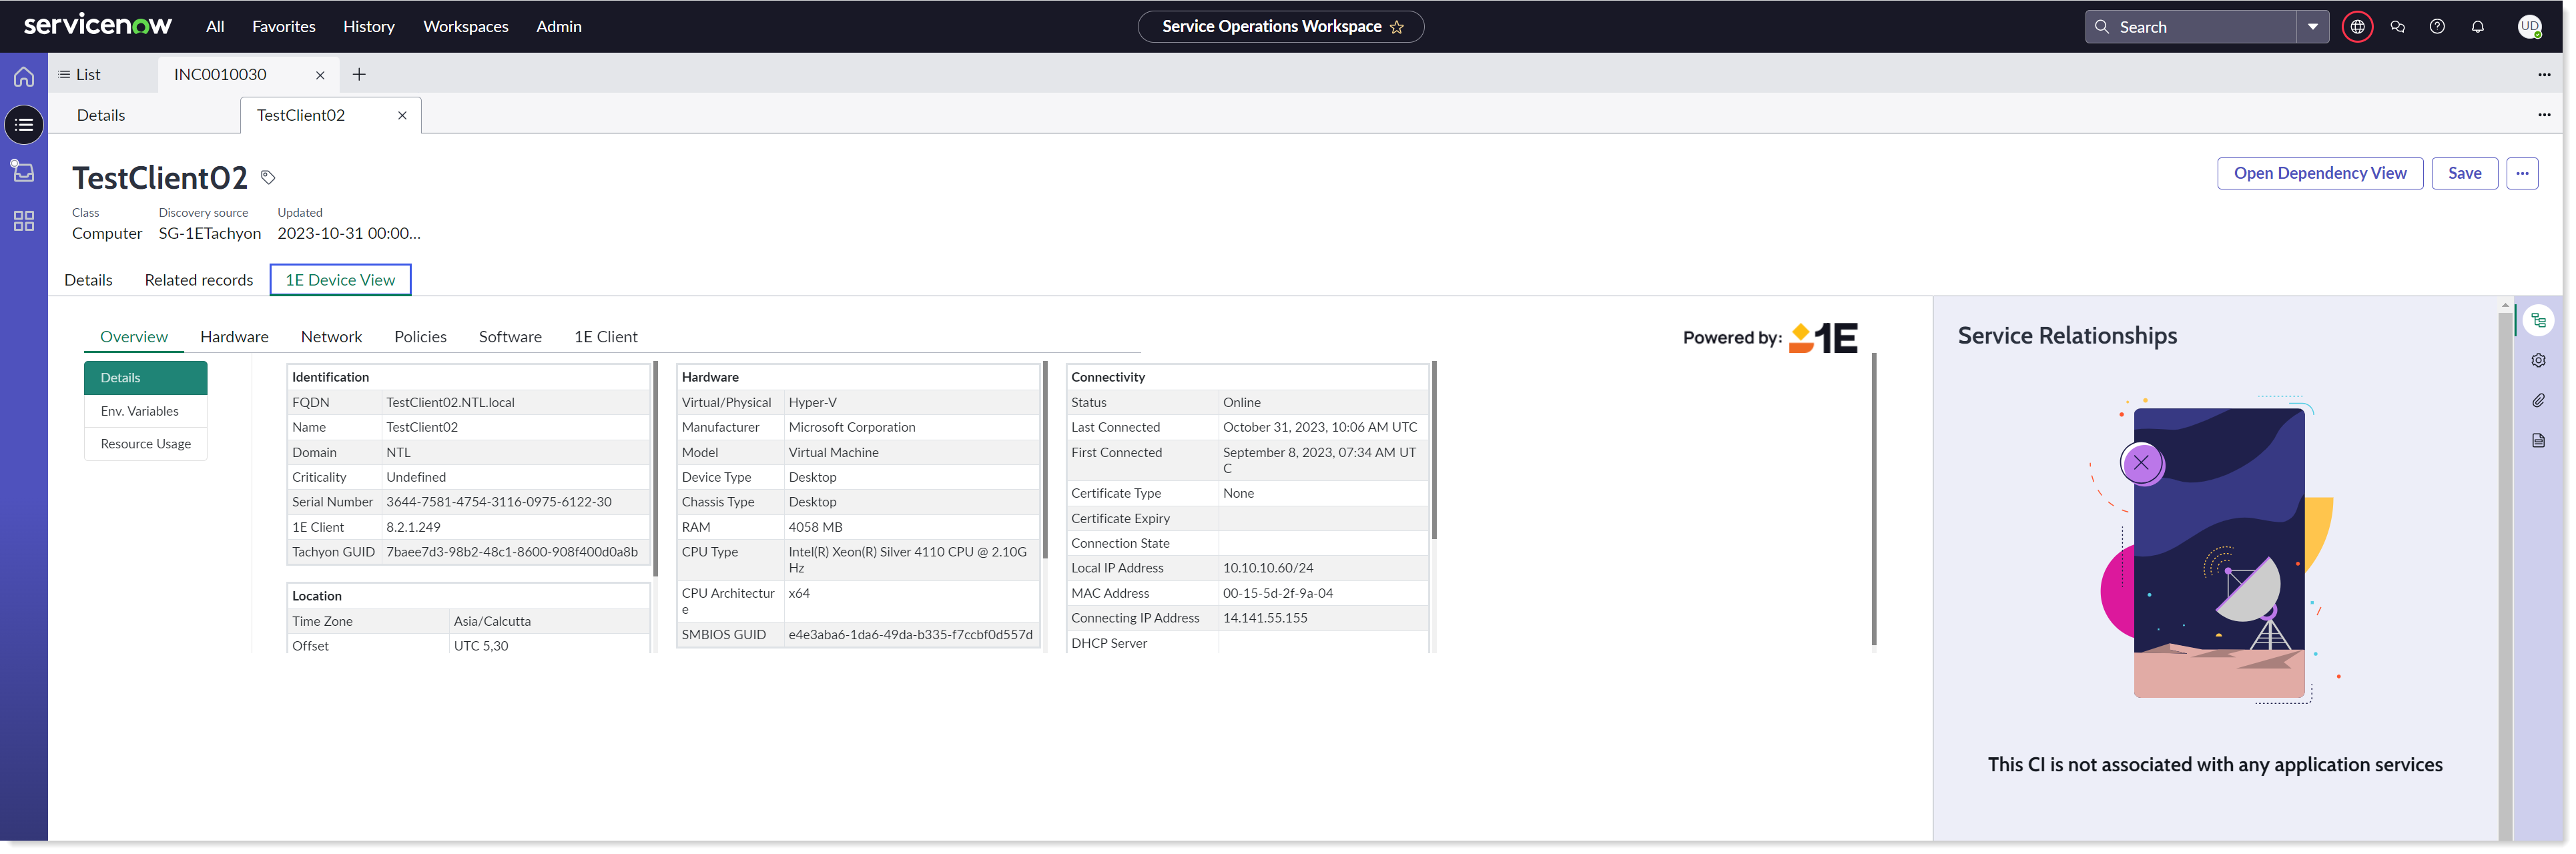
If you click on the little button 1E Device View given on the Device Info pop-up Screen, it will open the record in the Service Operations Workspace as shown in the picture below. To view this button, set the system property x_1e_connect.device_view_button_visibility value to True.
1E Device View in Agent and Service Operations Workspace
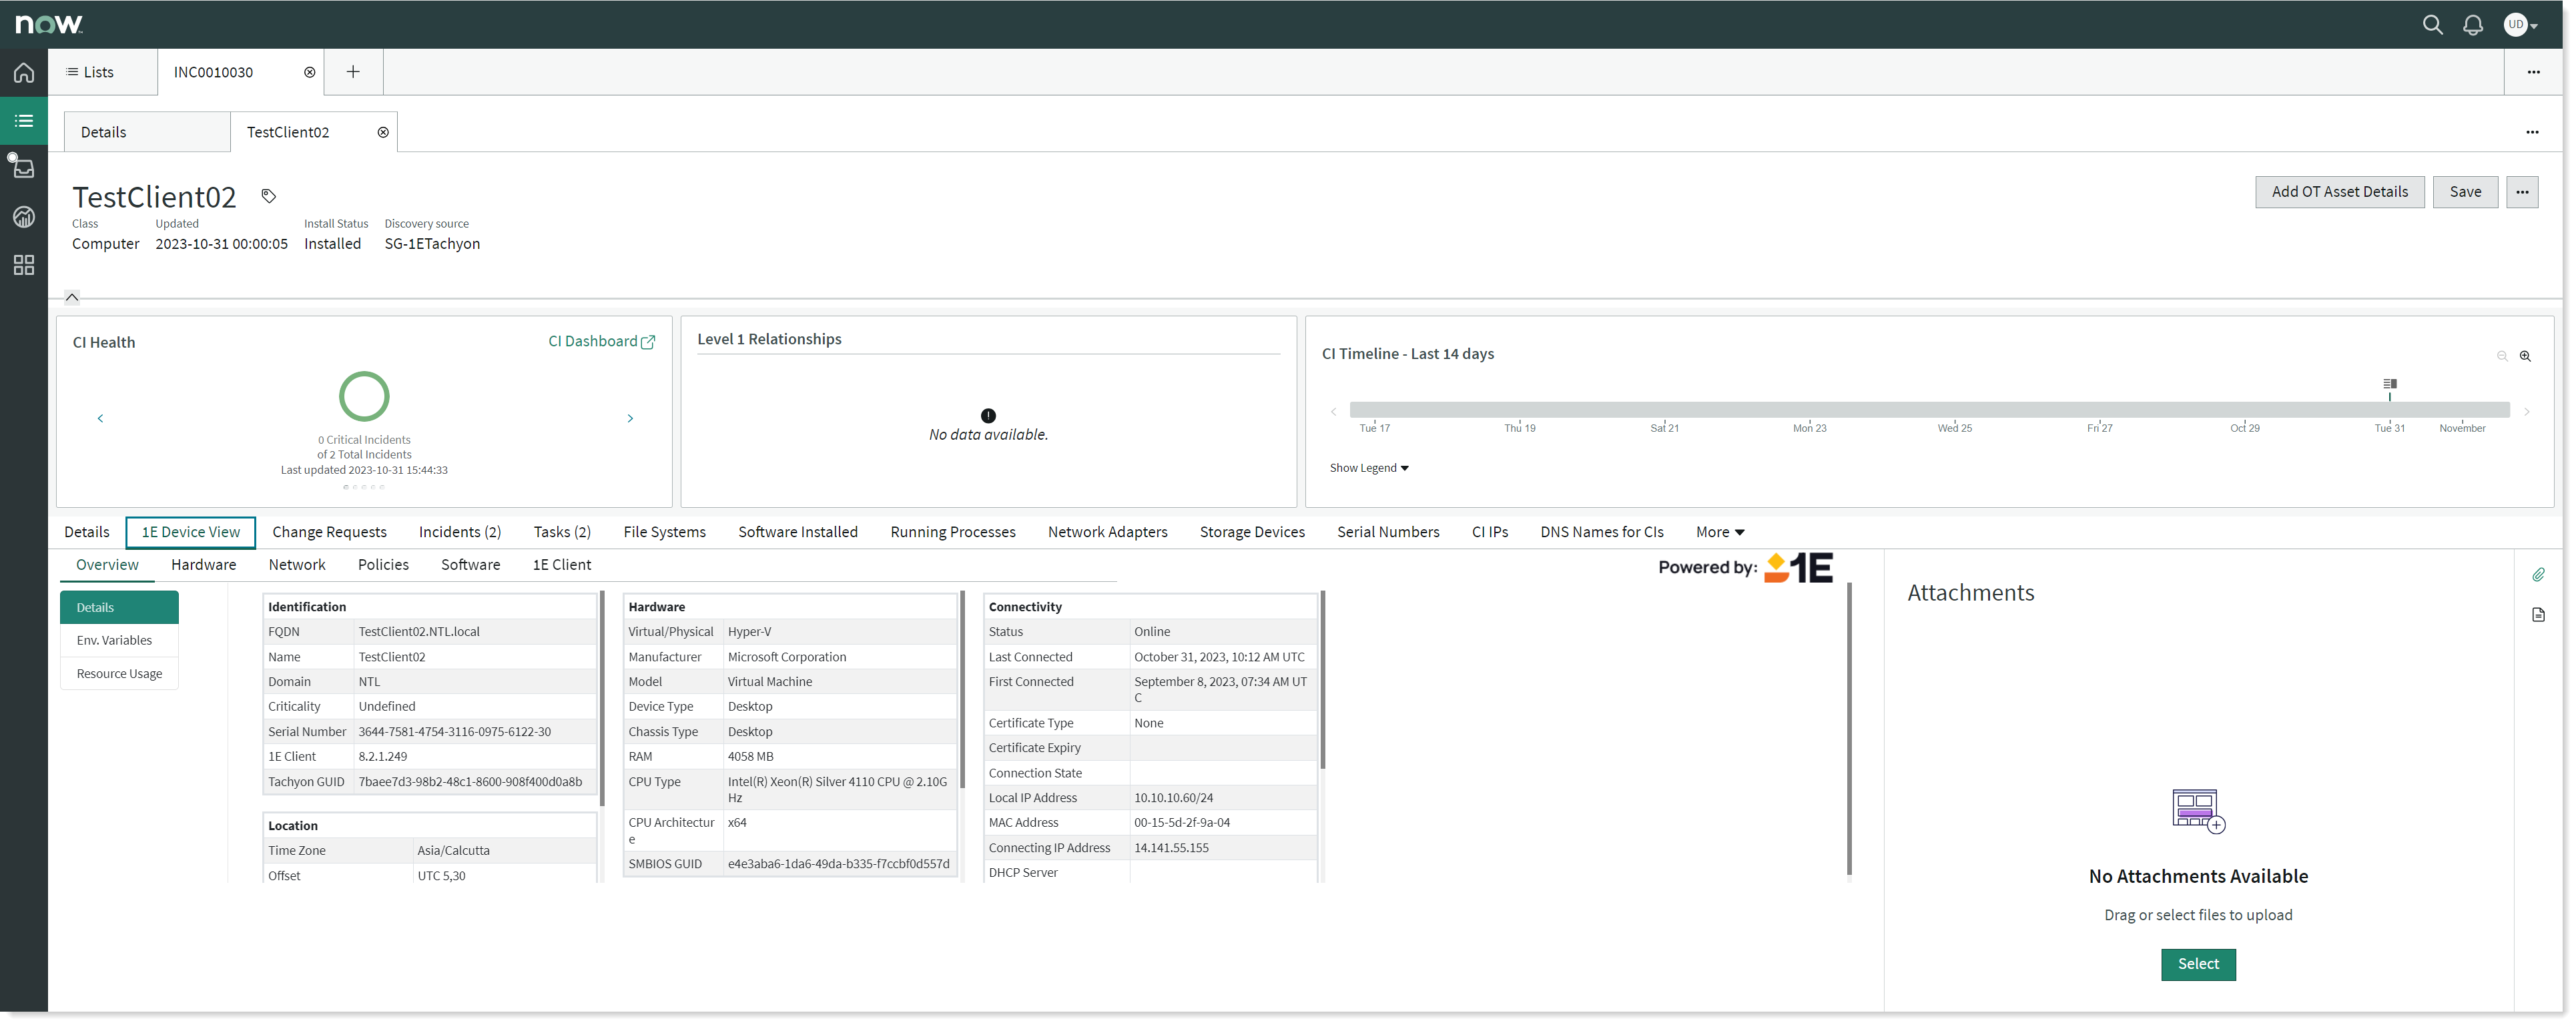
1E Device View tab provides a summarized overview of all the information known about a selected device. It can also retrieve the real-time information about the selected device. Each tab has one or more panels having tiles populated with data from various sources, some by instructions that are run instantly.
To view the 1E Device View tab, open the Incident page and click on Details. Now click on the  icon given on the Configuration item field. You can view the below information either from the Incident record or from the CI record.
1E Device View in Agent Workspace-
1E Device View in Service Operations Workspace-
If you re-click on each tile, it will fetch the information again.
If an error message appears while fetching this information, it could be for the following reasons:
if the device is offline
information is not available at that moment
an error occurred while fetching the device information
Experience Scores and Trend chart
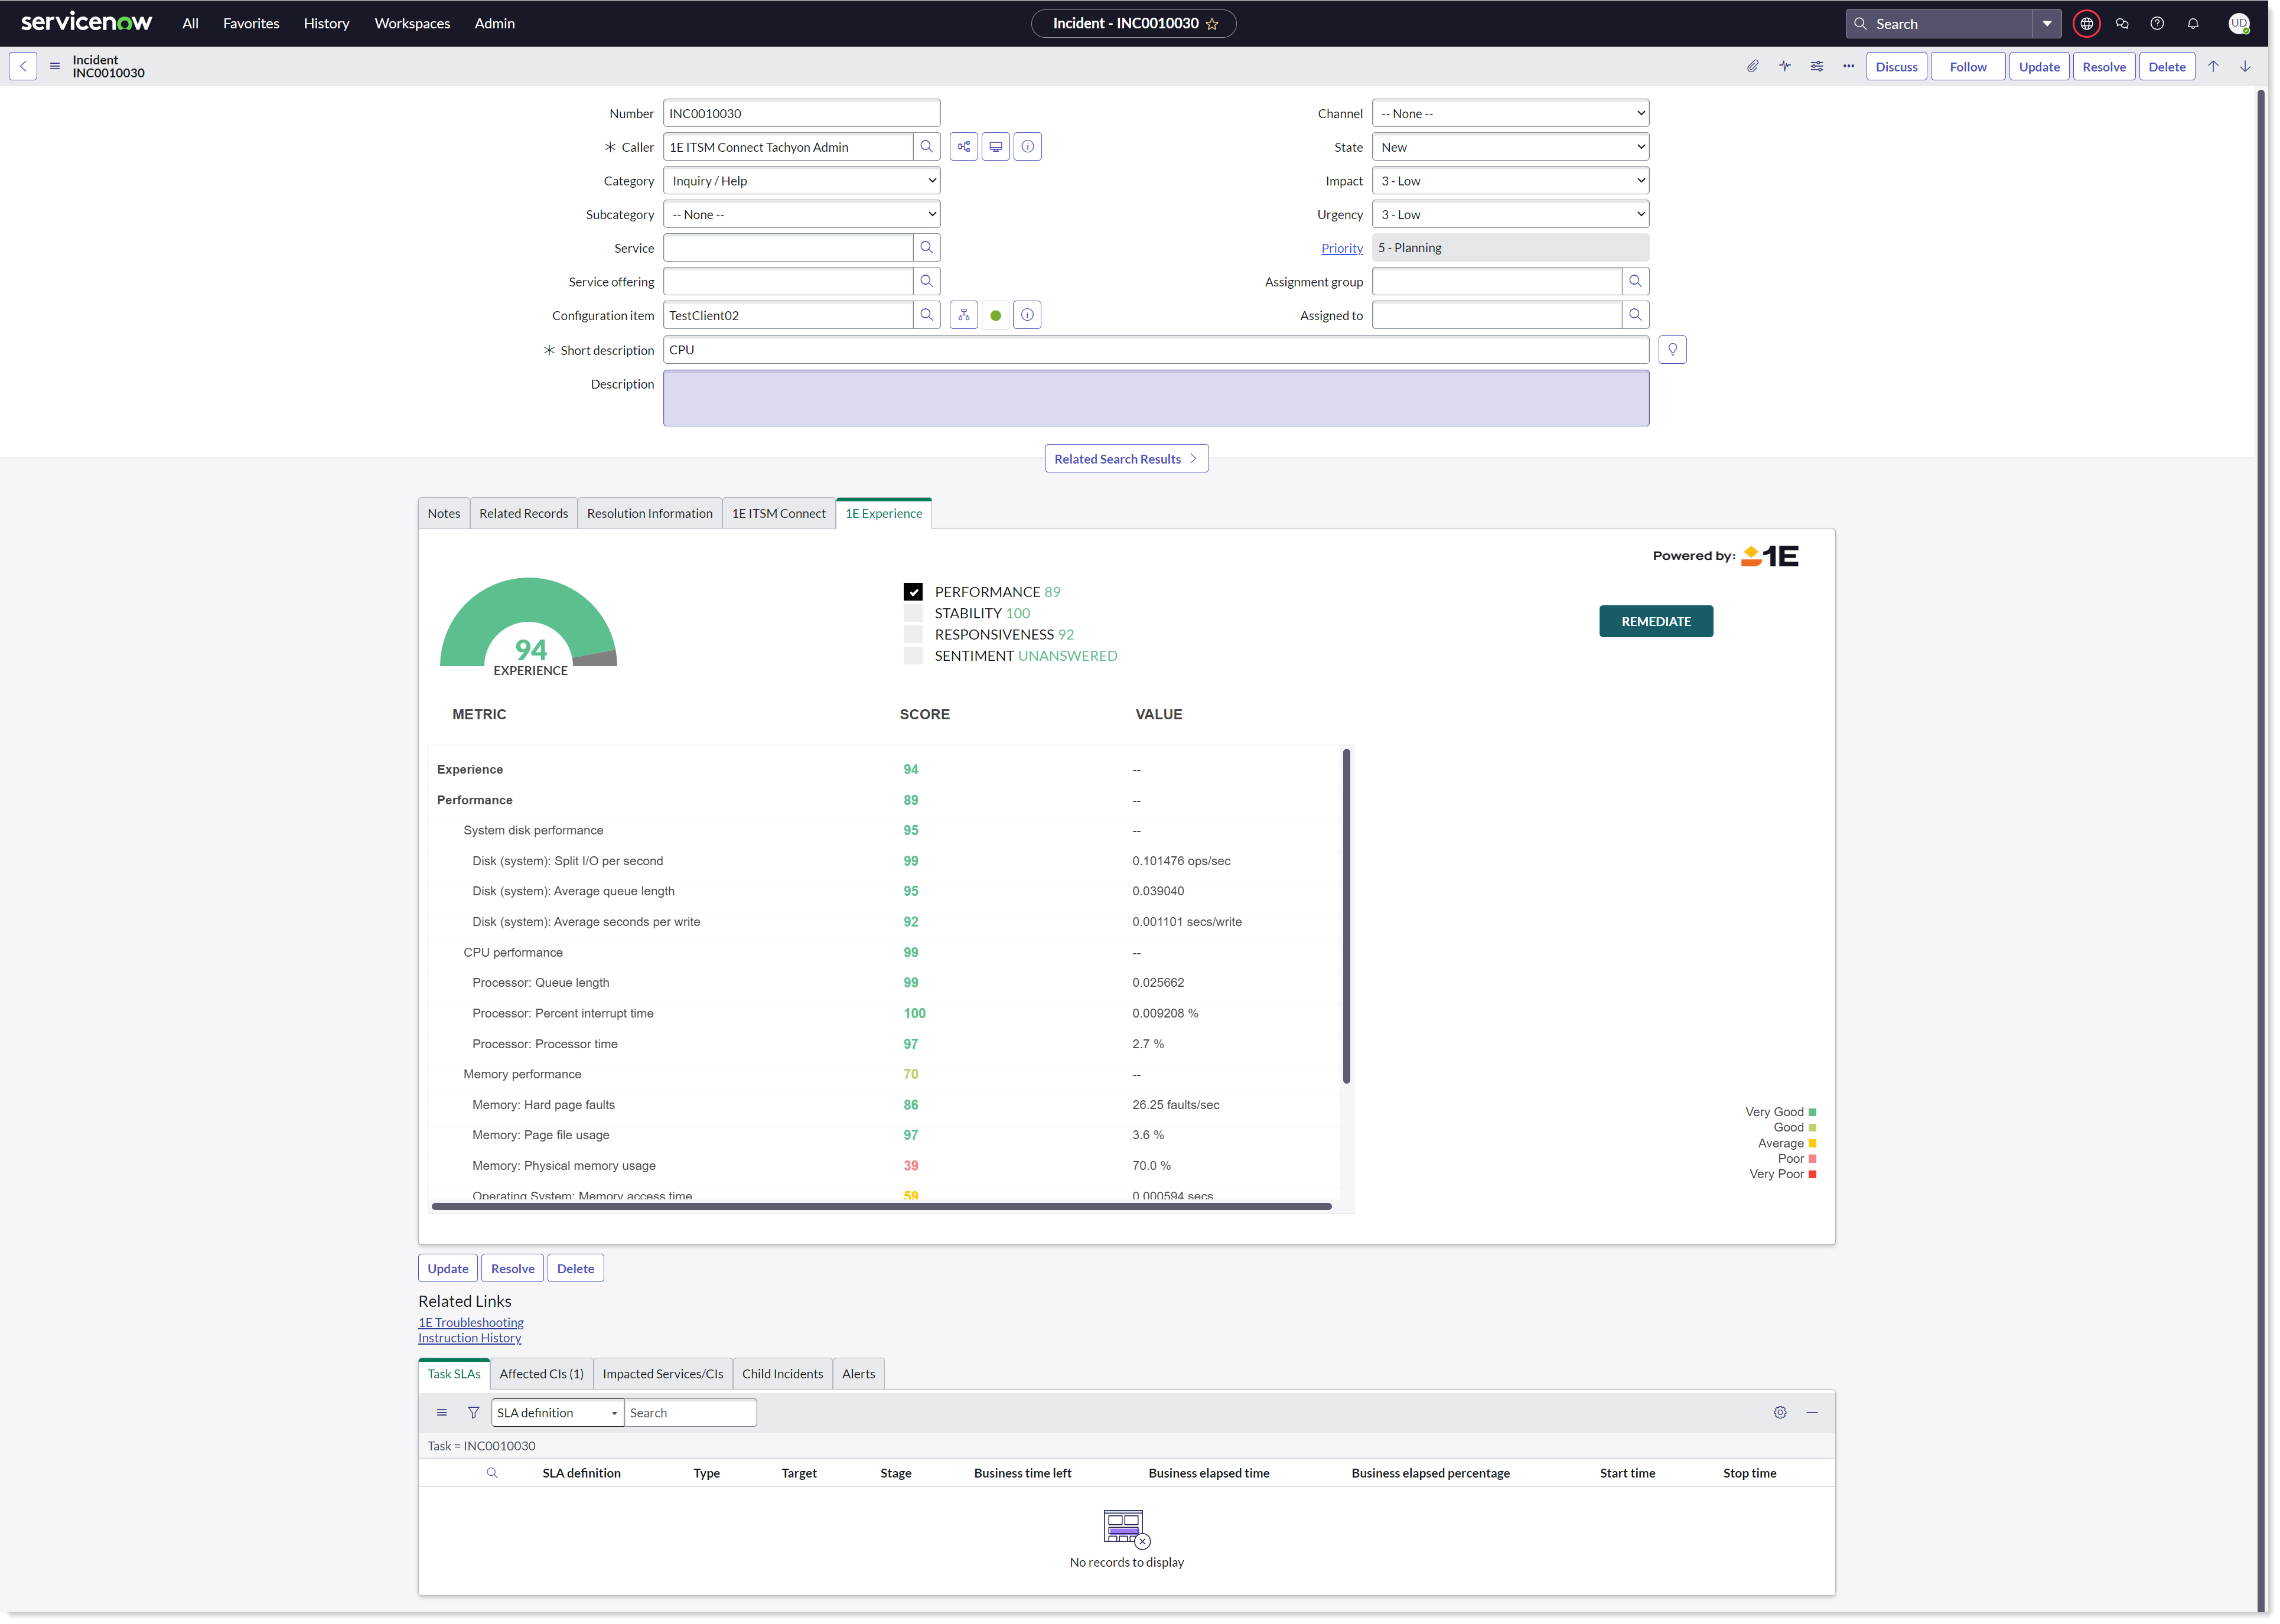
Experience Scores in Native UI
The 1E Experience tab on the incident page shows the Experience Analytics data for the selected device. To display these scores, ensure that the entitlement check has been performed successfully on the App Configuration page and the 1E Experience tab has been configured.
Experience Scores are imported from Experience Analytics. To view Experience Scores, follow the below steps:
Navigate to 1E ITSM Connect → Incidents.
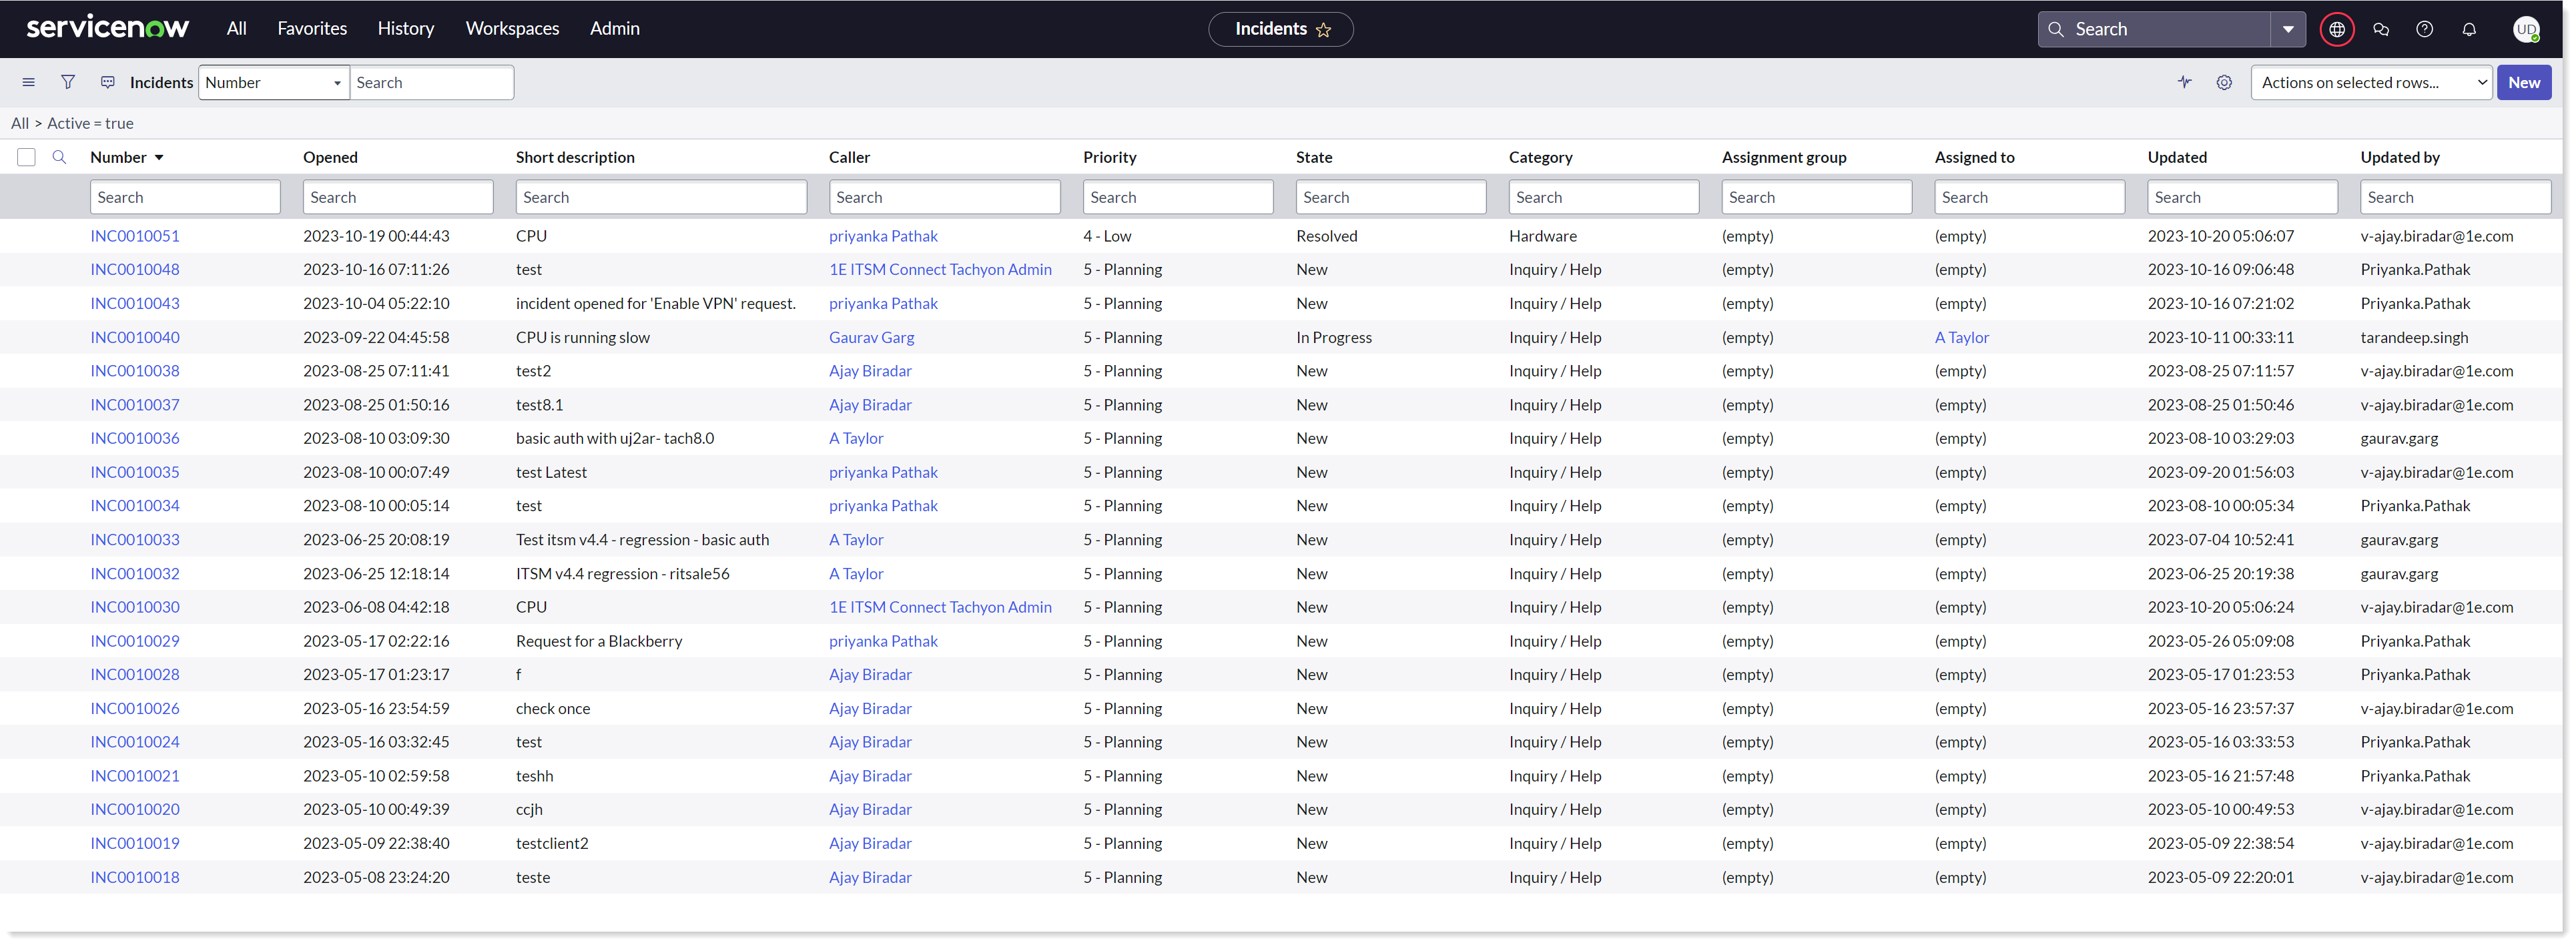
Select the incident you want to run and click on it. Now scroll down to the bottom of the Incident form and click on 1E Experience tab as shown below.
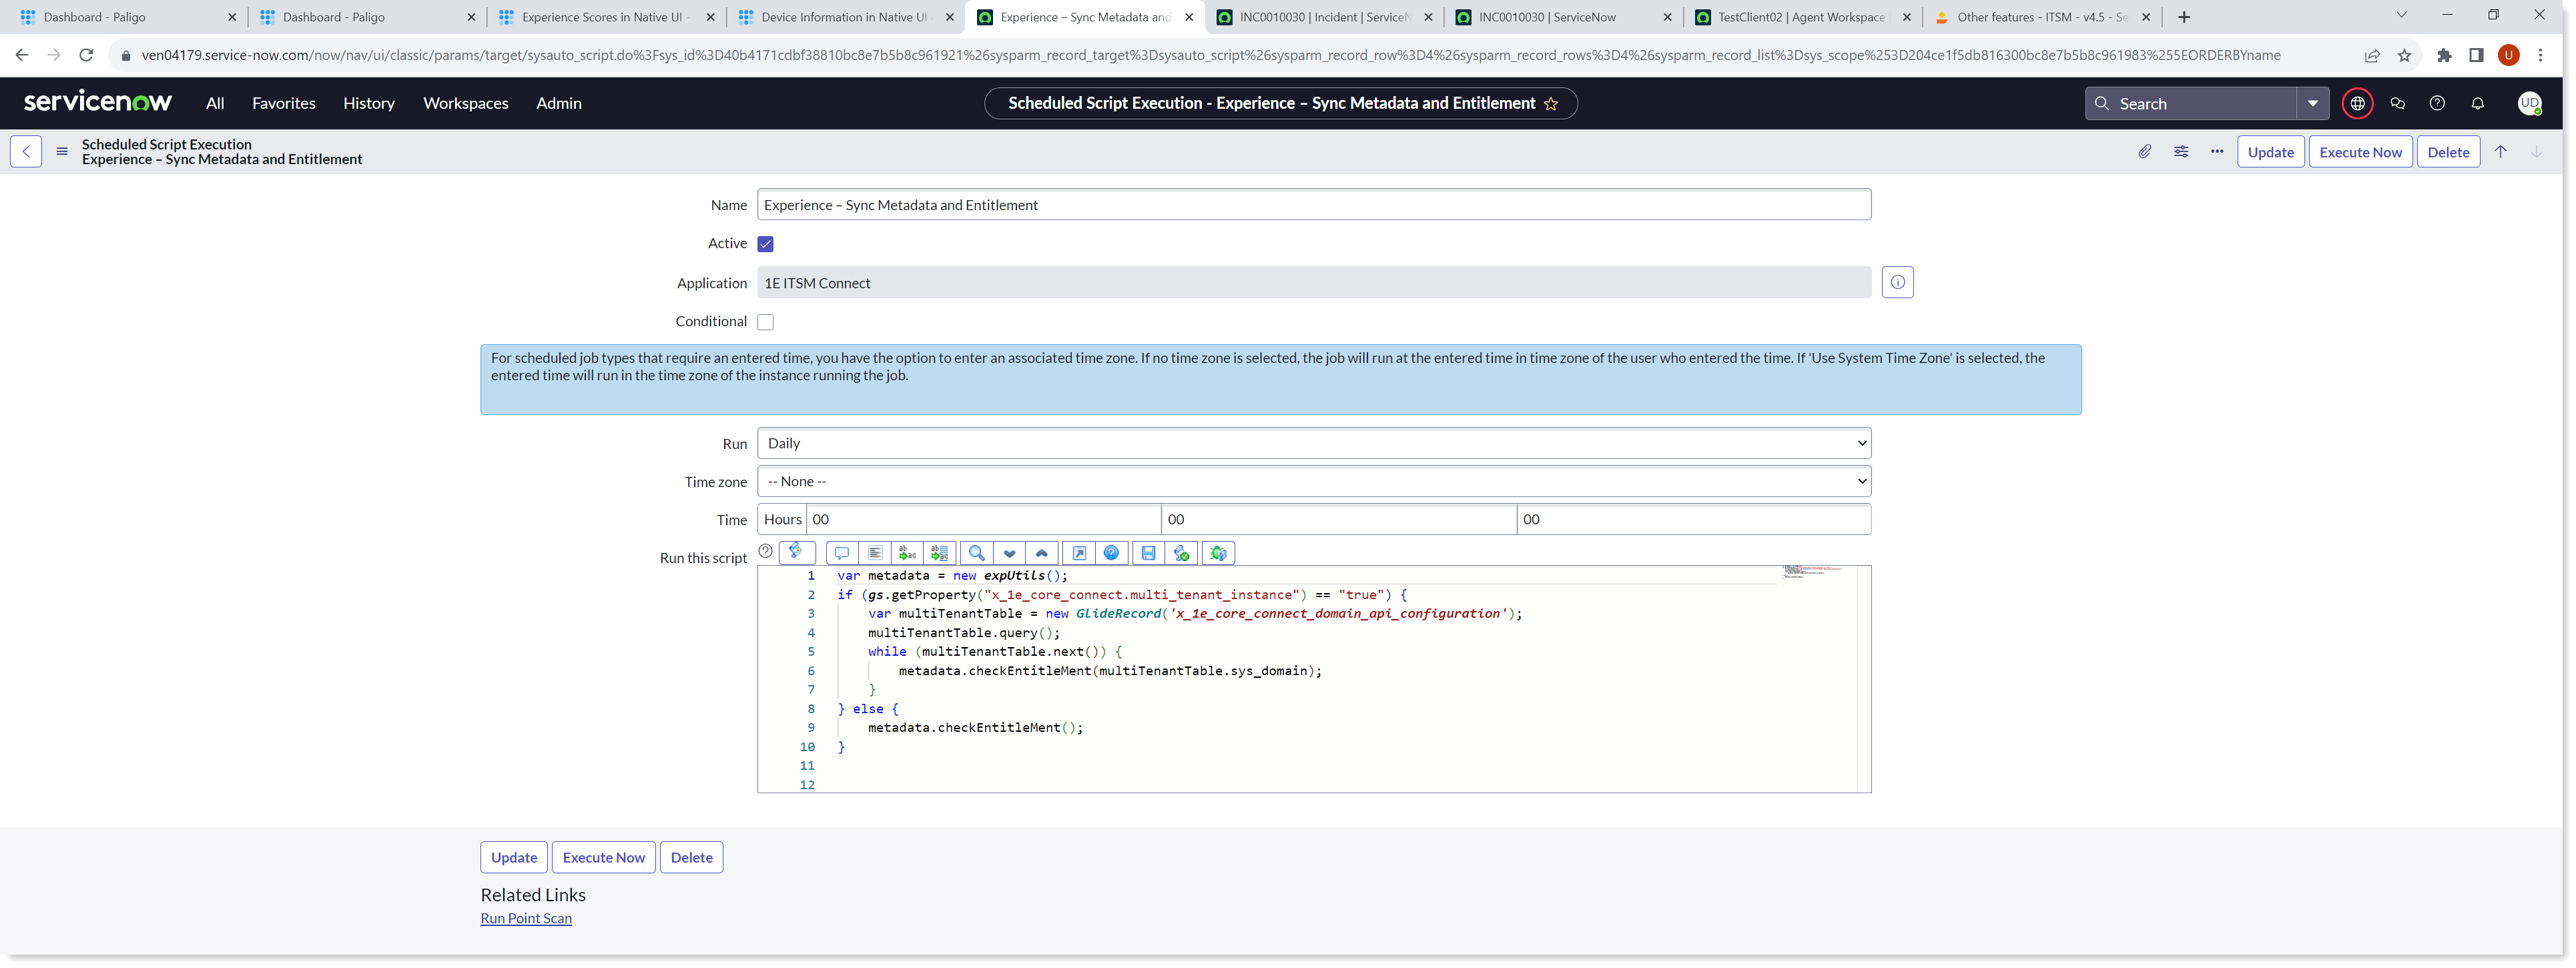
The purpose of this job is to sync metadata from Experience Analytics to ServiceNow. This metadata is used to show data on the 1E Experience tab displayed on the incident page. This job is executed on a daily basis at midnight.
To view this job, login to ServiceNow with Global Administrator credentials and navigate to 1E ITSM Connect→Administration→Scheduled Jobs. Select Experience - Sync Metadata and Entitlement to see the details as shown below.
Experience Scores in Agent and Service Operations Workspace
These experience scores are imported from Experience Analytics and displays the Experience data for the selected device. To display these scores, ensure that the entitlement check has been performed successfully on the App Configuration page. To view Experience Scores, follow the below steps:
In your workspace, select any incident from the list which you want to work on. The details of the selected incidents are now displayed in a new tab.
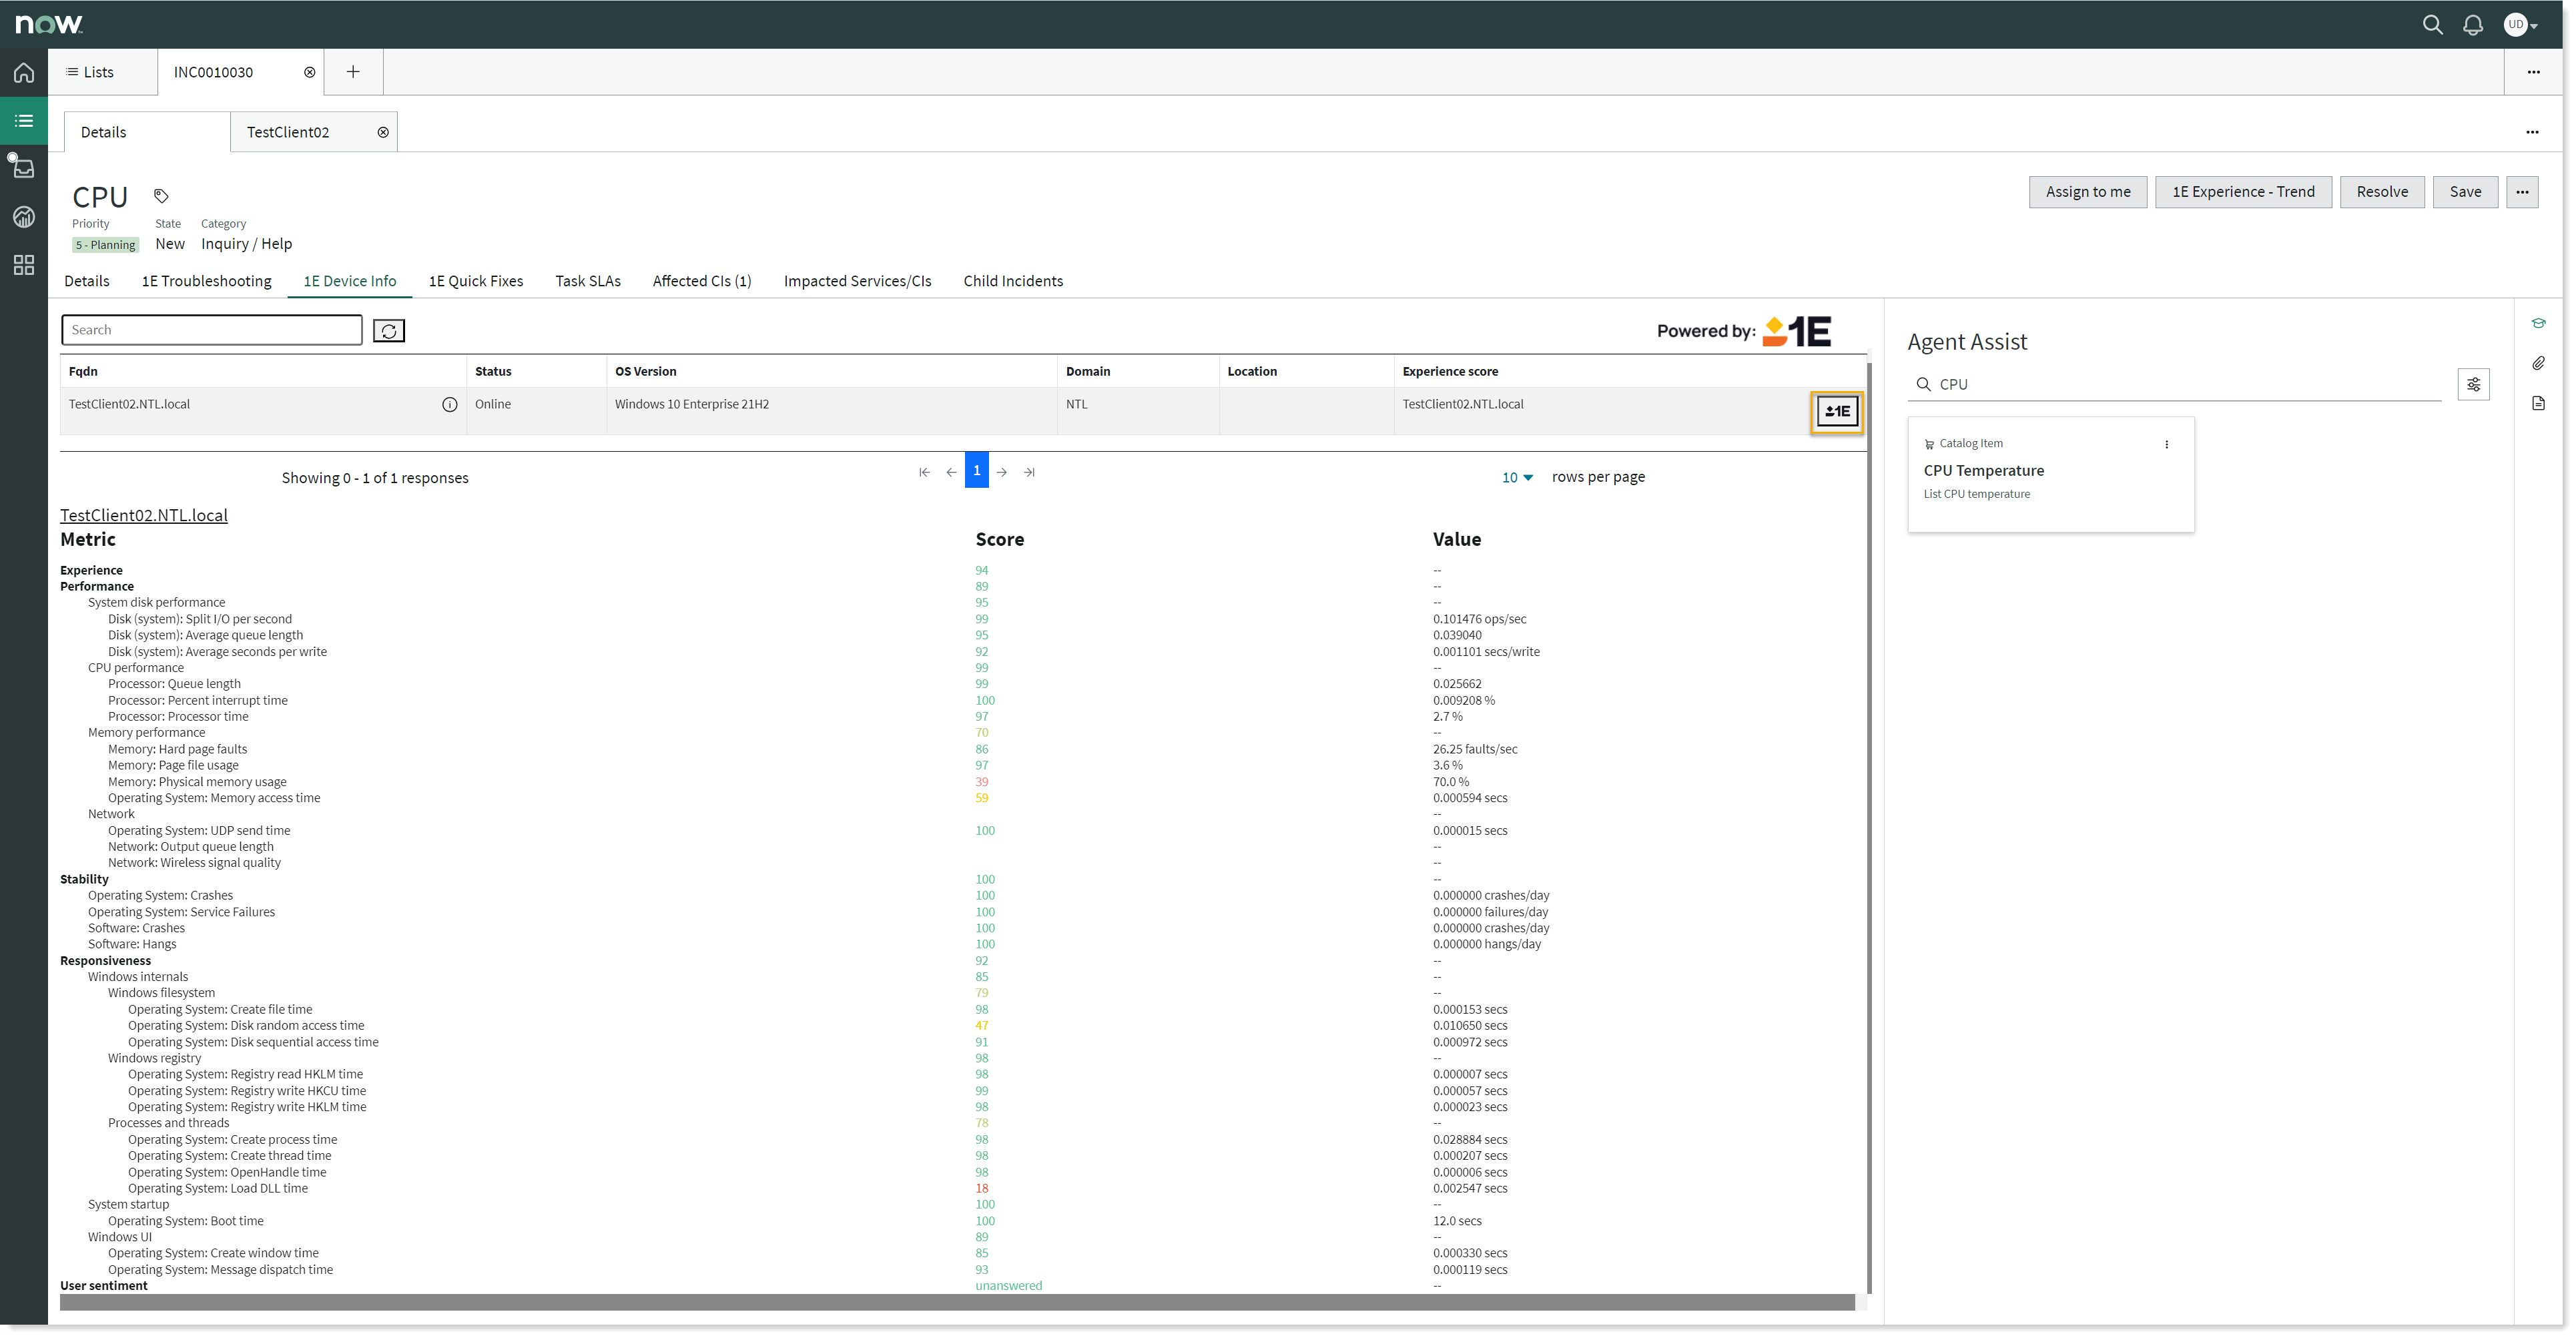
Click on the 1E Device Info tab. It will display the list of all the devices those have Fqdn and are from valid CI class. Now click on the Experience score field, as shown in the picture below.
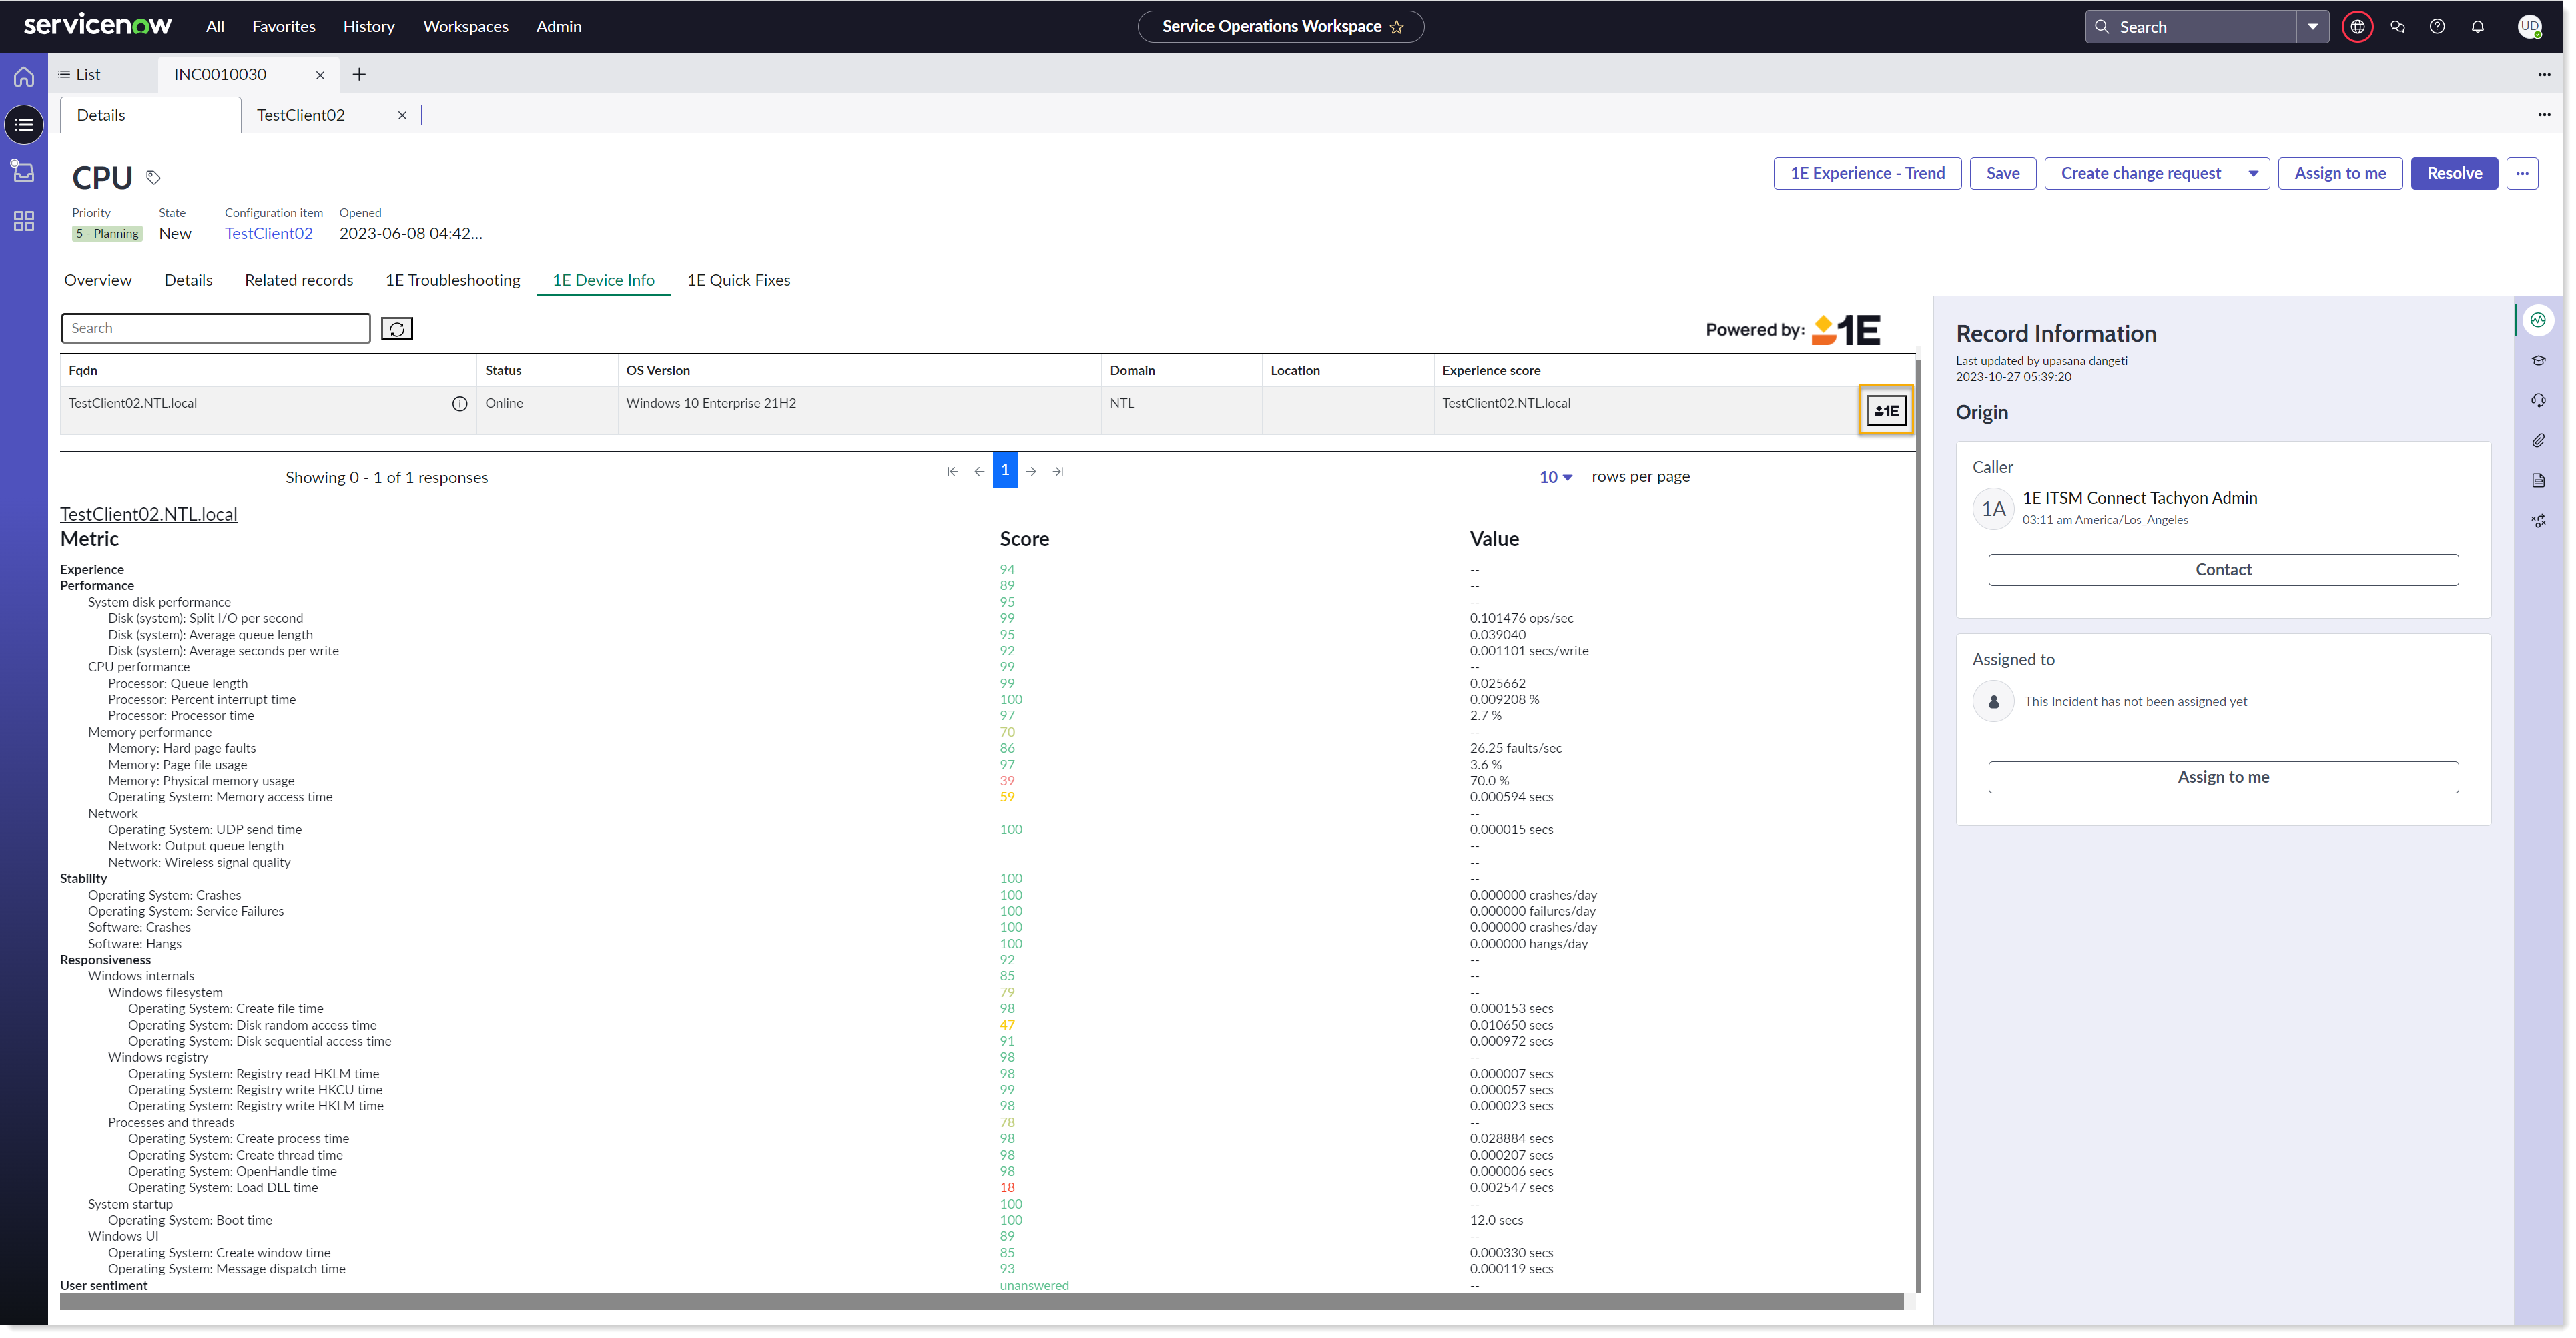
The Experience data for the selected device is now displayed, as shown in the picture below.
Experience Score for an Incident in Agent Workspace-
Experience Score for an Incident in Service Operations Workspace-
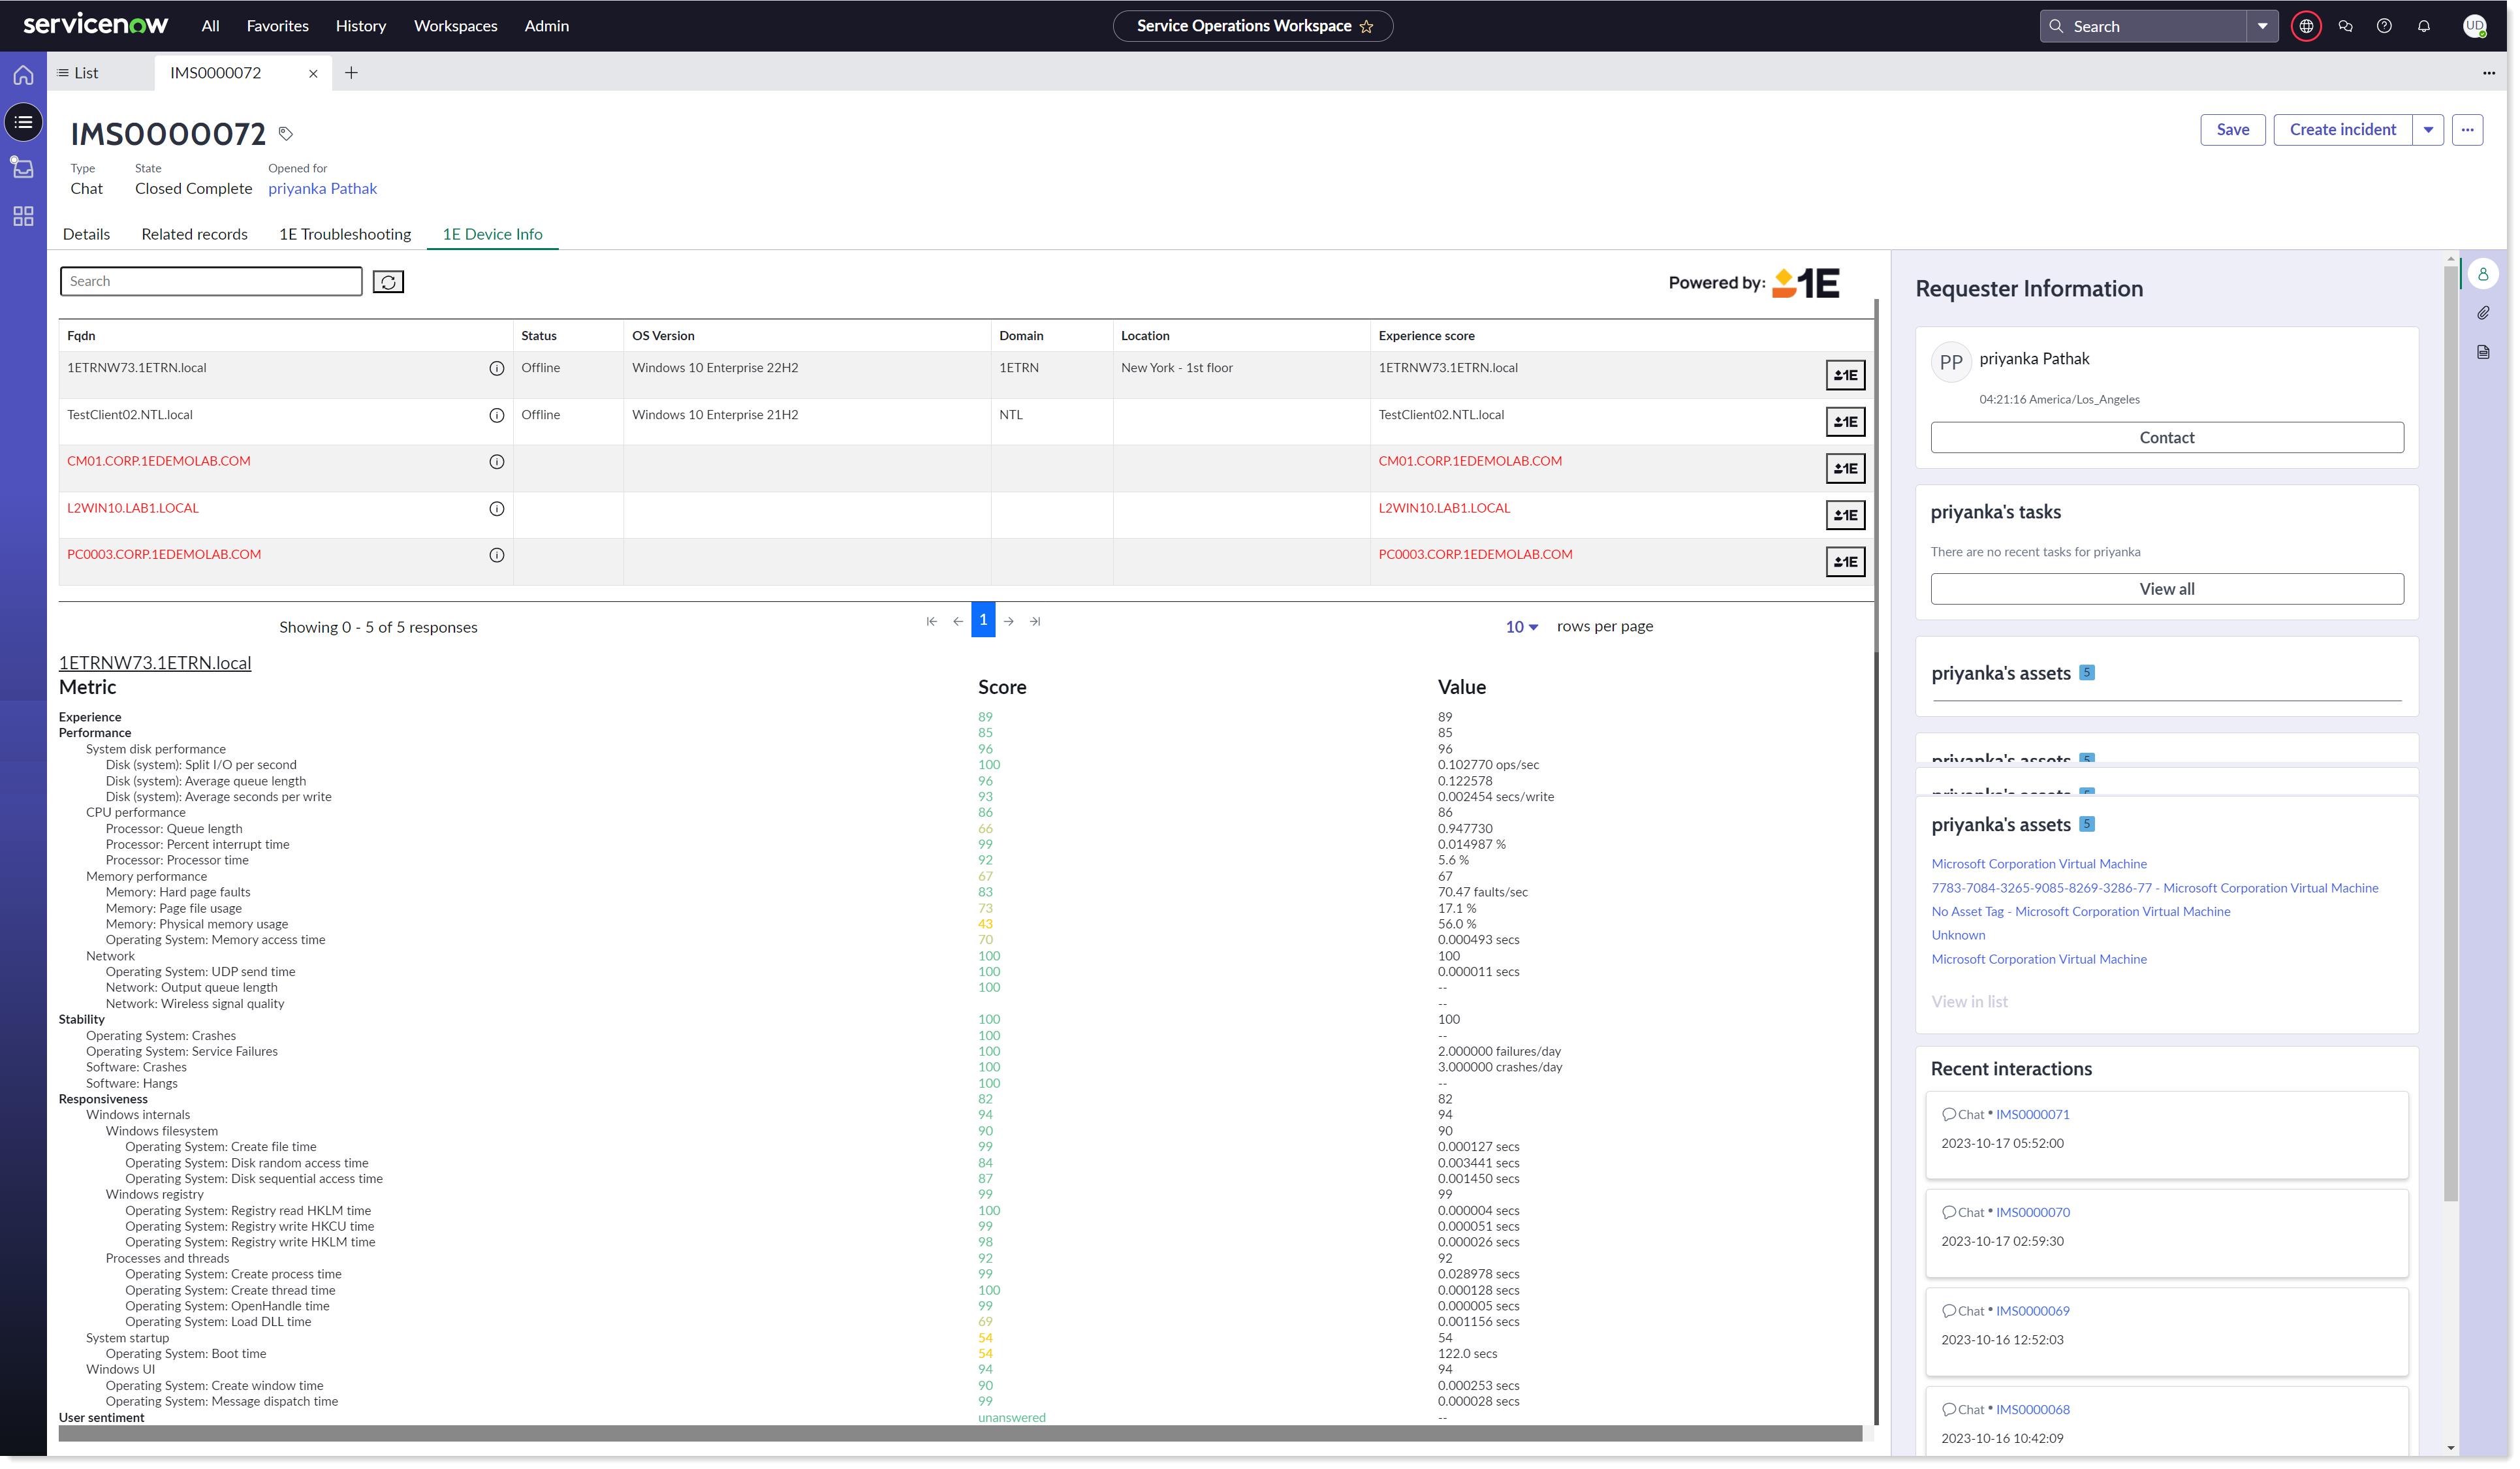
Experience Score for an Interaction in Service Operations Workspace-
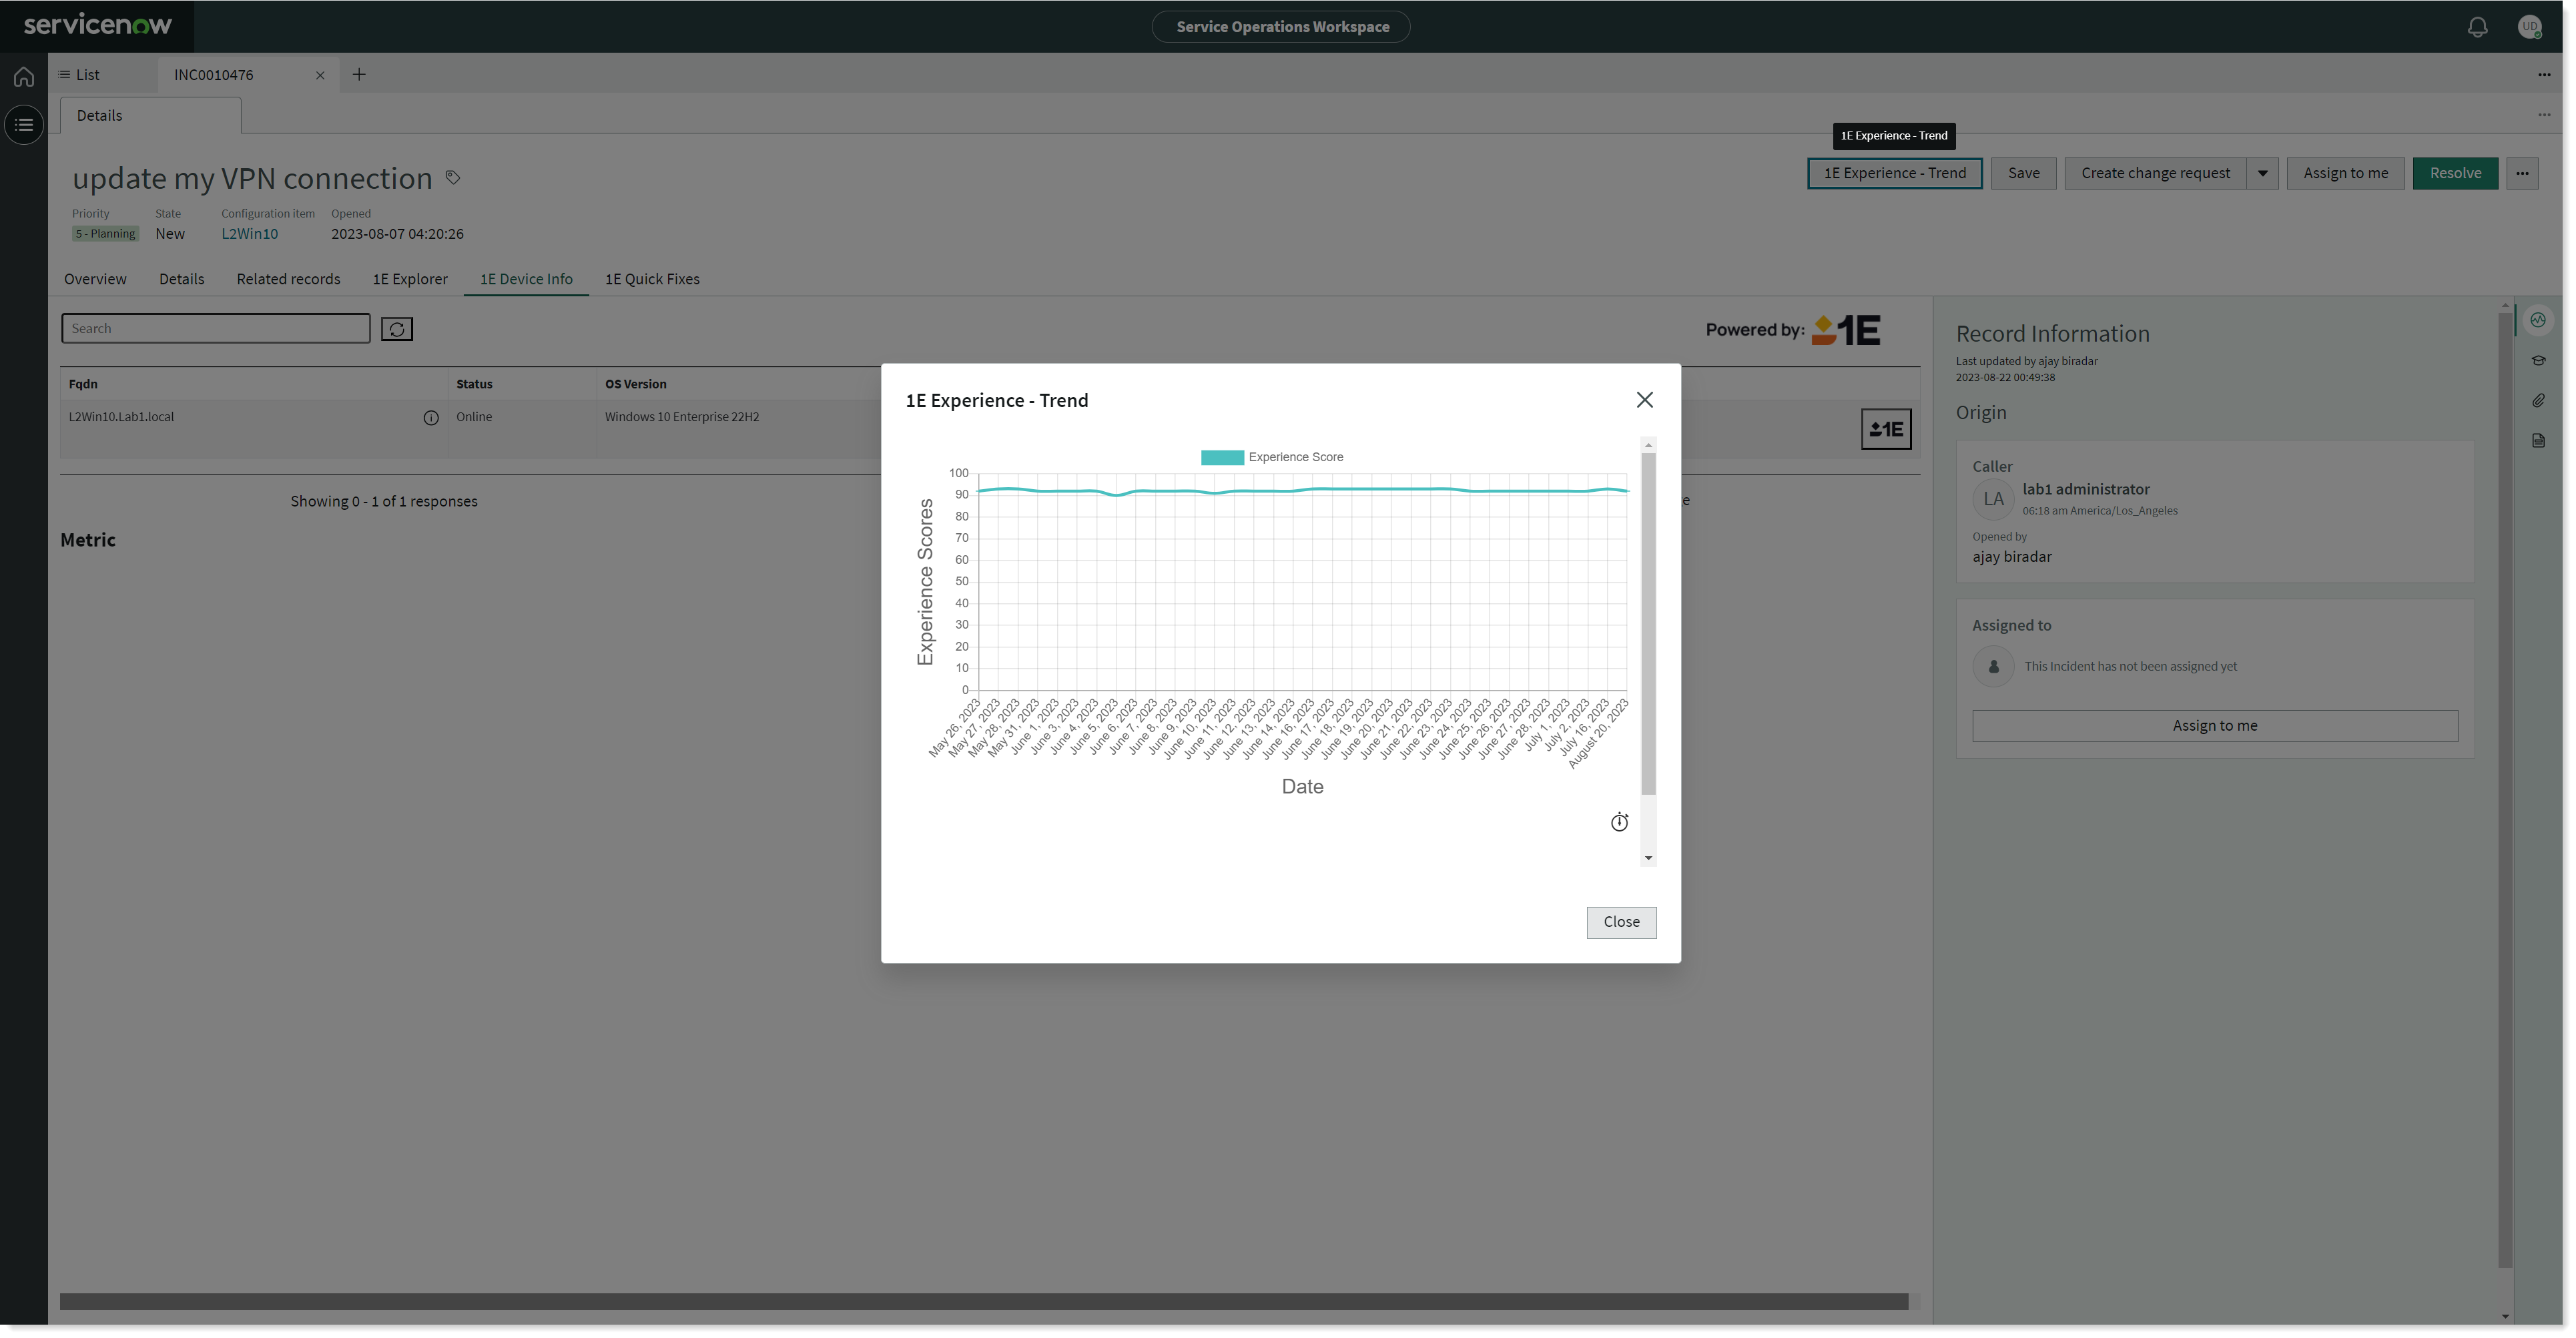
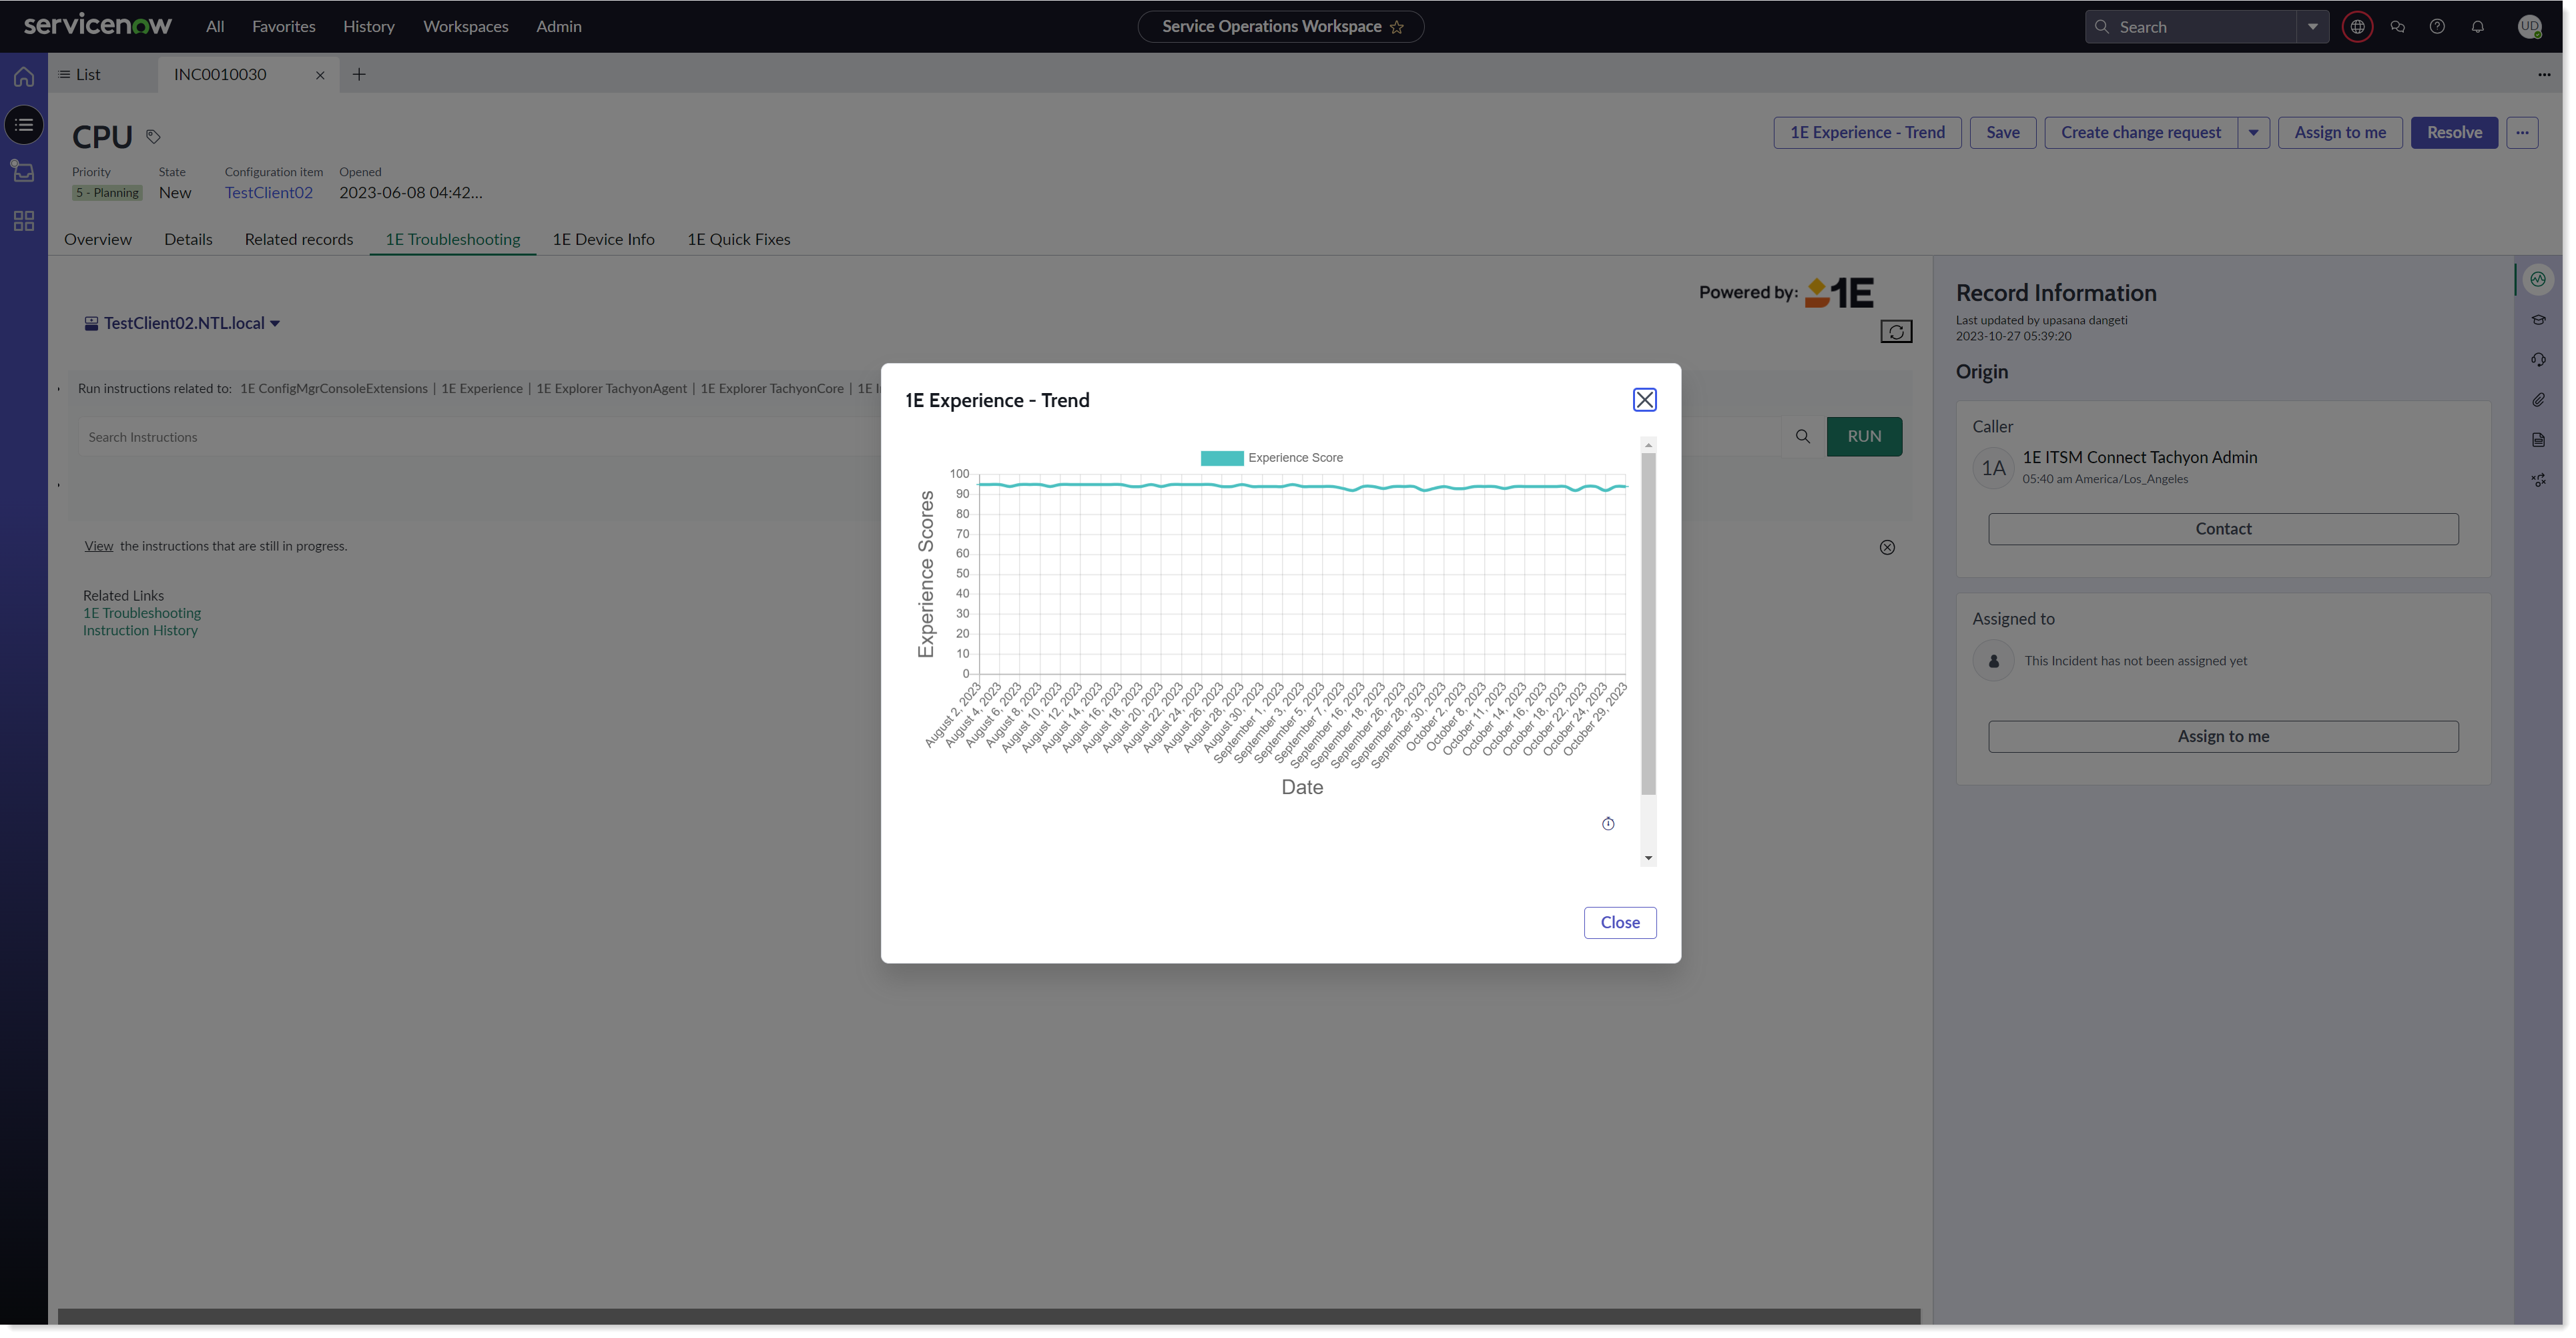
Service Operations Workspace also fetches real time experience score history for a selected device and shows the experience trend.
To view this trend line chart, click on the 1E Experience - Trend button given at the top of the page, as shown in the picture below. Note that this button is visible only when the Configuration Item is populated or there is at least one affected CI.
The trend line chart is displayed only for the selected device on the Configuration item field.
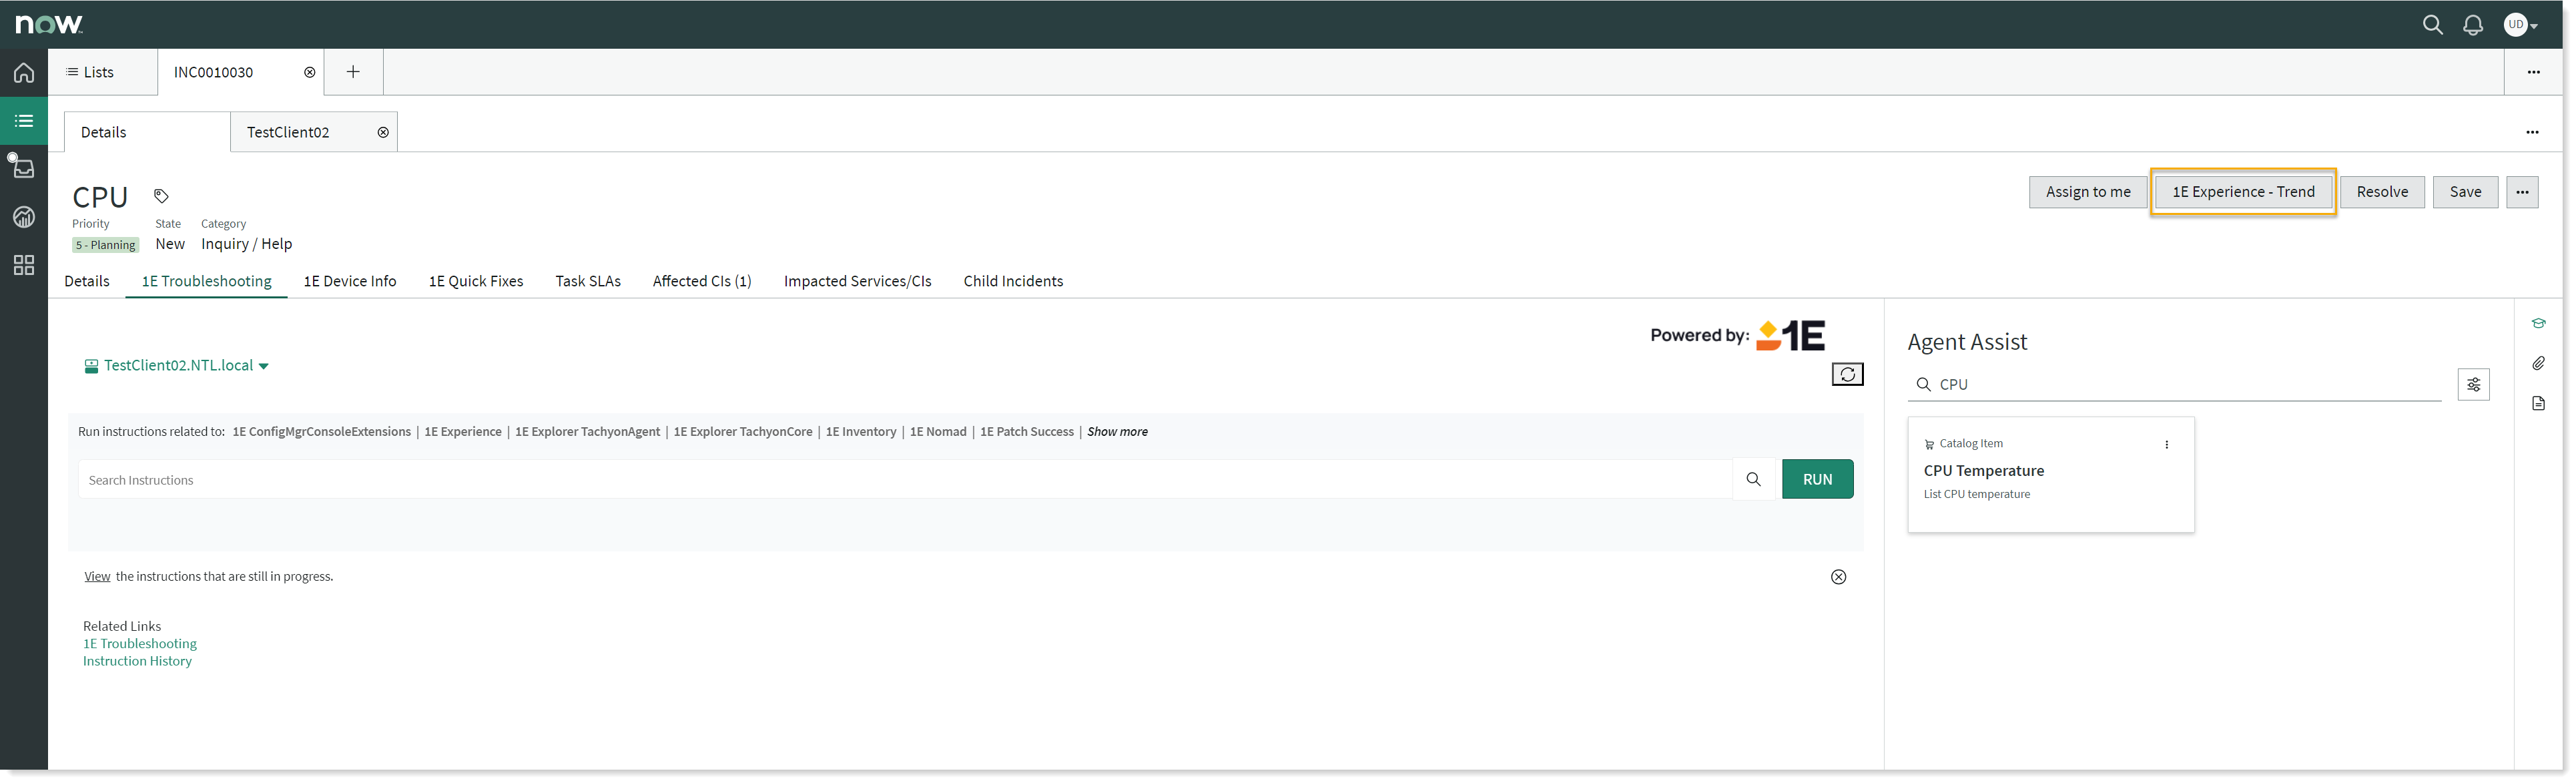
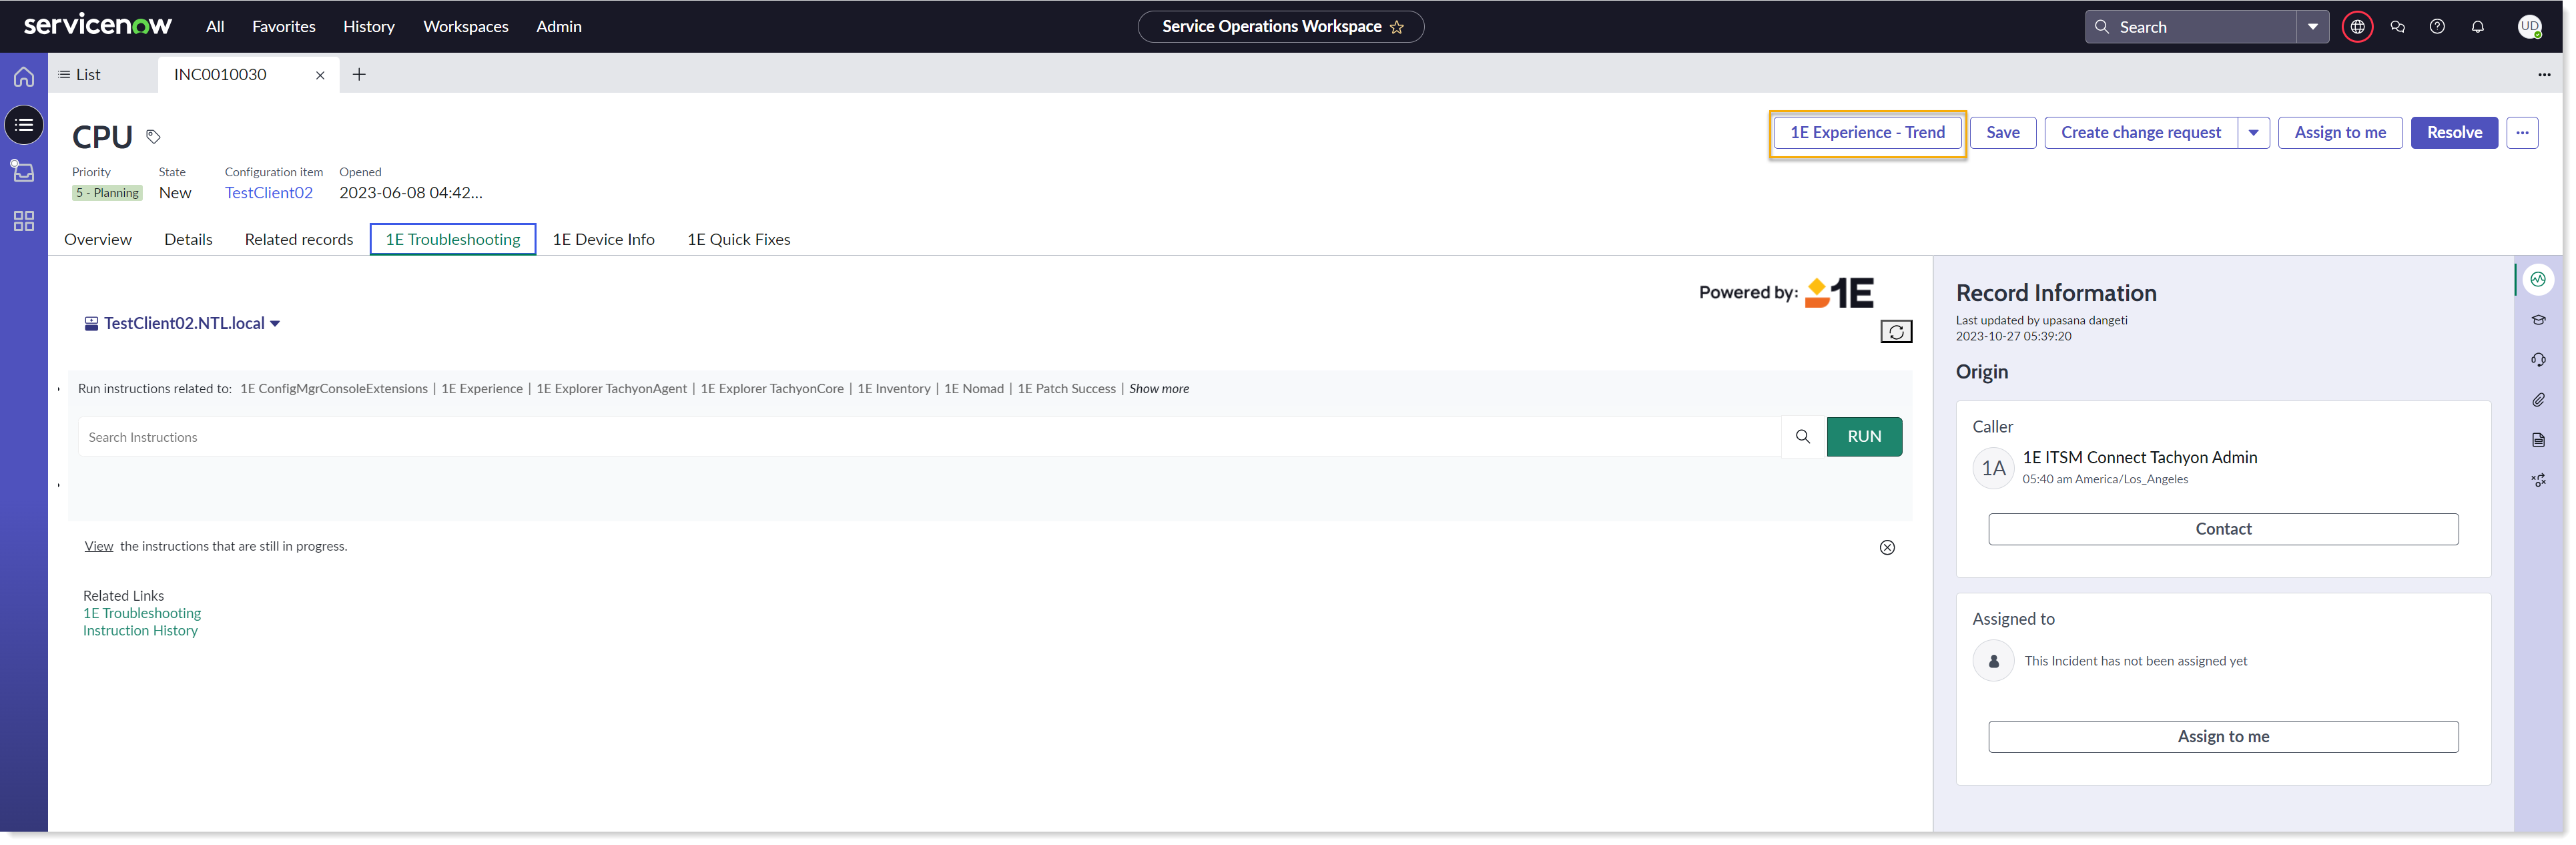
Experience Trend chart in Agent and Service Operations Workspace
Experience Trend chart fetches the real time Experience Score history for a selected device. This button is visible only when the Configuration Item is populated or there is at least one affected CI.
The trend line chart is displayed only for the selected device on the Configuration item field.
To view this trend line chart, click on the 1E Experience - Trend button given at the top of the page, as shown in the picture below.
Experience Trend chart in Agent Workspace -
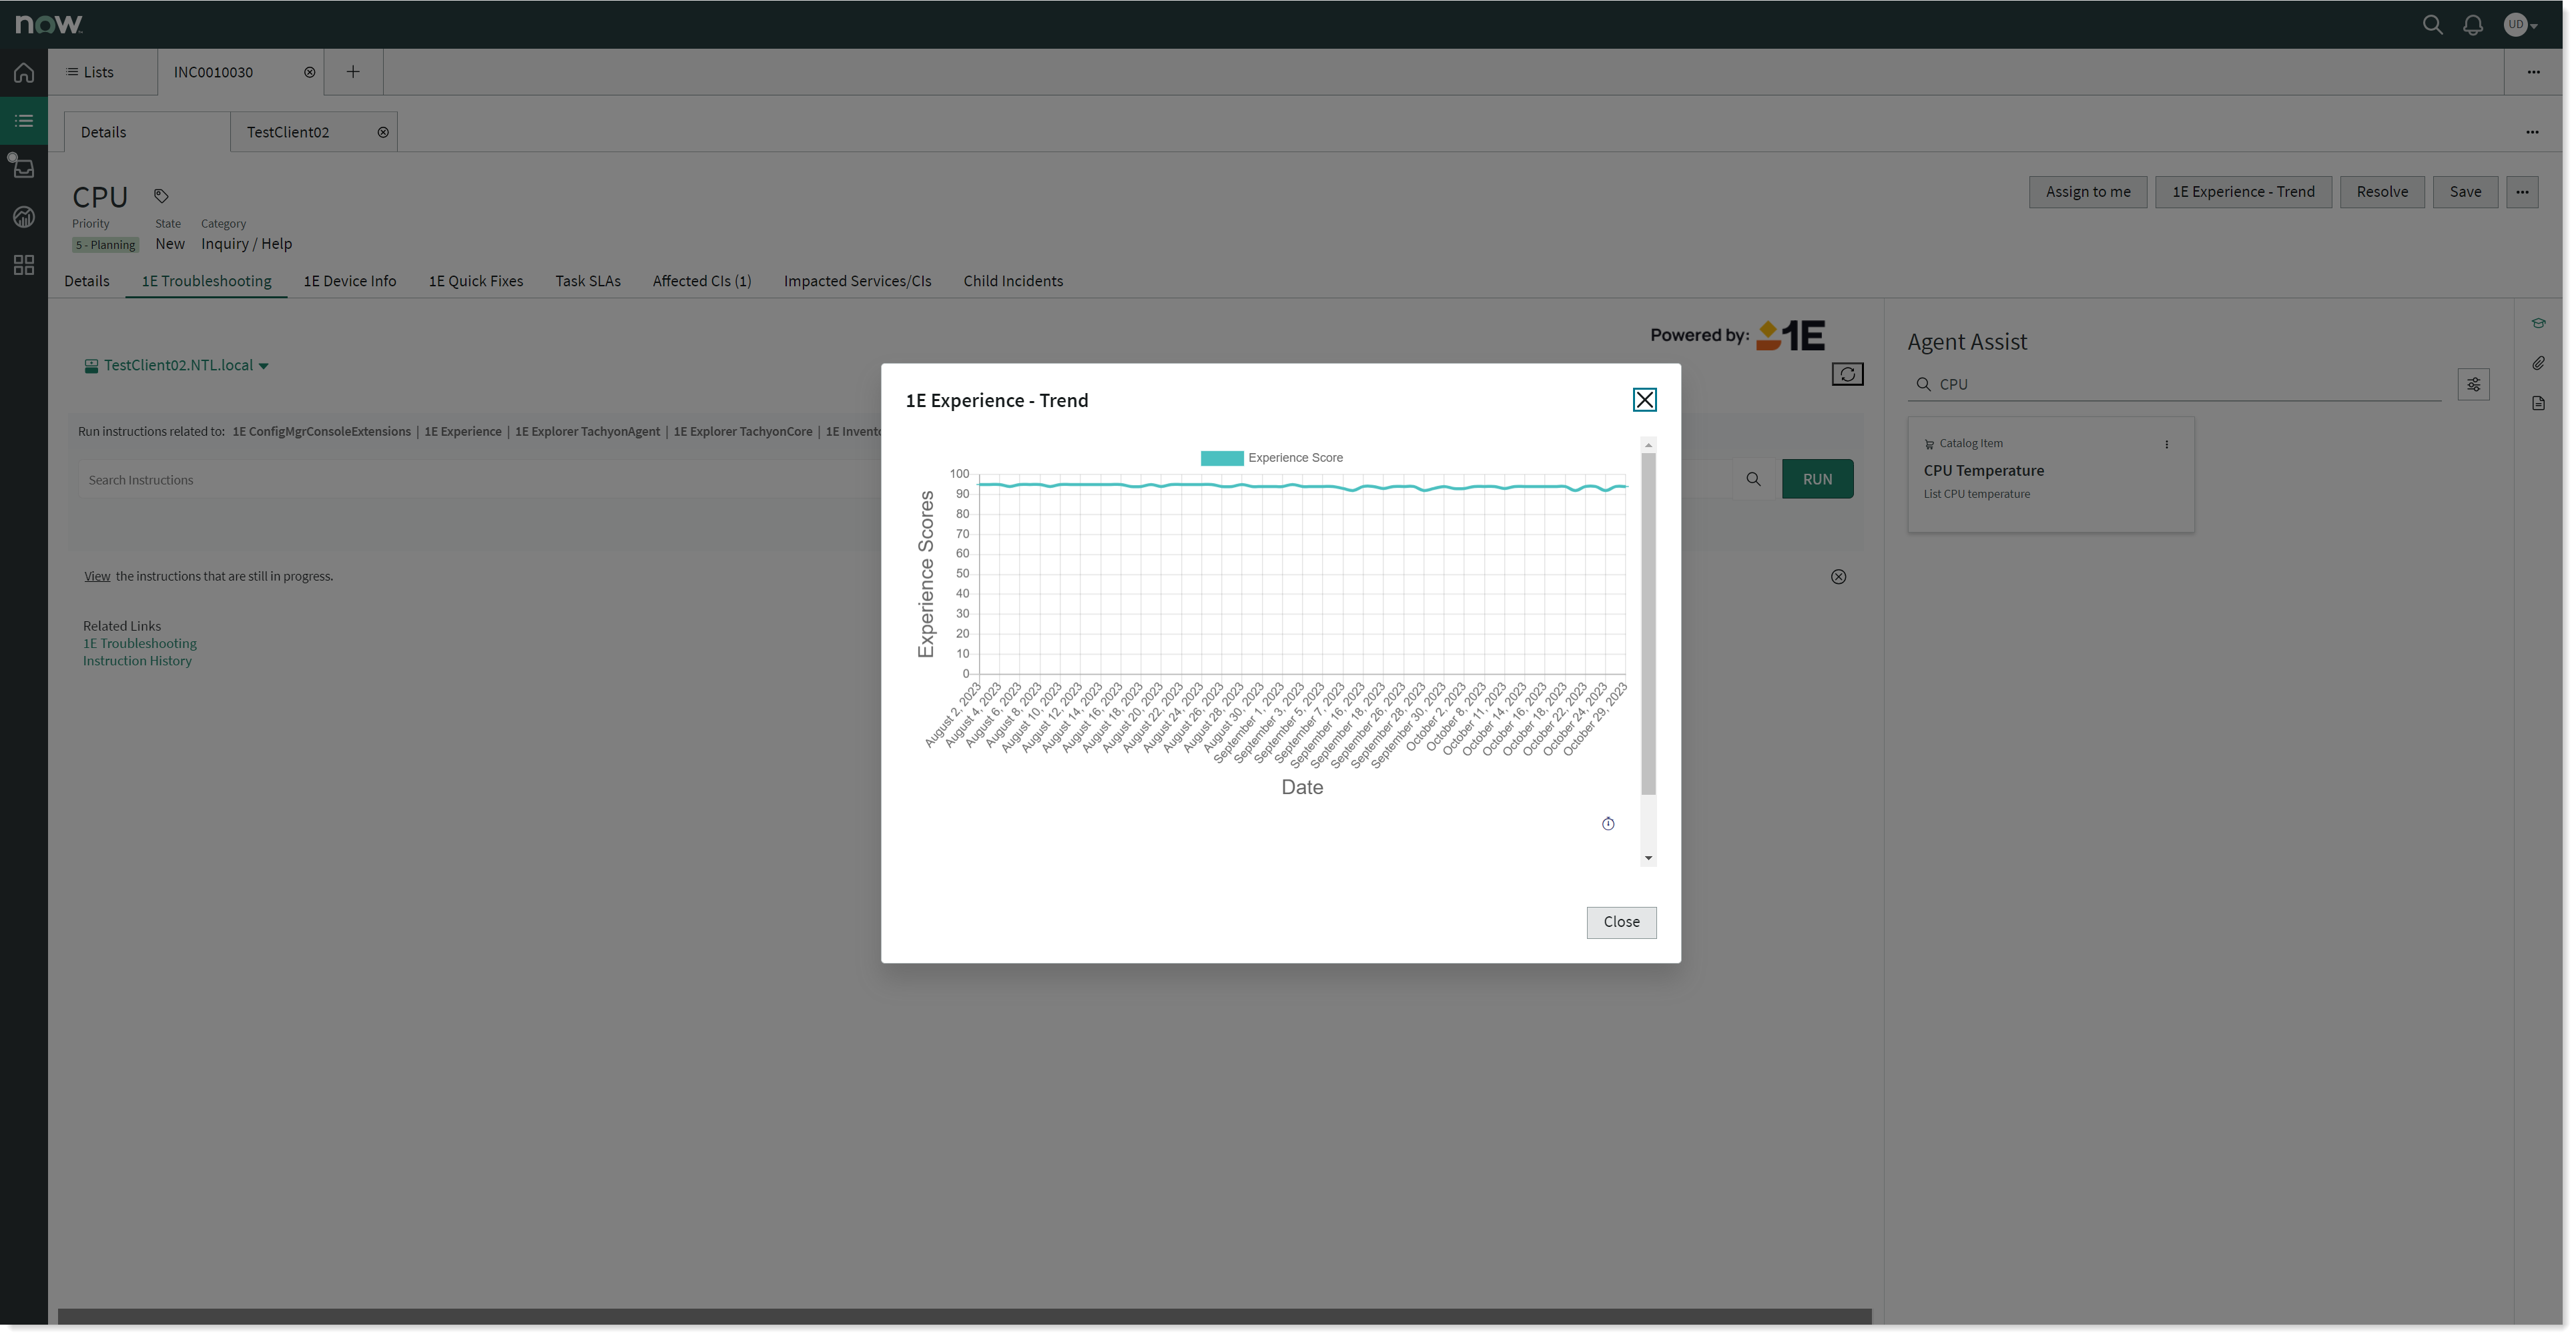
Experience Trend chart in Service Operations Workspace -
Remediating issues
When you click on the 1E Experience tab to view the experience score for a selected device in Native UI, the REMEDIATE button appears on the right as shown in the picture below.
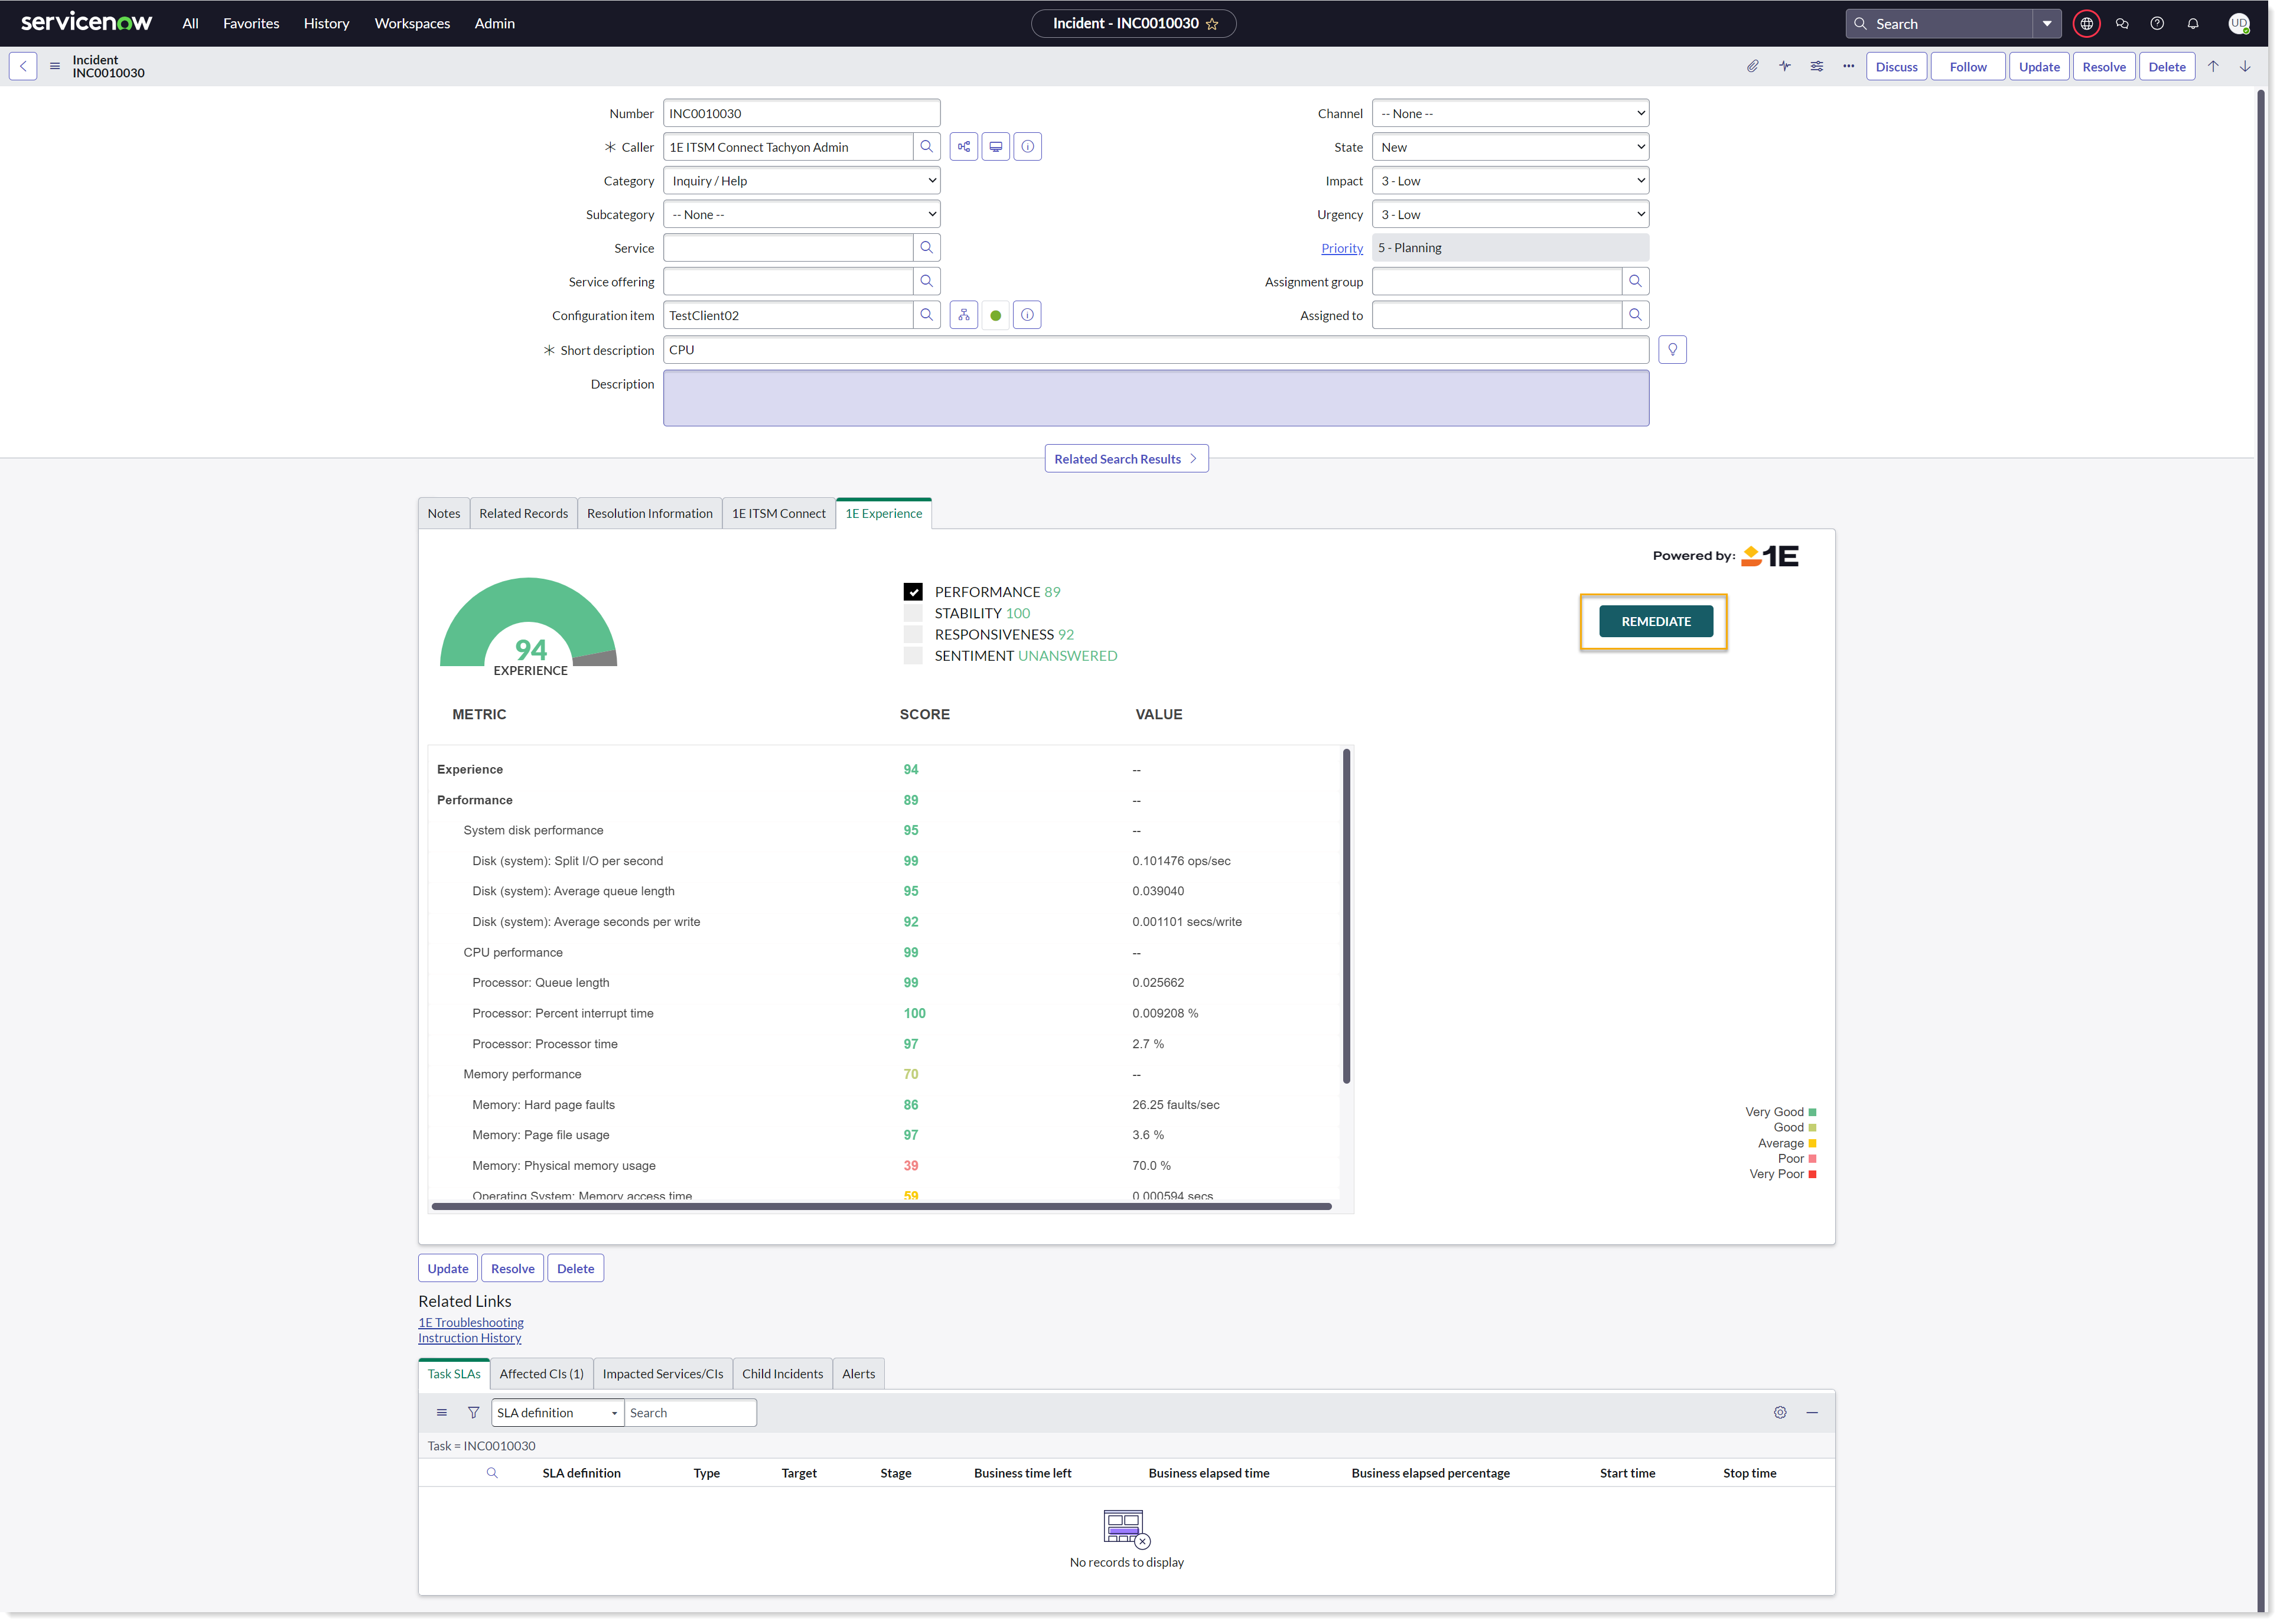
With the help of REMEDIATE button, you can immediately select and run instructions with the scope set to the selected device. Clicking the button displays the 1E ITSM Connect tab, where you can search for and run instructions, as shown in the screenshot below.