User sessions
The User Sessions page displays high level details around all sessions, as well as the ability to filter and sort based on different parameters, and then view individual sessions.
Metrics and KPI
At the top of the page are four main KPIs useful for VDI, these are:
Sessions
VDX Score
Average Logon Duration
Average Roundtrip Time.
You can hover over the  in the UI to understand more how these KPIs are defined.

Page options
There are a number of options available at the top of the page, these are:
Option | Description |
|---|---|
Site | You can select which Citrix Site you are viewing the VDI deployment for. |
Time | Use the Time dropdown to view the infrastructure topology at a previous moment in time. NoteThe Time option allows you to go back up to 7 days. |
Refresh | The Refresh button can be used to refresh the page. |
Fullscreen | The Fullscreen button can be used to maximise the view, removing the page header and left-hand navigation bar from view. 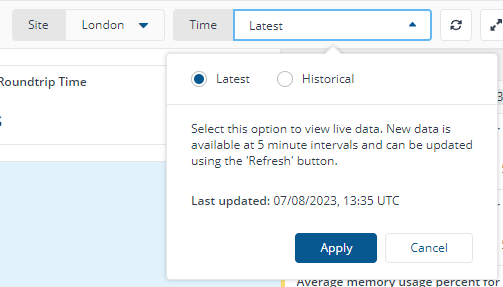 |
Sessions Status | Use Sessions Status to filter the entire page by the status of that session. 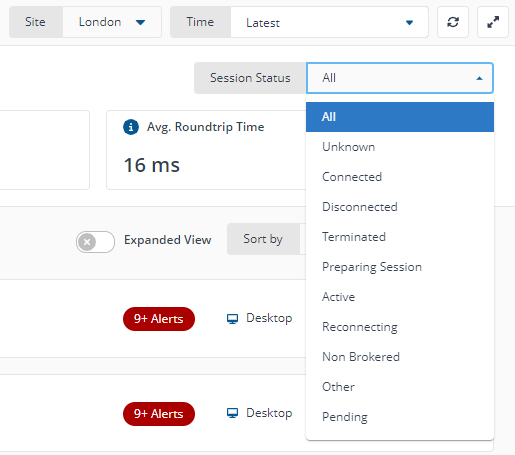 |
User sessions list
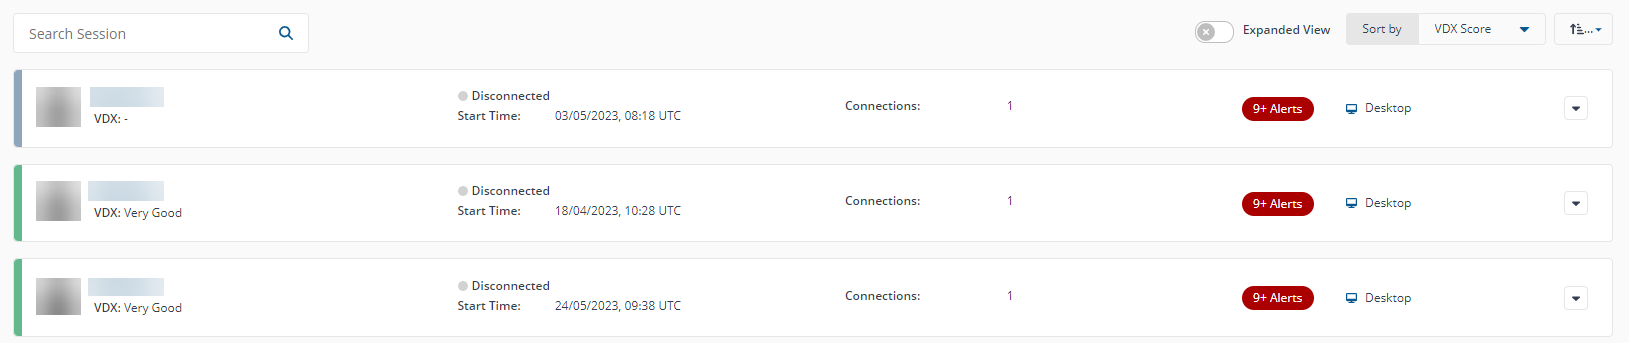
In this section you can view a list of sessions. You can filter, sort and access the following options:
Search - you can search for sessions using the name of the user, and FQDN
Expand View - you can expand the view to show additional detail per session on the list
Sort By - you can sort by numerous options including VDX Score, Start Time, Session Duration, Connections, Logon Duration, Roundtrip Time
Sort Ascending/Descending - use this button to sort the above ascending or descending.
Below these options, you can view a the list of user sessions. This includes numerous key bits of information, including visibility of alerts. Click into a row to view that session in detail in its own page.
User session page
This page shows additional information around a specific user session, including the VDX score, Desktop Group, when the session started, it’s duration, logon duration, and roundtrip time.
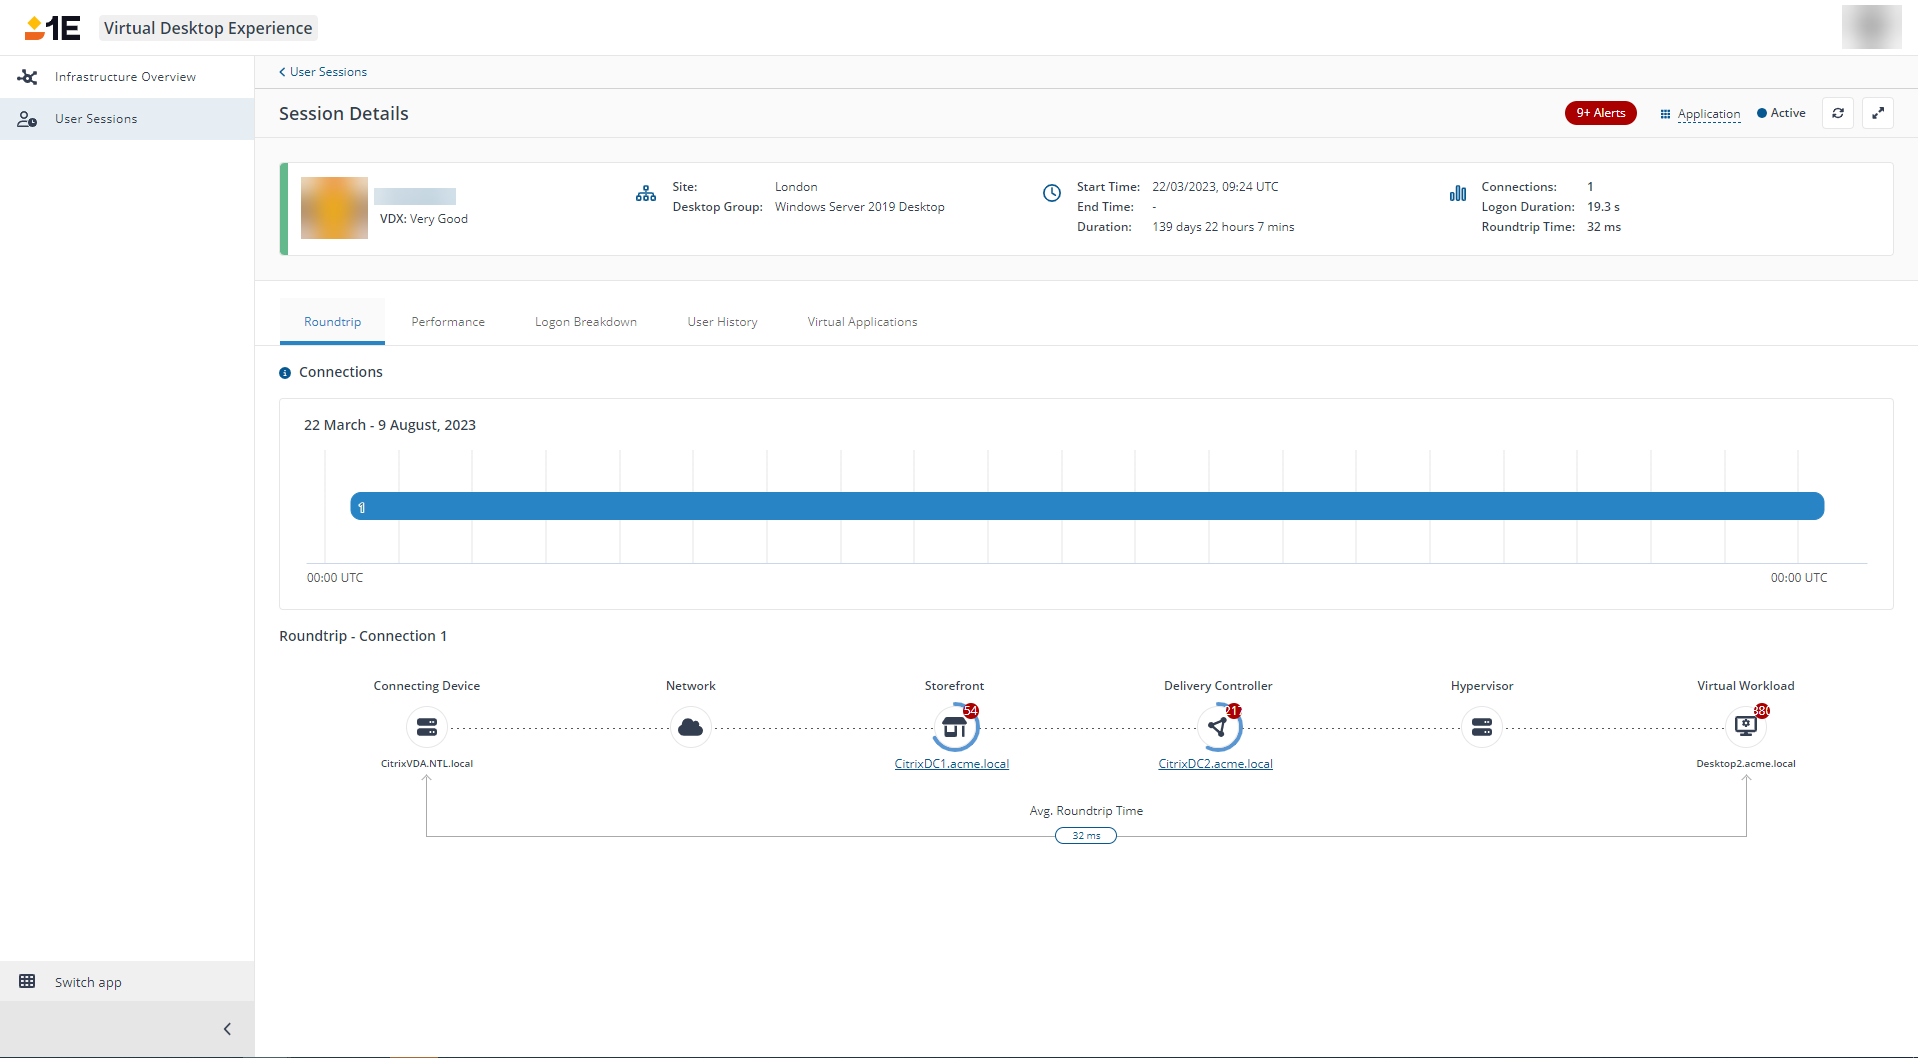
It also includes number of tabs with additional information:
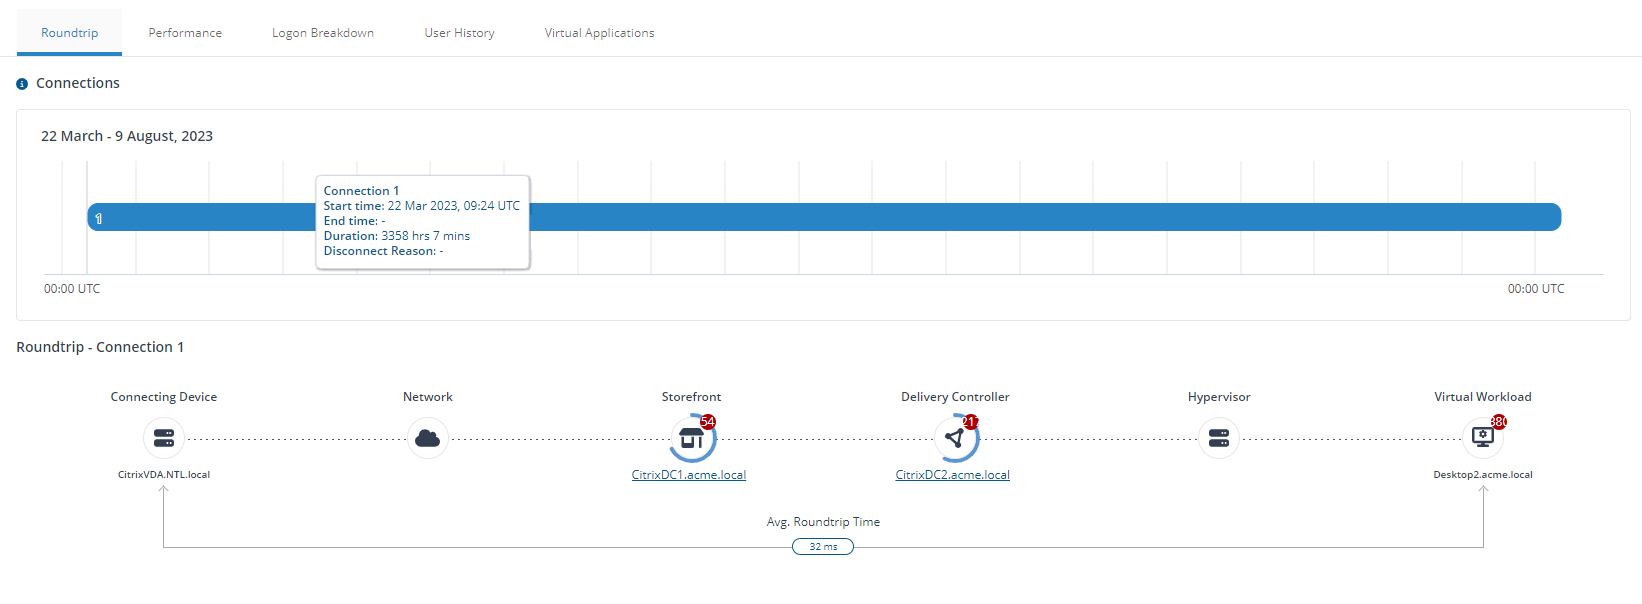
Roundtrip - displays all the relevant parts of the VDI used to broker that user session
Performance - displays time series charts showing VDX score, round trip time, and virtual workload (CPU and Memory) data. Any alerts generated will also display overlaid over the graph for Virtual Workload.
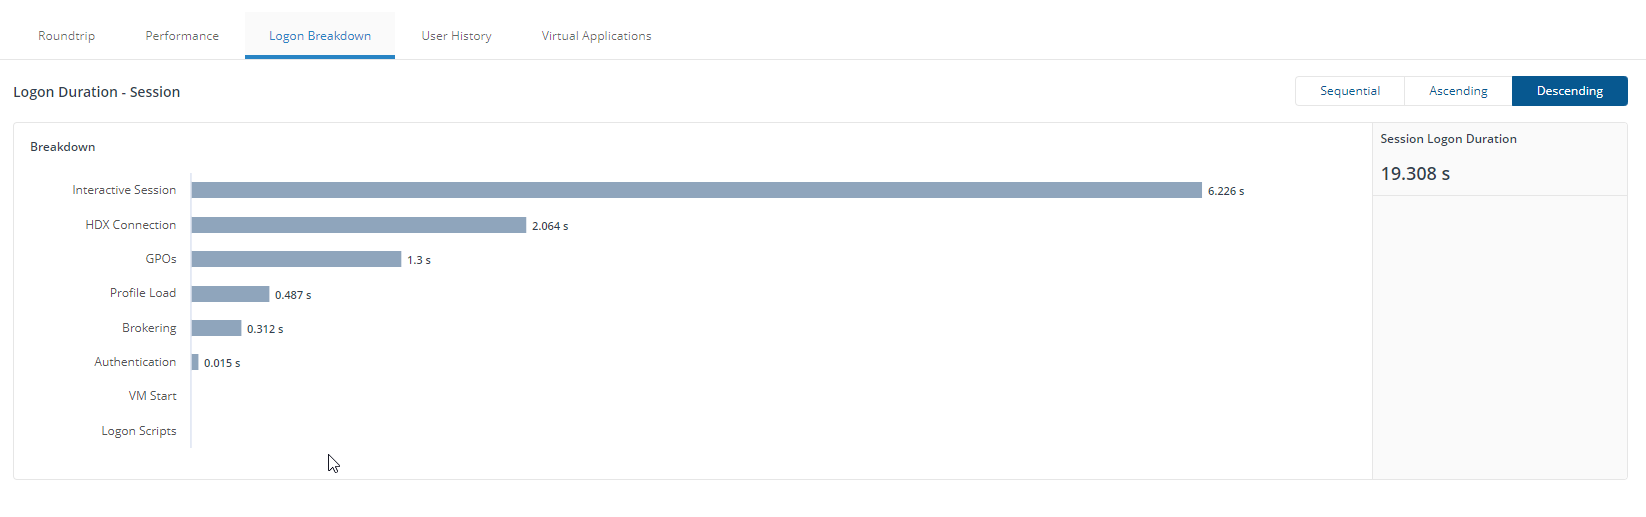
Logon Breakdown - shows the breakdown of how long different elements of the logon process took. For example GPOs, profile load, authentication, and more.
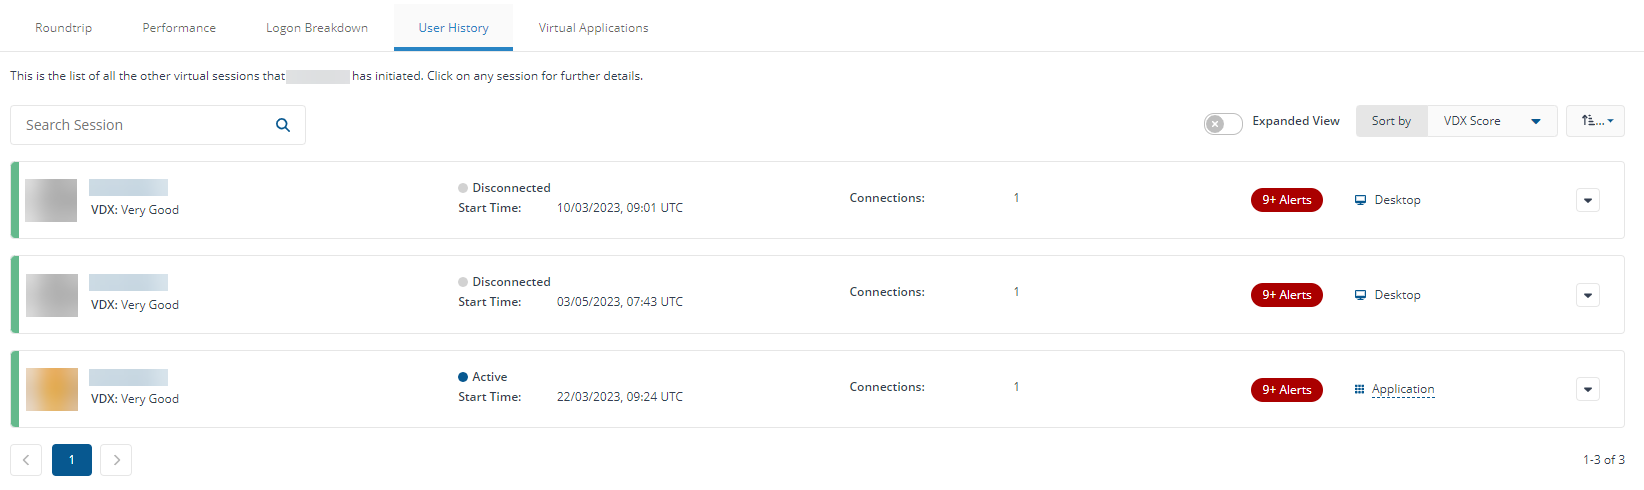
User History - displays previous sessions for that user, going back up to 28 days.
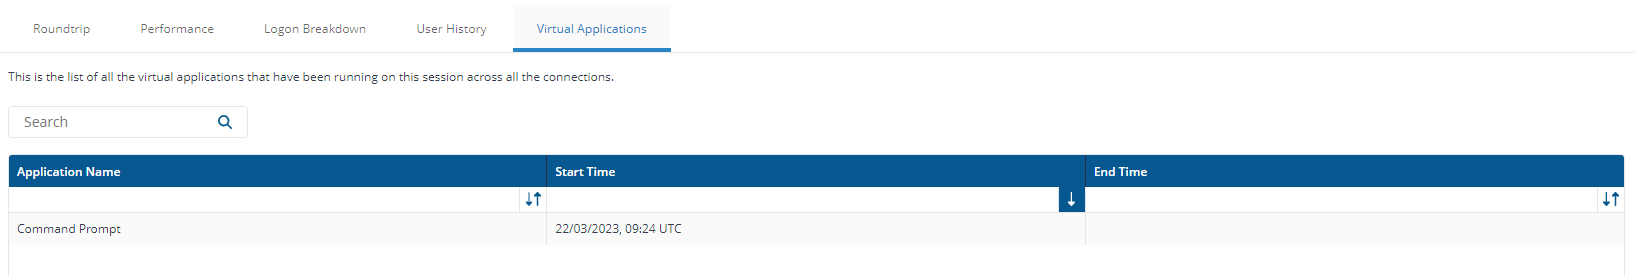
Virtual Applications - view published applications running as part of this session, across all connections.