Piloting NightWatchman Enterprise
In this example, we show how to install NightWatchman Management Center on a representative group of pilot computers to enable 1E NightWatchman Agents to report power consumption behavior from their respective hosts. We then show you how to create reports detailing the savings that can be made when rolling out NightWatchman Management Center across all computers on the network.
Once the environment is set up, expect your pilot to take up to a month to complete – it depends on how much information you want to collect for your analysis. The longer the pilot, the more accurate the figures are likely to be.
Selecting computers for the pilot
For the pilot, select a cross-section of computers (desktops and laptops) that are representative of those for roll-out. Also include a server hosting the NightWatchman Management Center components and database.
The server hosting the NightWatchman Management Center must not be a domain controller, though it must be a member of a domain. Set it up as follows:
Category | Notes |
|---|---|
Windows server OS |
|
SQL Server | SQL Server must be configured to use a case-sensitive, accent-sensitive collation as the server default (the preferred collation is SQL_Latin1_General_CP1_CI_AS)
|
Web server | IIS Windows authentication must be enabled.
|
Runtime libraries | .Net is used by NightWatchman Management Center components except the database, refer to Using the core components for more information. Silverlight is only used by Enterprise View, refer to Installing Enterprise View for more information. You will be prompted to install it if it is not already available.
|
To ensure a wide representation of your pilot computers, you should consider the following:
Consideration | Explanation |
|---|---|
Hardware | Choose computers that provide the same ratios of hardware as used throughout the entire organization. |
Users | Select several users from each department and role because of the way they use their computers, IT staff are usually not representative of the user population. As a rule, when implementing NightWatchman in its reporting mode, it is best not to inform target users as this may cause them to change their habits which will affect results. |
Time zones | If your organization has remote sites include some samples from those as well; there may be different behaviors depending on location. |
Number of computers | The number of computers in the pilot should be:
|
APM or ACPI-capable | Client computers included in the pilot must be APM or ACPI-capable and running Windows 8.1 or Windows 10. |
The simplest way to install is to run the installer with a domain account that has local administration privileges and then use this account as the Console service account.
Note
The default installation for NightWatchman Management Center sets the account used to run the installer as the primary NightWatchman Console Administrator account. If you want to open the NightWatchman Console after installation, initially this may only be done by the primary NightWatchman Console Administrator account. Once open, the NightWatchman Console can be used to assign other domain accounts rights to open and use the NightWatchman Console as necessary. For this pilot, opening NightWatchman Console is unnecessary.
The local administrator should have the following:
Full rights to the SQL database
Log on as service enabled.
Installing NightWatchman Management Center
Install NightWatchman Management Center and NightWatchman Management Center Analysis Reports Wizard on a suitable server. The agents are installed on all client computers in the pilot group.
For the purpose of this pilot, you need two .MSI installers:
NightWatchmanManagementCenter.msi
1ENightWatchmanAgent.msi or 1ENightWatchmanAgent-X64.msi
Note
If you also want to test wake-on-LAN functionality, install the 1E Client with the WakeUp module enabled, refer to Tachyon - Deploying Tachyon clients for details.
For the pilot, you can make a default NightWatchman Management Center installation by running NightWatchmanManagementCenter.msi .
Select the defaults values except for:
License agreement screen – accept the terms in the licence agreement
Service account information – set the details for the account that is used to run the NightWatchman Management Center Console service. Set this to a domain account with local administration privileges, full rights to the SQL database and is able to log on as a service.
Environment setup – select the size appropriate to the pilot group. In most cases, choose Very Small (between 10 and 50 client computers).
On each of the pilot client computers, install the 1E NightWatchman Agent using a command-line, for example:
msiexec /i 1ENightWatchmanAgent.msi REPORTINGSERVER=<RepServ> REPORTING=ON /qn
where <RepServ> is the FQDN (recommended) or NetBIOS name of the server where NightWatchman Management Center Web Service is installed (the local server for your pilot).
Gathering data
At this point, NightWatchman Management Center is installed and the agents are configured. They will now be reporting power state and other client information back from their host computers. Leave them for a period of time, long enough to gather sufficient behavioral information to accurately calculate the power savings that can be managed using NightWatchman.
Note
At this stage, we advise that you contact 1E and import the baseline power consumption figures for the hardware in your pilot.
The first two days or so will not be useful for reporting purposes as there will be a lead time between installing the clients and getting the data returned to the NightWatchman Management Center. The last two days of the pilot are also likely to have only partial results. For example, laptops that have been disconnected from the network may not yet have had a chance to send back their data.
The core set of data should be a minimum of a week, ensure that one weekend is included. So, a minimum start-to-end is eleven days. Two, at the beginning to disregard, seven days covering the week's worth of data and two days at the end to enable all the computers in the pilot to have returned their data for the central week.
The NightWatchman Management Center Analysis Reports Wizard initially searches for 28 successive days where the majority of computers in the pilot have returned data. So an optimal period would be thirty two days to allow for the four days at the start and end that may be disregarded.
Running the NightWatchman analysis reports wizard
This report uses data returned by the agents to generate the report for savings that can be made by implementing an automated nightly power-down routine on the pilot computers. It then extends these findings to cover all the computers in the network.
To run the wizard:
On the Start Menu, click the Analysis Reports under the NightWatchman Management Center menu item.
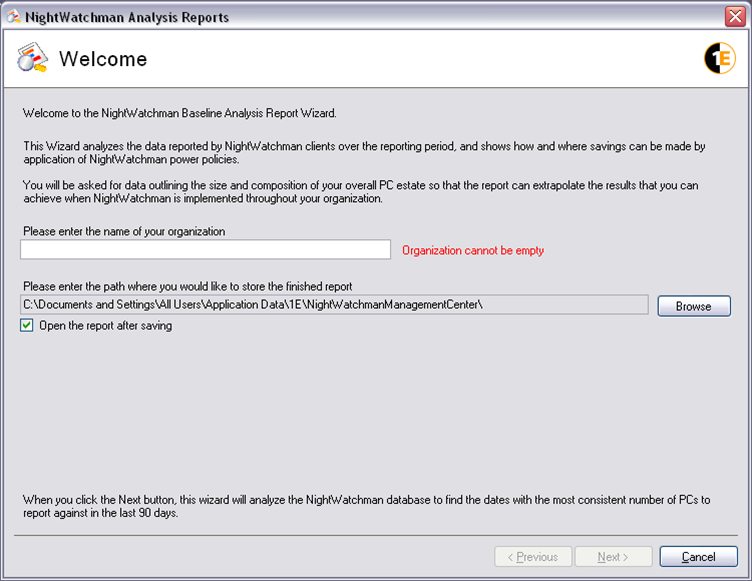
On the Welcome screen, enter the name of your organization. If you want to save the report in a different location, click Browse and choose a new location. If you want to open the report after saving it, check the Open the report after saving box. Click Next.
On the Select Report Range screen, select a sample of data representing where the majority of computers on the network reported in with data and with minimal variation on the number of computers reporting. This forms the basis for the savings report. By default, the wizard searches a period of 28 days; if it cannot find anything that meets the criteria it will search for a period of 21 days. If that fails, 14 days and finally 7 days. If no suitable data set is found, you will need to manually choose the reporting period.
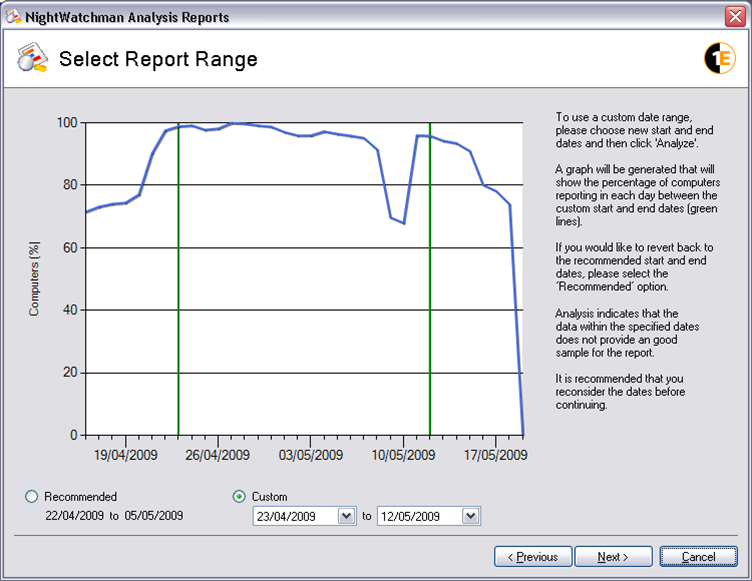
If you want to report on a particular date range, choose Custom and enter the start and end dates for it and click Analyze. In our example, the data is mostly suitable except for a dip in the number of computers reporting in towards the end of the selected period – the commentary (to the right of the graph) provides tips on the charting. Click Next.
On the Data Input screen, set the context for the report for the:
Projected total number of PCs - the number of computers in your organization
Proposed wake-up time
Proposed power down time
Percentage of desktop PCs - the percentage of computers in your network that are desktop computers compared to laptop computers
Cost of electricity per kWh - the cost in your locality - this will be marked using the local currency of the computer where the report is being generated
Carbon conversion factor - for your locality and units for carbon conversion - either kg/kWh or lb/kWh
The report generator uses these values to calculate the savings made and extrapolates them to the network as a whole. In our example, we have a network with 10,000 computers rrunning NightWatchman. The wake up and power down times are 8am and 6pm respectively. 44% of the computers are desktops. The cost of electricity is 10cents/kWh and the carbon conversion factor is 0.72kg/kWh.
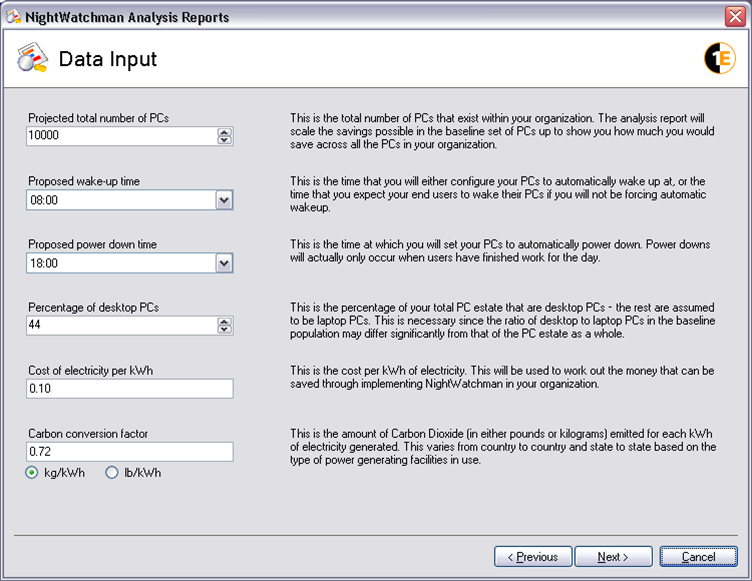
The default value that appears for the projected total number of computers is the total number of computers that reported into NightWatchman during the report date range. The graph in the report will show the percentage of computers which reported in each day during that period. The example below shows a network where there are 10,000 computers running NightWatchman. The wake up and power down times are 8 AM and 6 PM respectively. 44% of computers are desktops. The cost of electricity is 10 cents per kWh and the carbon conversion factor is 0.72 kg/kWh. Click Next.
On the Windows Power Scheme screen, include periods where an aggressive Windows power scheme is set during working hours. Give this careful consideration as there is a trade-off between saving extra energy and potential impact on user productivity through having computers powered down during working hours during periods of inactivity.
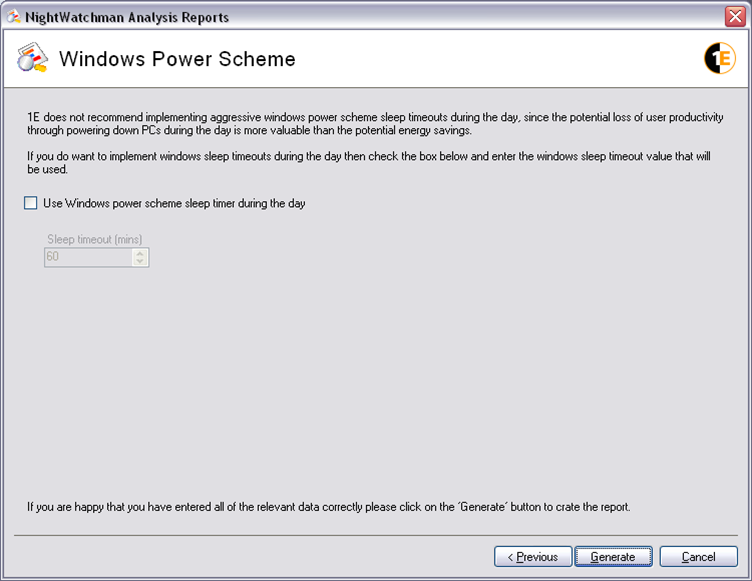
If you check the option and set a timeout for the power scheme, an additional heading appears in the generated report detailing the savings to be made from implementing the scheme. Click Generate.
A progress bar is displayed while the report is being generated.
Viewing the NightWatchman Analysis Report
The NightWatchman Analysis Report contains a number of sections that provide a detailed level of analysis for the sample data and the predicted savings, including descriptions of its content so the report is completely self-contained. The main section is the Management Summary that provides the baseline figures on energy, cost and CO2 emissions savings.
The report shows the potential savings that can be made by implementing a NightWatchman power down policy across a network. If you checked the Open the report after saving checkbox on the Welcome screen, the report automatically displayed after creation. Otherwise, you will need to browse to the directory where it is saved to open it.
This example shows the head of the report generated for the ACME company:

An overview of the basic information provided under each heading is outlined in the following sections:
Management summary
Baseline analysis
Potential savings
Further data analysis.
Management summary
This is the foundation of the report, providing bottom-line figures on savings that can be expected. It details the number of clients in the sample and the duration for the sample data, and describes the electricity and cost savings and effective reduction in CO2 emissions that can be made by implementing NightWatchman across the entire network.
Baseline analysis
Provides details of computer behaviors and power scheme compliance for the baseline. The User Behavior heading shows an average of the percentage of hardware (desktops, laptops and desktop monitors) in the sample that were on during weekday and weekend hours. The Power Scheme Settings heading shows the monitor timeout and sleep timeout settings for the computers in the sample, split into desktops and laptops.
Potential savings
Identifies the main areas where savings would be made:
Header | Explanation |
|---|---|
Savings Due to Powering Down Overnight | Shows, for an average week day, the potential savings that can be made by powering down computers overnight. |
Savings Due to Powering Down Over the Weekend | Shows, for an average weekend day, the potential savings that can be made each day by powering down computers over the weekend. |
Savings Due to Enforcing Power Schemes | If you checked the Use Windows Power Scheme sleep timer during the day checkbox on the Windows Power Scheme screen, this section will also include the heading Savings Due to Enforcing Power Schemes, which shows the amount of energy that would be saved as a result of enforcing a power scheme during the day. |
Total Savings | Describes the annual energy and cost savings that can be made by using NightWatchman to power down computers overnight and enforce more effective, energy saving, power management schemes. The chart shows the current average kWh of energy used per computer per day based on the measured values from the baseline. The average is derived and displayed according to the particular day of the week, thereby taking into account differences in behavior for each day. Overlaid on the current average are the calculated potential savings that can be made and the resultant final energy use showing exactly where the savings are being made. The calculation for the annual energy and cost savings is displayed below the chart and associated savings table. |
Carbon Savings | Highlights the amount of CO2 emissions reductions that can be achieved. To bring home the significance of this value, it relates the amount of CO2 emissions reductions to other means of achieving similar results. |
Further data analysis
Header | Explanation |
|---|---|
Operating System Split | Shows the OS in use in the baseline sample computers. More recent operating systems, are more efficient in terms of managing power consumption. Understanding the OS in use in the baseline sample helps to determine strategies for further improvements in energy usage. |
Hardware | Lists the top 10 most commonly used hardware models for the desktops, laptops and monitors in use in the baseline sample. |
Power Consumption | Shows the total of kWh used per day derived from the times that the computers and monitors in the baseline were in specific power states factored by the power consumption burn rates associated with their hardware types. A chart shows the daily power consumption for the baseline period broken down into laptops and desktops |
Assumptions and caveats | Lists assumptions made to calculate the values displayed in the report and caveats related to specific settings. |