Customizing Enterprise View
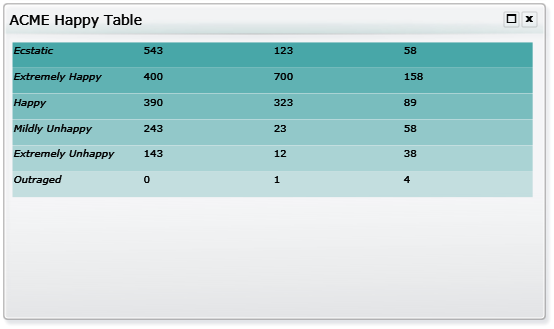
To illustrate how to customize Enterprise View, we are going to show you how to get the data from a database and display it as a chart as well as a table. Our example (ACME Corporation) uses a database that holds employee, customer and investor satisfaction ratings – the Happy table contains the following columns and data:
Happy states | Employees | Customers | Investors |
|---|---|---|---|
Ecstatic | 543 | 123 | 58 |
Extremely Happy | 400 | 700 | 158 |
Happy | 390 | 323 | 89 |
Mildly Unhappy | 243 | 23 | 58 |
Extremely Unhappy | 143 | 12 | 38 |
Outraged | 0 | 1 | 4 |
Note
Enterprise View ships with a set of XSD (XML schema defintion) files, which can be used when customizing tiles to validate the content and structure of the tile definition.
Displaying data as a chart
To display your data as a chart:
Define an SQL data source in the
DataSources.xmlfile located in the Enterprise View\Dashboard.Web\Source folder.<DataSource Name="ACME"> <ConnectionProperties DataProvider="SQL"> <Value> <![CDATA[Server=(local); Database=ACME; Trusted_Connection=True; pooling=false]]> </Value> </ConnectionProperties> </DataSource>Create a tile definition XML file in the
EnterpriseView\Dashboard.Web\Source\Tilesdirectory and add aDashboardTileelement with command and presentation sections, the namespace used for the components and other attributes for the tile. For example, we create the following XML tile definition to display: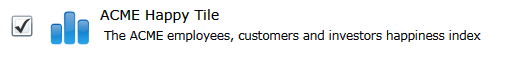
<?xml version="1.0" encoding="unicode" ?>
<DashboardTile xmlns="http://www.1e.com/2009/DashboardTile.xsd"
               xmlns:chart=http://www.1e.com/2009/StandardChart.xsd
   Type="Standard"
   Title="ACME Happy Tile"
   ThumbnailSource="columnchart.png"
   Description=" The ACME employees, customers and investors happiness index"
   RefreshFrequencyMins="60"
   Activator="StandardChartActivator">
where:
Typemust be Standard for all user-defined tilesTitleis the label for the tileThumbnailSourceis the location of image for the tileDescriptionis a description for the tileRefreshFrequencyMinsis the interval to refresh the tile – 60 minutes in our exampleActivatorisStandardChartActivatorwhich tells Enterprise View to retrieve the data in the correct format for the chart presentation
Create the query to retrieve data for the chart. In our example, (ACME datasource, defined in step 1) the ACMESAT identifier is used in the presentation section.
<CommandCollection>
   <Command DataSource="ACME" Identifier="ACMESAT">
      <Text><![CDATA[SELECT Happiness, Employees, Customers, Investors FROM dbo.Happy]]></Text>
   </Command>
</CommandCollection>
You can have one or more commands each defined in the
<Command></Command>.Note
SQL data sources can also be used to run stored procedures to retrieve the required data, which is generally safer than running arbitrary SQL.
We are going to chart the number of people and their ratings for ACME Corporation using a series for each of the Employees, Customers and Investors data:
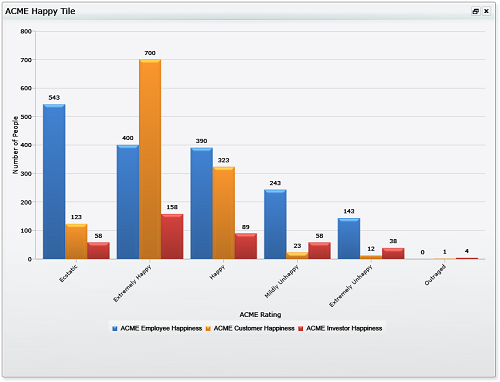
<Presentation>
   <chart:StandardChart LegendEnabled="true"
          AxisYTitle="Number of People"
          AxisXTitle="ACME Rating">
      <chart:SeriesCollection>
         <chart:Series Type="Column"
                LabelEnabled="true"
                LegendText="ACME Employee Happiness">
            <chart:DataPoint CommandIdentifier="ACMESAT"
                   YValueBinding="Employees"
                   AxisXLabelBinding="Happiness"/>
         </chart:Series>
         <chart:Series Type="Column"
                LabelEnabled="true"
                LegendText="ACME Customer Happiness">
            <chart:DataPoint CommandIdentifier="ACMESAT"
                   YValueBinding="Customers"
                   AxisXLabelBinding="Happiness"/>
         </chart:Series>
         <chart:Series Type="Column"
                LabelEnabled="true"
                LegendText="ACME Investor Happiness">
            <chart:DataPoint CommandIdentifier="ACMESAT"
                   YValueBinding="Investors"
                    AxisXLabelBinding="Happiness"/>
         </chart:Series>
      </chart:SeriesCollection>
   </chart:StandardChart>
</Presentation>
The Y axis is labeled Number of People and the X axis ACME Rating. The chart uses the Column type.
The ACMESAT identifier (defined in step 3) is used to retrieve the data, with the Y value binding set to the Employees, Customers and Investors columns for each series and the X value set to the Happiness rating
The legend for each series is set to ACME Employee Happiness, ACME Customer Happiness and ACME Investor Happiness respectively.
Displaying data in a table
To display your data in a table:
Typemust be Standard for all user-defined tablesTitleis the title for the tableThumbnailSourceis the location of image for the tableDescriptionis a description for the tableRefreshFrequencyMinsis the interval to refresh the table – 60 minutes in our exampleActivatorisStandardListViewActivatorwhich tells Enterprise View to retrieve the data in the correct format for the table presentation
We are going to use the data source you prepiously created for the chart.
Create the table definition XML file in the
EnterpriseView\Dashboard.Web\Source\Tilesdirectory and add aDashboardTileelement with command and presentation sections, the namespace used for the components and other attributes for the tile.<?xml version="1.0" encoding="unicode" ?> <DashboardTile xmlns="http://www.1e.com/2009/DashboardTile.xsd" xmlns:res="http://www.1e.com/2009/DashboardResources.xsd" xmlns:para="http://www.1e.com/2009/StandardParagraph.xsd" xmlns:table="http://www.1e.com/2009/StandardTable.xsd" Type="Standard" Title="ACME Happy Table" ThumbnailSource="table.png" Description="This table lets you know the ACME approval rating!" RefreshFrequencyMins="60" Activator="StandardListViewActivator">where:
Create the query to retrieve data from the table. We are going to use the query already created for the chart.
We are going to display the data for the number of people and their ratings for ACME Corporation using a columns and rows:
Creating a table
The following example sets the namespaces required for a table tile.
The type for all user-defined tiles must be set to Standard.
The title that appears on the banner for the tile and on the tile configuration page is set to ACME Happy Table.
The thumbnail and description that appear on the tile configuration page are set to
table.pngand a suitable description for the tile.The
RefreshFrequencyMinsis set to 60 so the tile will be updated every hour.The activator is set to the
StandardListViewActivatorwhich tells Enterprise View to retrieve the data from the data sources in the correct format for the table presentation type.
<?xml version="1.0" encoding="unicode" ?>
<DashboardTile xmlns="http://www.1e.com/2009/DashboardTile.xsd"
               xmlns:res="http://www.1e.com/2009/DashboardResources.xsd"
               xmlns:para="http://www.1e.com/2009/StandardParagraph.xsd"
               xmlns:table="http://www.1e.com/2009/StandardTable.xsd"
   Type="Standard"
   Title="ACME Happy Table"
   ThumbnailSource="table.png"
   Description="This table lets you know the ACME approval rating!"
   RefreshFrequencyMins="60"
Activator="StandardListViewActivator">Commands
The example can use exactly the same command used in the previous chart tile example.
<CommandCollection>
   <Command DataSource="ACME" Identifier="ACMESAT">
      <Text><![CDATA[SELECT Happiness, Employees, Customers, Investors FROM dbo.Happy]]></Text>
   </Command>
</CommandCollection>
Presentation
The <Presentation> tag this time contains a single <table:StandardTable> definition, where table is an object name declared in a namespace definition in the tile's <DashboardTile> tag. The <table:ColumnCollection> tag defines general parameters for the table and holds the individual <table:Column> tag definitions.
The <table:ColumnCollection> tag sets the ACMESAT command to populate the table, turns off displaying of the column headings and sets the background color for the table to a green/blue color.
Note
The ShowColumnHeader parameter is set to false. In this version the column headings do not support text formatting so it is usually best to not display them.
<Presentation>
   <table:StandardTable >
      <table:ColumnCollection CommandIdentifier="ACMESAT"
                              ShowColumnHeader="false"
                              BackgroundColor="#FF008888">
The following <table:Column> tag sets the data that will be displayed in the column using the Binding parameter. It also sets the column title, the column width and height and the height of the column heading.
The type of the column is set to html this allows HTML formatting to be applied to the contents of the column using the <table:FormatString> tag.
The Happiness binding is referenced in the format string using the {parameter} syntax. This substitutes the value for the binding into that location in the format string so in this example the column will display the Happiness value with a font size of 24 and with the emphasis style.
The CDATA syntax is used to allow the format string to contain characters that would normally require escape characters in XML.
<table:Column  Binding="Happiness"
       Title="Happy"
       Width="300" ContentHeight="60" Type="html">
   <table:FormatString>
      <![CDATA[<font size="24"><em>{Happiness}</em></font>]]>
   </table:FormatString>
</table:Column >
The following column definitions complete the table column collection.
<table:Column Binding="Employees" Title="Employees" Type="html" Width="300" ContentHeight="60" >
   <table:FormatString>
      <![CDATA[<font size="24">{Employees}</font>]]>
   </table:FormatString>
</table:Column >
<table:Column Binding="Customers" Title="Customers" Type="html" Width="300" ContentHeight="60" >
   <table:FormatString>
      <![CDATA[<font size="24">{Customers}</font>]]>
   </table:FormatString>
</table:Column >
<table:Column Binding="Investors" Title="Investors" Type="html" Width="300" ContentHeight="60" >
   <table:FormatString>
      <![CDATA[<font size="24">{Investors}</font>]]>
   </table:FormatString>
</table:Column >
</table:ColumnCollection>
In this example we also include a <StandardParagraph> tag that will display some descriptive text when the tile is maximized. This tag must be placed inside the <table:StandardTable> tag and only one is allowed.
<para:StandardParagraph>
   <para:Paragraph>
      <![CDATA[This table shows the happiness factor for the ACME corporation from the perspective of employees, customers and investors.]]>
   </para:Paragraph>
</para:StandardParagraph>
</table:StandardTable>
    </Presentation>
</DashboardTile>
Using the same data as in the previous chart example, this table definition results in the tile.
|