Using a NightWatchman baseline to identify power savings
This page describes the best practice approach and provides instructions to successfully implement a baseline in your NightWatchman Enterprise environment in order to calculate power savings. Every 1E Professional Services engagement consists of a baseline, manage and report phased process. 1E recommends customers use this process as best practice for NightWatchman Enterprise engagements.
Figure 1 – Baseline, manage and report phased methodology
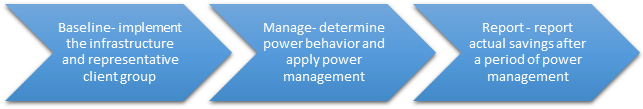
This approach enables you to optimize settings and demonstrate measurable savings as a result of deploying NightWatchman power policies.
A baseline is the average power consumption over a period of time that represents behaviors prior to deploying power policies (best practice is at least one calendar month). An accurate baseline allows savings to be accurately calculated by comparing power consumption after policies have been applied. Without a baseline it is not possible to calculate savings. The first part of your NightWatchman Enterprise implementation plan should be an evaluation of your current estate. This is achieved by installing the NightWatchman infrastructure and deploying agents to create a baseline of existing behaviours. This approach is designed to determine energy consumption without power management, either for all computers or a representative set of computers, reporting for a period of more than two weeks. A baseline of power state percentages is captured for this period.
After the baseline period, a similar length period will follow with power policies applied in order to compare the two periods and calculate savings. The design and negotiation of power policy settings is outside the scope of this guide. This manage phase will initially focus on reviewing the baseline data in order to determine a strategy for the design and deployment of power policies.
The final phase uses NightWatchman reports to demonstrate that NightWatchman is delivering measurable energy and cost reductions.
Baseline
This section gives a broad plan and best practices for implementing the NightWatchman Enterprise solution onto a representative group of computers to enable 1E Agents to report power consumption behavior from their respective hosts and create a baseline. This initial phase focuses on implementing the infrastructure, representative client group and capturing current energy usage without power management. The tasks contained in this phase below are critical for accurate measurement and enable for subsequent phases to be successful.
Baseline Period
The baseline period should be a minimum of two weeks but is typically one month, during which computer power consumption is monitored without any power policies applied. It starts when the NightWatchman agent has been deployed to the baseline group and reporting in. It is important the baseline period does not include holidays, which typically reflect less power usage. Each week included in the baseline should be a full 7 day week in order to capture power behavior during weeks and weekends. Baseline analysis uses detailed power data store in the NightWatchman database. By default, detailed data is automatically removed (groomed) from the database after 90 days leaving summarized data which is used for reporting. If detailed data needs to be kept longer than 90 days this can be extended in the NightWatchman SQL database by changing the ReportConsumption_KeepDays setting to the desired value in the tbNWM_Settings table.
NightWatchman Configuration Settings
Decide which features are necessary for your success to identify the appropriate server side and client side settings for NightWatchman operations (i.e. communications ports, etc.) The 1EAgent is initially deployed in 'reporting only' mode to determine energy consumption without power management enabled and with system tray icon switched off so that users are not aware the agent is installed.
User Communications
While capturing a baseline it is important the NightWatchman Project does not influence existing power behaviors. Users should be unaware of the NightWatchman Project at this stage and should not see the agent has been installed. If users think that NightWatchman is managing their computers they may change their behavior and start switching their computers off when previously they left them on, or leave them on when previously they switched them off. Changes in user behavior will be influenced later in the project when power policies are deployed and publicized.
In-Scope computers
The ability to produce an accurate baseline is often dependent on the ability to deploy the NightWatchman agent.
The scope of which computers should be included in the baseline is normally the same as the computers which will eventually have the NightWatchman agent installed, irrespective of whether they will be eventually managed by power policies.
The Project team should agree what percentage of computers should be reporting in before the baseline period starts. Ideally the agent should be deployed to 100% of computers prior to the start of the baseline period. Irrespective of how good the software deployment tool is, the last few percent always take the longest time to deploy! 1E WakeUp cannot be used to speed up deployment because the Agent has not been deployed.
If the number of computers included in the baseline is significantly smaller than the eventual scope, then it is very important the baseline group(s) are representative of the eventual scope. Consider the following when designing a representative baseline group:
computer Model – try to choose computers that provide the same ratios of computer model as used throughout the entire organization
Working Patterns – try to select several users from each department and role because of the way they use their computers. IT staff are usually not representative of the user population.
Time zones – if your organization has remote sites include some samples from those as well; there may be different behaviors depending on location.
Testing Power Policies
It is often desirable for power policies to be designed, tested, negotiated and piloted during the baseline period, and to test 1E WakeUp. Testing will affect the baseline, therefore number of computers involved should be kept to a minimum or excluded from the baseline. Including or excluding computers from the baseline group is achieved by using the NightWatchman Console location and/or organization groups, as described in section 2.5. It is important that these group structures are established prior to the baseline period to ensure power usage is reported against these groups.
Reporting
An organization may wish to report power usage and savings for different parts of their organization, for example geographic areas, divisions or office types. These different parts can be reflected in the NightWatchman Console location and/or organization structures, as described in section 2.5. It is important that these group structures are established prior to the baseline period to ensure the power usage is reported against these groups. This also makes it possible to create separate baselines for each part of the organization.
If deploying 1EAgent's to computers that will be excluded from power management, then it is good practice to identify these and assign to an Exclusion groups in the NightWatchman Console structure, so that they can be excluded from baseline if so desired. Power data collected from a computer by NightWatchman is permanently assigned to the building and department in which the computer is assigned, and this data is not re-assigned if/when the computer is re-assigned to a different building and/or department.
Development and Production environments
Server components are installed in a test environment and client software is packaged ready for deployment without power management. Sample computers are selected to receive the client software and reporting functionality is validated. This procedure is repeated in the production environment. A baseline can only be created in the production environment. The purpose of the test environment is for testing and validating the implementation before approving changes in the production environment.
Deploy 1E Agents in Reporting Only Mode
The 1EAgent client packages are deployed to the wider estate with an aim to install on 100% of computers.
The following 1EAgent installation parameters settings are relevant when deploying the agent in 'Reporting Mode'.
REPORTINGSERVER=<NWMMCSrv> – should be set to the FQDN or NetBIOS name for the server where NightWatchman Management Center Web Service is installed
REPORTING=ON – turns on reporting on the NightWatchman clients
SYSTEMTRAY=OFF – hides the system tray applet
These settings (apart from ReportingServer) can be modified later using power policies and from the 'Settings' tab in the NightWatchman Management Center Console. These are global settings which will affect all clients. However, Reporting should always be ON and should not be OFF at any point. Therefore if Reporting is set to OFF, no information is sent to the reporting server. This effectively disables the agent on all clients.
Gather Data
At this point, NightWatchman is installed and the 1E Agents have been configured. They will now be reporting power state and other client information back from their local host computers. You will have to leave them for a period of at least 2 weeks, long enough to gather sufficient behavioral information to accurately calculate the power savings that can be managed using NightWatchman.
The reporting only period will begin once all 1E Agents are installed on the representative group and are returning data to NightWatchman Management Center for a period of at least two weeks. The NightWatchman Management Center Analysis Reports Wizard which is run after the reporting only period, will initially search for 28 successive days where the majority of computers in representative group have returned data. So an optimal period would be a full calendar month.
Establish Grouping Structure in NightWatchman Console
Organization and/or Location grouping structures are created in the NightWatchman Console and used to group computers based on relevant criteria. They are used for granular reporting and deploying power policies including identified exclusions.
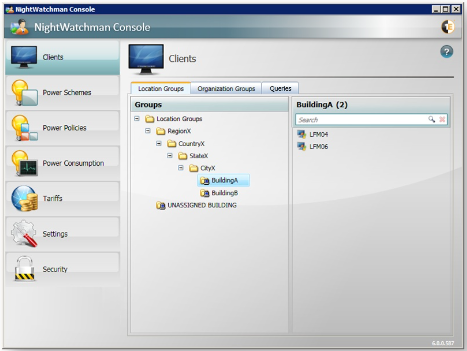
Each structure must have 5 tiers. By default, location tiers are called Region, Country, State, City and Building at the 5th tier. Organization tiers are called Company, Subsidiary, Division, Business Unit and Department at the 5th tier. computers are members of the lowest tiers building and department. The tier names, as they appear in the reports, can be changed as required in the NightWatchman SQL database by editing the values in the tbAFR_Lookup_TierLevel table. Do not modify any other part of this table except for the tier names. Location groups are typically used for reporting purposes and applying power policies based on Building/department according to the NightWatchman structure.
Figure 2 – Example Location Group structure based on Building
Organization groups are typically used to groups computers according to power policy assignment and identified exclusions.
Figure 3 – Example Organization Group structure based on Power Policy
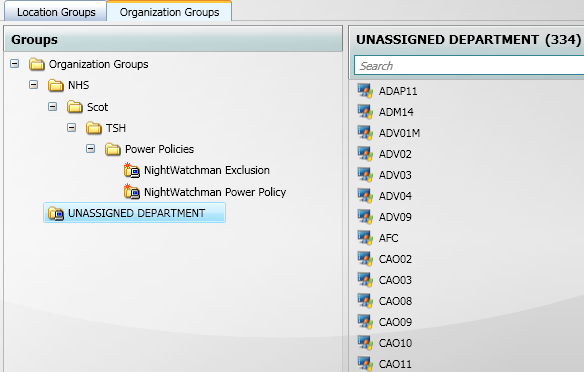
By default, computers appear in the UNASSIGNED BUILDING and UNASSIGNED DEPARTMENT groups. Membership of the tier 5 building and department groups may be managed manually, or automatically using the Group Import Wizard. The Wizard uses scripts to populate the groups based on rules and are capable of querying AD or 3rd party systems. The installation ZIP includes simple scripts for AD OU, AD Site, Subnet and Computername; each script uses a CSV lookup file to map source object to Console group. As part of a 1E Services engagement, custom scripts can be developed for the Wizard to assign computers to groups. To ensure consistency within the NightWatchman database, it is critical the Import Wizard is used when automatically assigning computers to groups, and SQL scripts are not used to directly manipulate group membership.
If a representative group of computers will be used to capture a baseline for the reporting only period then they must be grouped within their own container. The group can be created anywhere in the NightWatchman grouping structure as long as all the representative baseline group computers are contained within that group.
Update Hardware Power Consumption Values
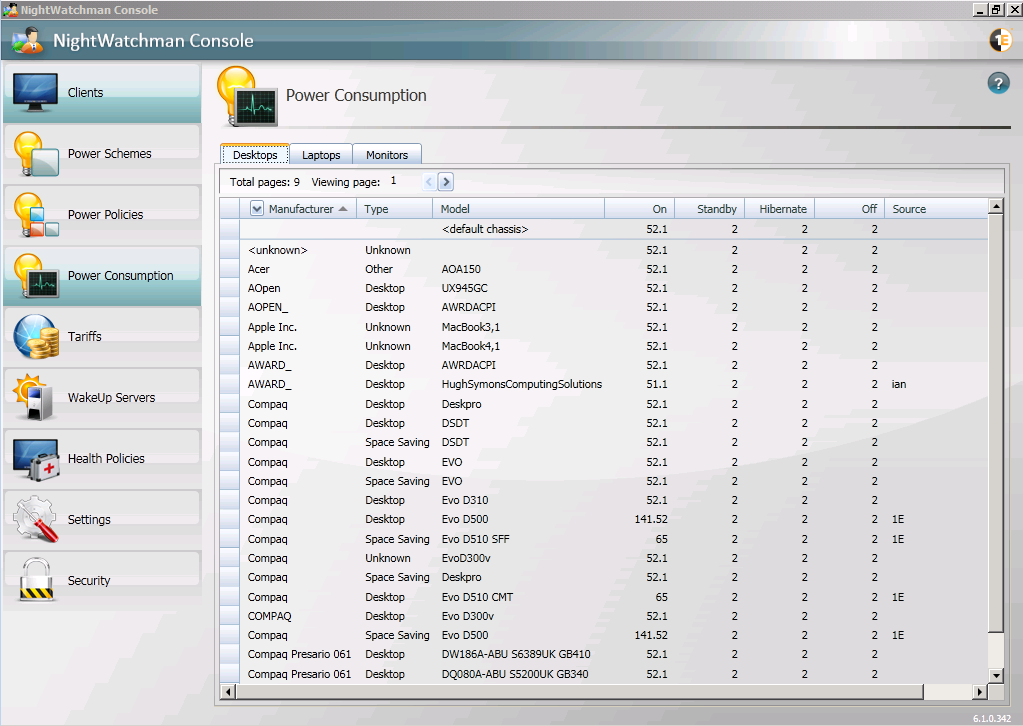
The NightWatchman Console maintains a table of all computer models and their kWh power consumption that is used for reporting of each of the power states and increases the overall accuracy of power, CO2 and cost calculations. By default every model reported has a default value of 52.1 Watts. These must be updated to accurate values before starting the baseline period otherwise when we capture the baseline, the usage data will be skewed because power consumption data will not be accurate but usage of the computers will remain the same.
NightWatchman Enterprise optionally uses ActiveEfficiency to automatically download power consumption values. If ActiveEfficiency is not used, then the values must be manually applied either using the NightWatchman Management Center Console for each computer model, or as a batch using a SQL script obtained from 1E Support. You can get more detailed information on the SQL batch method in "How to Get Power Data from 1E Support".
Note: The following applies when using either of the methods described above. 1E Support has a database that contains power consumption figures for many common computer models. However 1E support will not have details of all the models. The figures have been obtained directly from manufacturer datasheets. 1E Support currently does not provide power figures for monitors. This process should be performed after agents have been deployed to the majority of clients and reported their inventory.
Importing of Model specific power consumption values into the NightWatchman database will help achieve more accurate power, cost and CO2 reporting. Changes to power consumption (Wattage) values are immediately reflected in all kWh, CO2 and Cost reports therefore these values should be changed from their default values before any reports are finalized.
Figure 4 – Example Power Consumption Values for Desktops after Agents Deployed
Configure Tariffs
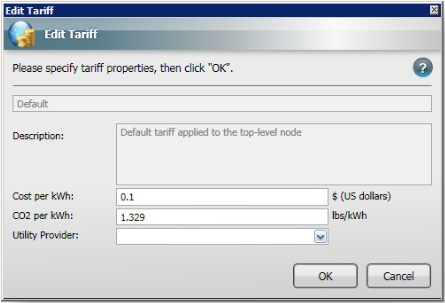
Tariffs define cost and CO2 emissions and apply to location groups to allow more accurate reporting of costs based on local charges. Each tariff consists of a cost and a quantity of CO2 produced per kWh of electricity used and optionally the name of the Utility Provider providing the electricity at that cost. There is a default Tariff that is used in the absence of any other applied Tariff and this is set to 0.1 dollars per kWh and 1.329 lbs per kWh. Modify these values to the values according to your utility provider.
Figure 5 – Default Tariff
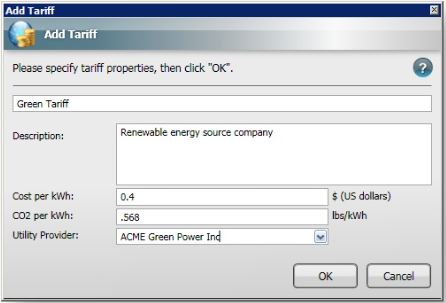
If you have specific locations that use particular providers you can create a tariff which can be applied to the computers in those locations in the grouping structure. For example, the following dialog shows a new Green Tariff being created for the ACME Green Power Inc. Utility Provider whose energy costs 0.4 dollars per kWh and results in 0.568 lbs of CO2 per kWh of electricity generated.
Figure 6 – New Tariff
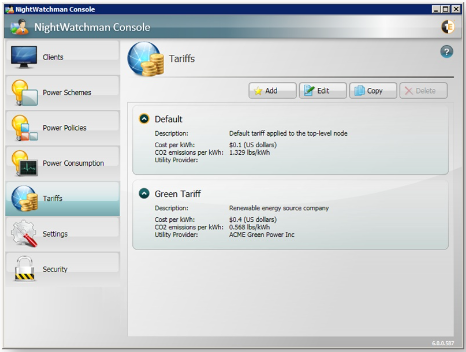
The following illustrates the new and Default Tariffs in the NightWatchman Console.
Figure 7 – New and Default Tariffs
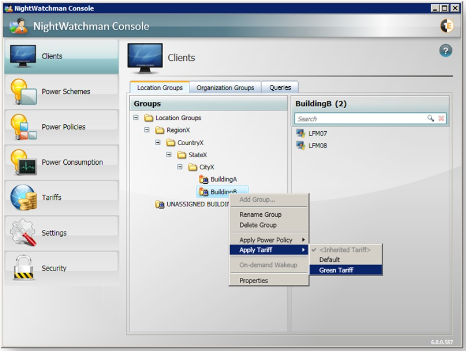
Now the Green Tariff created earlier can be applied to BuildingB. To do this, right-click and select the Tariff from the Apply Tariff sub-menu.
Figure 8 – Apply Tariff to location group
The choice of currency (default $) and quantity (default lbs) are configurable settings in the NightWatchman Management Center Console. These apply to the whole organization and to all tariffs. NightWatchman does not use currency exchange rates, or use different tariffs for different days, therefore costs must be manually calculated and specified in tariffs for different parts of the organization.
NightWatchman does not use tariffs that have different costs at different times of day. If hourly tariffs are being used, then it is good practice to specify an average cost for the period of time you expect computers to be on. For example, if there is a daytime tariff charge of $0.1 per kWh and an evening tariff charge of $0.3 per kWh, the tariff can be averaged out to $0.2 per kWh.
Assess
Whilst current power usage behavior is being gathered during the reporting only period, suitable power policies are being developed ready for deployment in the next phase with a view to determining preferences for scheduled actions and power management policies. Communications are sent out to the business and/or individual users in order to identify any exclusions or any other deltas in normal working patterns. Power policies are applied to test computers (that are outside of the representative baseline group) in order to validate functionality.
Manage
After the baseline period, this phase will initially focus on reviewing and understanding the energy consumption, usage data and power state percentages from the representative baseline group to provide a baseline indication of current power usage without power management. In some cases it may be desirable to have more than one baseline if you want to produce savings reports for different groups instead of the whole organization.
The power management strategy will be implemented by deploying power policies. The design and negotiation of power policy settings is outside the scope of this guide. However, it is best practice to try to keep the number of power policies to as few as possible.
Run the NightWatchman Analysis Reports Wizard
This report is used to estimate potential future savings that could be achieved based on specific conditions such as global shutdown and wakeup times. This report requires that the 1E Agent has been installed in reporting only mode without power policies on the representative baseline group for a period of at least two weeks.
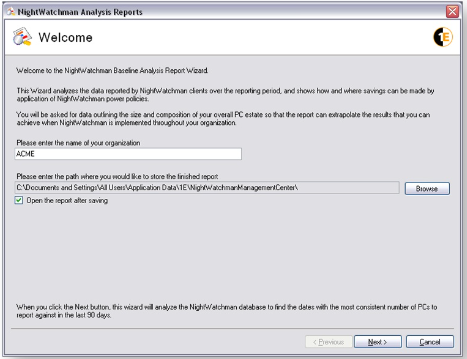
This report uses data returned by the 1E Agents during the reporting only period to generate figures for a report which details estimated savings based on the reporting only period that can be made by implementing an automated nightly power down routine on the represented group of computers. It then extrapolates these findings to cover all of the computers in the network. In the Welcome screen, enter the name for the organization that the report is intended for. Choose the default directory where the file is saved and open the report after it is saved.
Figure 9 – Analysis Reports Wizard Welcome screen
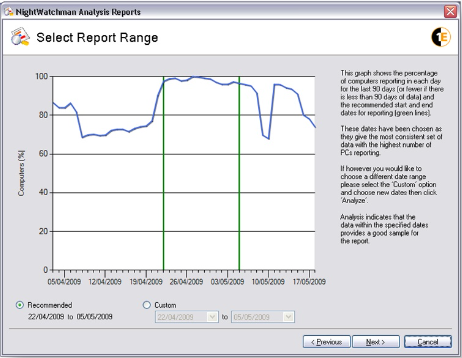
On the Select Report Range screen select a sample of data that represents where the majority of computers on the network reported in with minimal variation on the number of computers reporting. This forms a sound basis for analysis to determine the amount of savings that can be made. By default the wizard searches a period of 28 days; if it cannot find anything that meets the criteria it will search for a period of 21 days. If that fails, 14 days and finally 7 days. If no suitable data set is found, you will need to manually choose the reporting only period.
Figure 10 – Analysis Reports Wizard Select Report Range screen
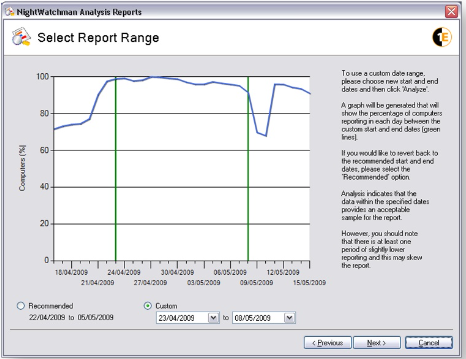
If you need to report on a particular data range, chose Custom, enter the start and end dates for the report and click Analyze. In this example, the data is mostly suitable except for a dip in the number of computers reporting in towards the end of the selected period. The comment in the wizard on the right of the graph mentions that the data is acceptable but the period of slightly lower reporting may skew the results of the report.
Figure 11 – Analysis Reports Wizard Select Report Range screen with Custom date range
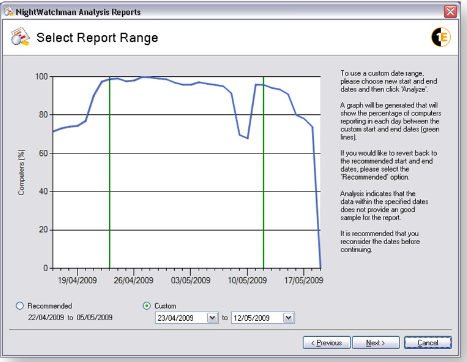
The example below shows a later end data for the report, this time including a more pronounced dip in the number of computers reporting. The analysis warns that this may not be a suitable period to report on and recommends that the data range is modified before continuing.
Figure 12 – Analysis Reports Wizard Select Report Range screen with Custom date range
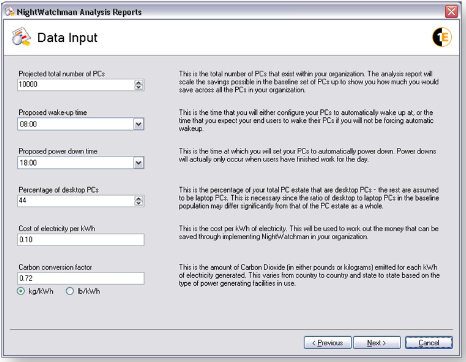
Having selected and analyzed a date range, click Next to go to the next screen. The Data Input screen is where you set the context for the report. By setting the number of computers NightWatchman runs on and how it is used to control power downs for inactive computers, the report generator can calculate the savings made and extrapolate these to the network as a whole. Specifically on the Data Input screen, set the following:
The number of computers in your organization
The proposed wake-up and power down times
The percentage of computers in your network that are desktop computers compared to laptop computers
The cost of electricity per kWh in your locality – this will be marked using the local currency of the computer where the report is being generated
The carbon conversion factor in your locality
The units of carbon conversion, either kg/kWh or lb/kWh
The example below shows a network where there are 10,000 computers running NightWatchman. The wake up and power down times are 8 AM and 6 PM respectively. 44% of computers are desktops. The cost of electricity is 10 cents per kWh and the carbon conversion factor is 0.72 kg/kWh.
The default value that appears for Projected total number of computers is the total number of computers that reported into NightWatchman during the period selected in the Select Report Range screen. The graph in the Select Report Range screen shows the percentage of these computers which reported in each day during that period.
Figure 13 – Analysis Reports Wizard Data Input screen
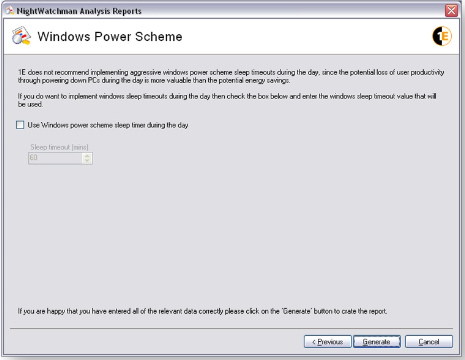
After the inputs for the report, click Next. Next in the Windows Power Scheme screen, choose whether the report should include periods where an aggressive Windows power scheme is set during working hours. One to think about carefully as there is a trade-off between saving extra energy and potential impact on user productivity through having computers powered down during working hours during periods of inactivity. If you check the option and set a timeout for the power scheme an additional heading will appear in the generated report detailing the savings to be made from implementing the scheme.
Figure 14 – Analysis Reports Wizard Windows Power Scheme screen
Once you've entered in all the data, click the Generate button (a Report progress screen is displayed and depending on the amount of data represented in the data set, this can take between one to three minutes). Once the report has been generated review the following information:
Potential annual kWh savings
Potential annual cost savings
Potential annual CO2 savings
Review the report focusing on the User Behavior graphs showing usage behaviour during the working week and weekends along with savings calculations and hardware types. The Potential Savings section contains graphs depicting savings that can be achieved if a scheduled power down occurs given the current user behaviour. This report is from the perspective for the whole organization not just the representative baseline groups.
Creating a Power Behavior
A power behavior is the average proportion of time-in-state over a given date range, split by desktops and laptops, and also by weekend and weekday. A power behavior must be created to represent user behavior for the reporting only period when power management was not in force. It is used by NightWatchman to calculate savings that have been made due to the implementation of power policies by comparing new behavior with old.
The Power Behavior can be created in the NightWatchman Reports Console. Click Savings from the Report Categories menu. Click Weekly NightWatchman Savings from the Savings from Power Behavior menu. In addition to this report, Power Behaviors can be created from within the Yearly NightWatchman Savings and Yearly Utility Provider Savings – kWh reports. Click the Manage Power Behaviors button, click Add. Input the following fields:
In the Name field type a name for the Power Behavior
In the Description field type 'Reporting Only period without power policies'
In the Location Level field ensure that 'All' is selected
*if a representative baseline group has been created then select this group
In the Organization field ensure that 'All' is selected
*if a representative baseline group has been created then select this group
By being able to select different organization and location group, it provides the ability to create multiple baselines but only if you have created the relevant group structures. Therefore it is important to create a group structure according to how you think you will be deploying power policies.
At the Start Date field, select an appropriate date when a large percentage of the representative baseline group had the 1E Agent installed without power policies
*you are limited to profiling 90 days' worth of historical data
At the End Date field, Select an appropriate date at the end of the baseline period when a large percentage of the representative baseline group had the 1E Agent installed without power policies
At the Review power behavior details before saving dialog, check the details for the number of laptops and desktops and compare the weekday to weekend for the time in state details. At the 'Wizard – Manage Power Behaviors' dialog, select the Power Behavior and click the 'Table View' tab to display the calculated figures behind the time in state values.
The example Power Behavior in Figure 15 is based on 111,024 desktops and 41 laptops reporting in power state information from all locations during the period 1st September to 30th September 2013. Figure 15 – Example Power Behavior in Table and Graph view
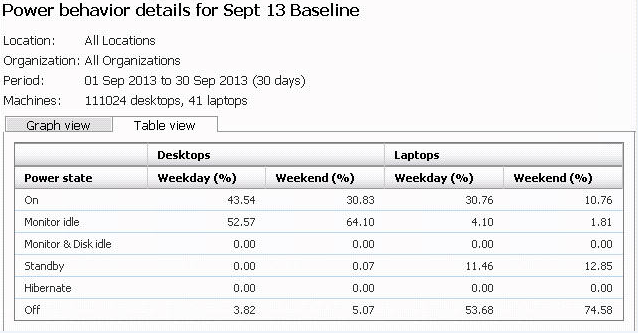
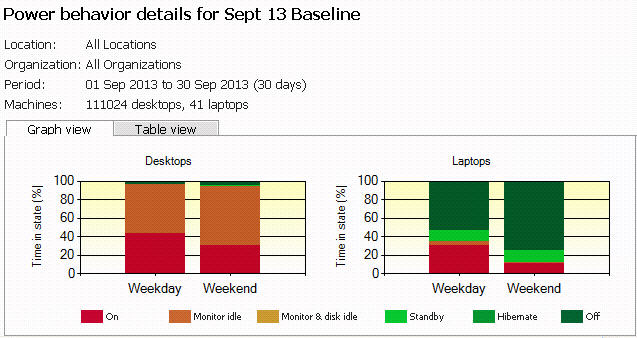
Note: The graph view can be compared with the 'Time in State' report in section 4.2 to understand differences in time in state percentages over different months. Notice how the time in state percentages are also similar to those listed in the time in state report.
The 'monitor idle' power state translates to the computer being powered on but with the monitor in standby. i.e. the computer is on but not being used. The 'monitor idle' state percentage of 53% supports the fact power management was non-existent in the computer estate. The data showed that savings were obtainable by reducing the length of time computers spent in the 'On' power state. It is worth noting that prior to implementing power policies, only a small proportion of the user base already power down their computers when not in use. It can be seen that prior to implementing power policies, desktops were in the 'off' power state for 4% during the week and 5% during weekends.
This Power Behavior gives a feel for how computers are behaving on average in terms of percentage of time spent in power states. One use for this is to determine a baseline (how computers behave before power management is enforced) and then compare this to current behavior to calculate how much power has been saved by using NightWatchman.
Apply NightWatchman power policies to representative group
Power polices are targeted at computers including exclusions where required. Policies are typically rolled out using a phased approach using a small number of pilot computers and then extending to a wider audience when confidence grows. During this phase, policies may be fine-tuned depending on observed behavior and feedback from users'. After policies have been finalized and applied to the whole of the environment (or representative baseline group), a period of more than 2 weeks occurs in order to gather the new energy usage data (best practice is at least one calendar month).
Following completion of these tasks and depending on the progress of agent deployment and the duration that power policies have been active, the final report phase will commence after power management has been applied to the majority of the environment for at least the same period as with the baseline period (best practice is at least one calendar month).
Create and apply power management policies with the desired shutdown time to the representative group with a view to applying to the wider representative group.
Validate that savings start to appear in the standard NightWatchman savings reports ensuring that the Power Behavior is selected. This requires applied power management policies for more than one day to the representative group of computers.
Report
The final phase uses NightWatchman reports to demonstrate that NightWatchman is delivering measurable energy and cost reductions. This phase will commence when power management has been applied to the majority of the environment for at least the same period as with the baseline period (best practice is at least one calendar month).
Comparison
Standard NightWatchman reports are run in order to calculate savings achieved. These use the power behavior created at the start of the manage phase as the measurement for comparison.
Other standard reports are used to understand the behavioral differences including; 'Time in State', 'Successful Shutdowns' and 'Uncompleted Shutdowns' reports.
Time In State Report
The following example report shows observed computer time in state for all computers for the period associated with the NightWatchman implementation. This report is available through the NightWatchman Management Center Report Console.
Figure 16 – Example Yearly Time In State report
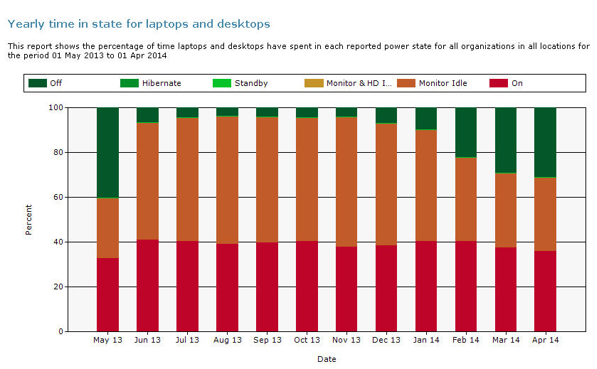
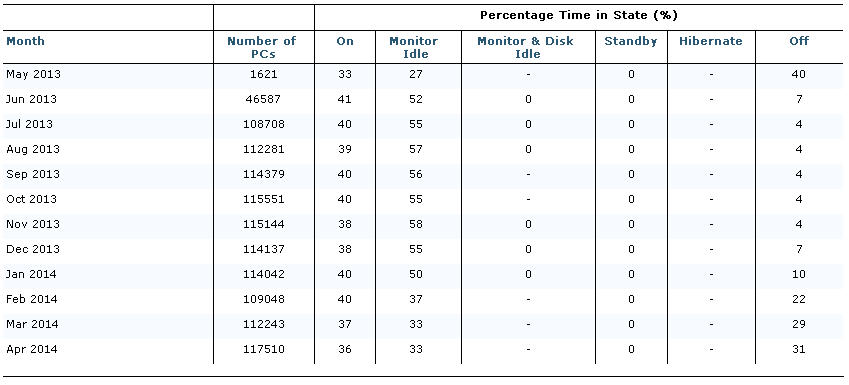
It can be seen that for the month of April 2014 where power policies are being applied across the whole estate, these is an increase in the time computers spend in the 'off' power state from 4% to 31%. Using the associated numbers from the baseline period in September 2013 (where no power policies were applied), and comparing to April 2014 during the manage period (where power policies were applied), there is an increase in the time computers are in the 'off' state (from 4% to 31%).
The 27% increase is a result of applying the various power policies causing computers that were previously in an 'on; state to change to the 'off' state via NightWatchman scheduled action to gracefully shutdown the computer.
Note how the column and percent data for September is similar to the Power Behavior in Figure 15, however the Time In State reports do not differentiate between desktops and laptops or weekdays and weekends.
Weekly Savings NightWatchman Savings Report
The following example report shows savings calculated using the Power Behavior and actual reported energy usage for computers in all locations during the period 28th April to 4th May 2014. This report is available through the NightWatchman Management Center Report Console.
Figure 17 – Example Weekly NightWatchman Savings Report
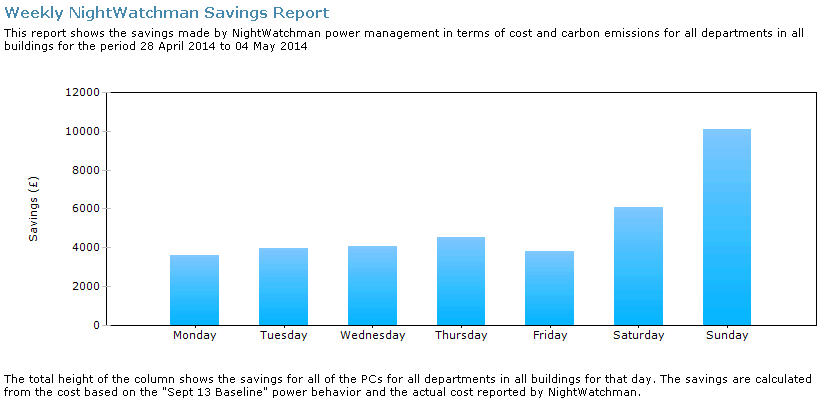
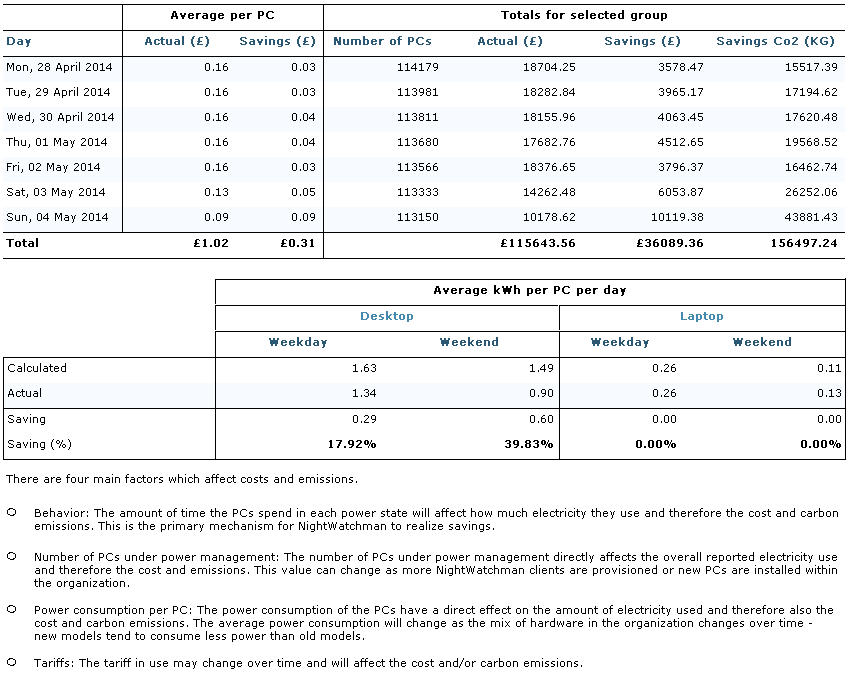
This time period shows weekly savings of £36.089.36 based on approximately 113,671 computers reporting in during this period. This equates to a weekly saving of £0.31 per computer. Breaking this information down into computer type, it can be seen that a higher proportion of savings are achieved during the weekends.
Yearly Savings NightWatchman Savings Report
The following example report shows savings calculated using the Power Behavior and actual energy usage for computers in all locations during the year 2014. This report is available through the NightWatchman Management Center Report Console. The report echoes the power consumption of the computers based on hardware model as well as the electricity Tariff.
Figure 18 – Example Yearly NightWatchman Savings Report
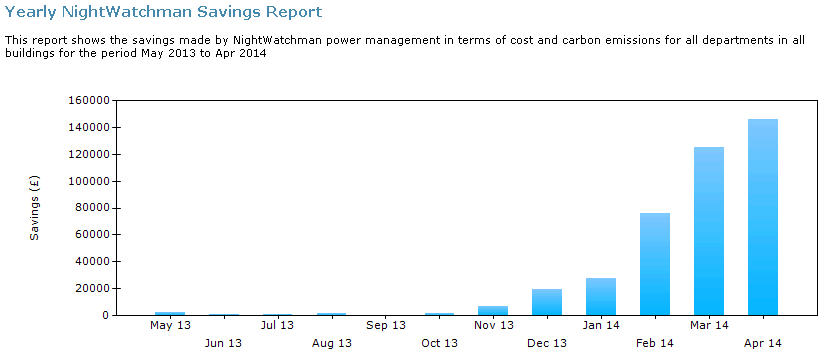
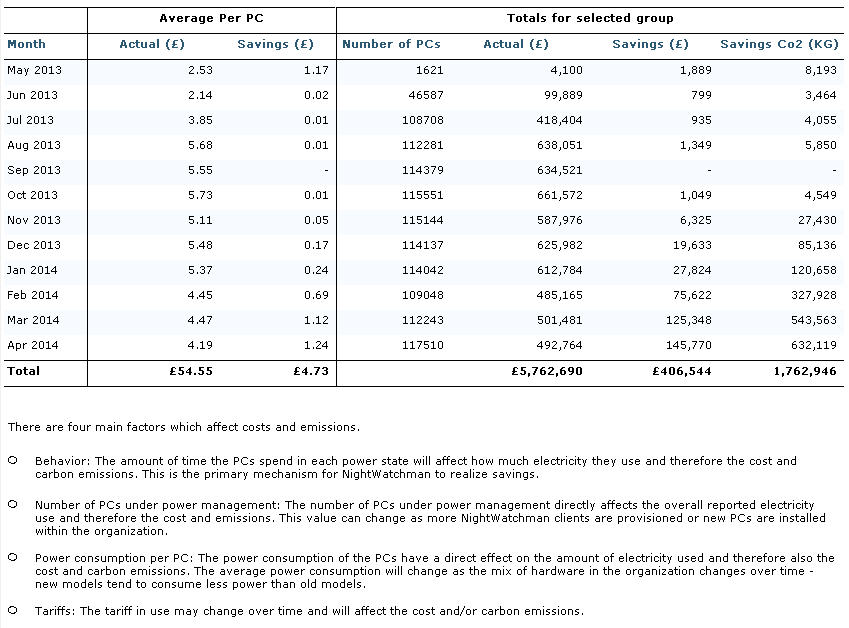
The report shows some savings during January when power policies were beginning to be rolled-out across the production environment, and savings for April where power policies were applied to all computers (except for identified exclusions) for the full calendar month. Savings are based on comparison with the baseline taken in September, which is why September shows zero savings. 'Savings' for earlier months is because the computers reporting in then had a different power behavior to the majority of clients reporting in September.