Enterprise View
Enterprise View is a web-based business intelligence dashboard that provides overviews of energy consumption and computer-related information from your network. You can customise the dashboard by choosing which tiles to display from a pre-defined list. It uses information already held in the reporting database to populate the tiles.
Accessing Enterprise View
To access Enterprise View, navigate to: http://<servername>/enterpriseview/ where <servername> is the name of the server where the Enterprise View software is installed.
Enterprise View requires Microsoft Silverlight – if it is not already installed, you will be prompted to do so.
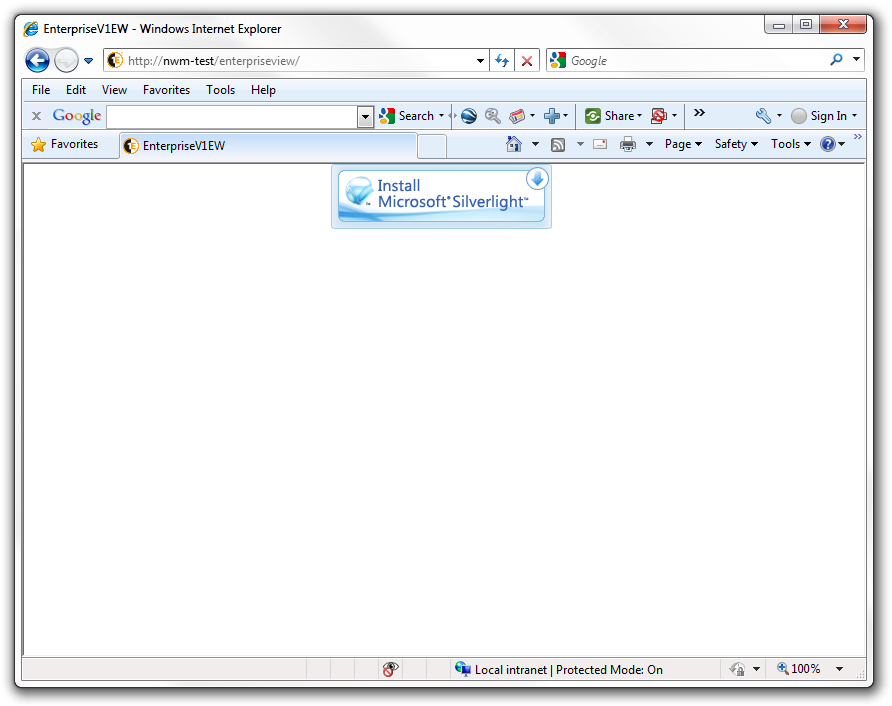
(If you see a placeholder instead of the Silverlight logo then you do not have access to the internet and you will need to download the Silverlight installer from another computer. All versions of Silverlight from version 3.0 are supported by Enterprise View).
To continue from this point:
Click Install Microsoft Silverlight.
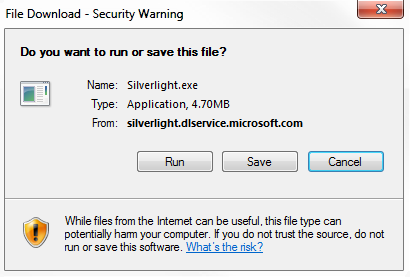
Click Run.
When all the files are extracted (a dialog displays its progress), the installer starts. When the installer starts running, a dialog displays its progress.
When all the files are extracted, the installer starts.

Click the Install now button.
When installation has completed successfully, the success success displays. You may need to refresh the browser before the Enterprise View home page is displayed.
Enterprise View home page
Once Silverlight is installed, navigating to the Enterprise View URL displays the home page. The first time the user navigates to the home page, getting started information is displayed.
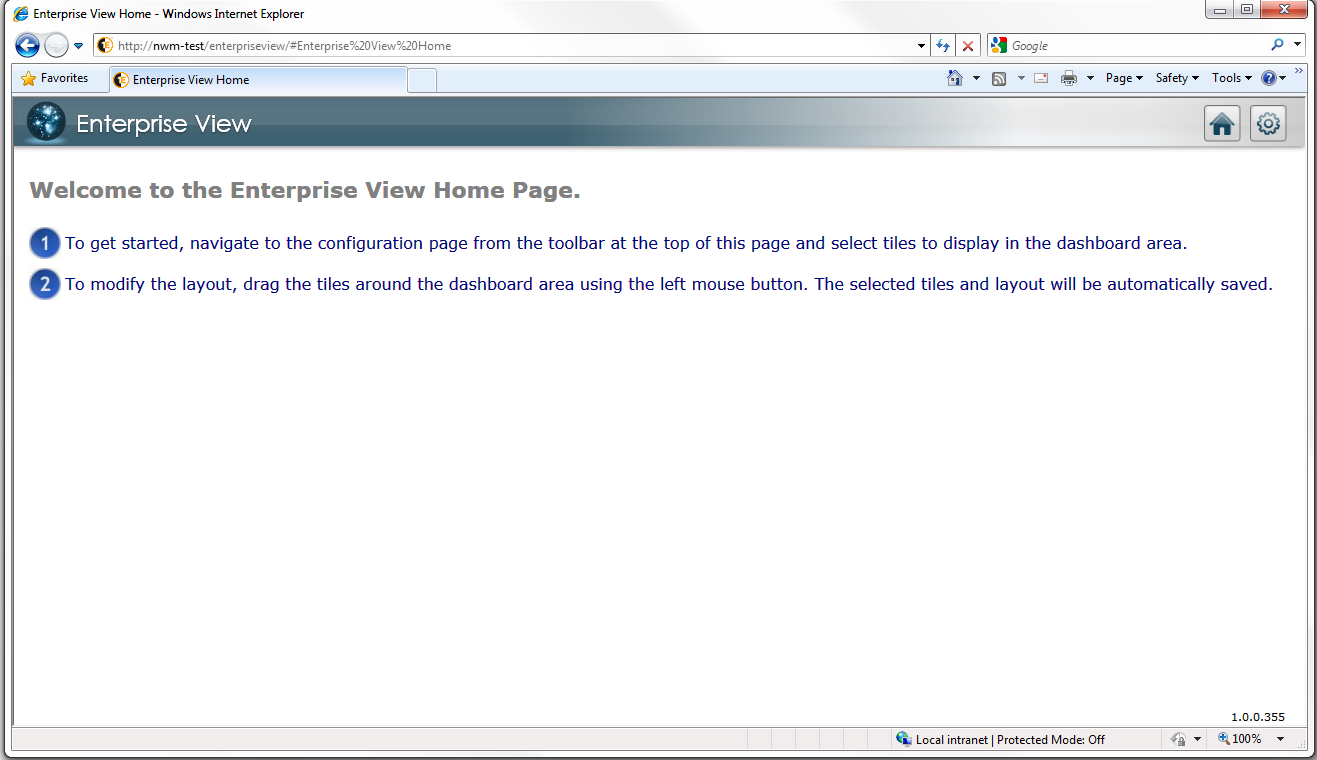
To add tiles to the dashboard:
Click the Tools button at the top-right of the page to display the tile configuration page. The list of tiles are the defaults provided with NightWatchman Management Center. You can select up to eight tiles to display on the dashboard.
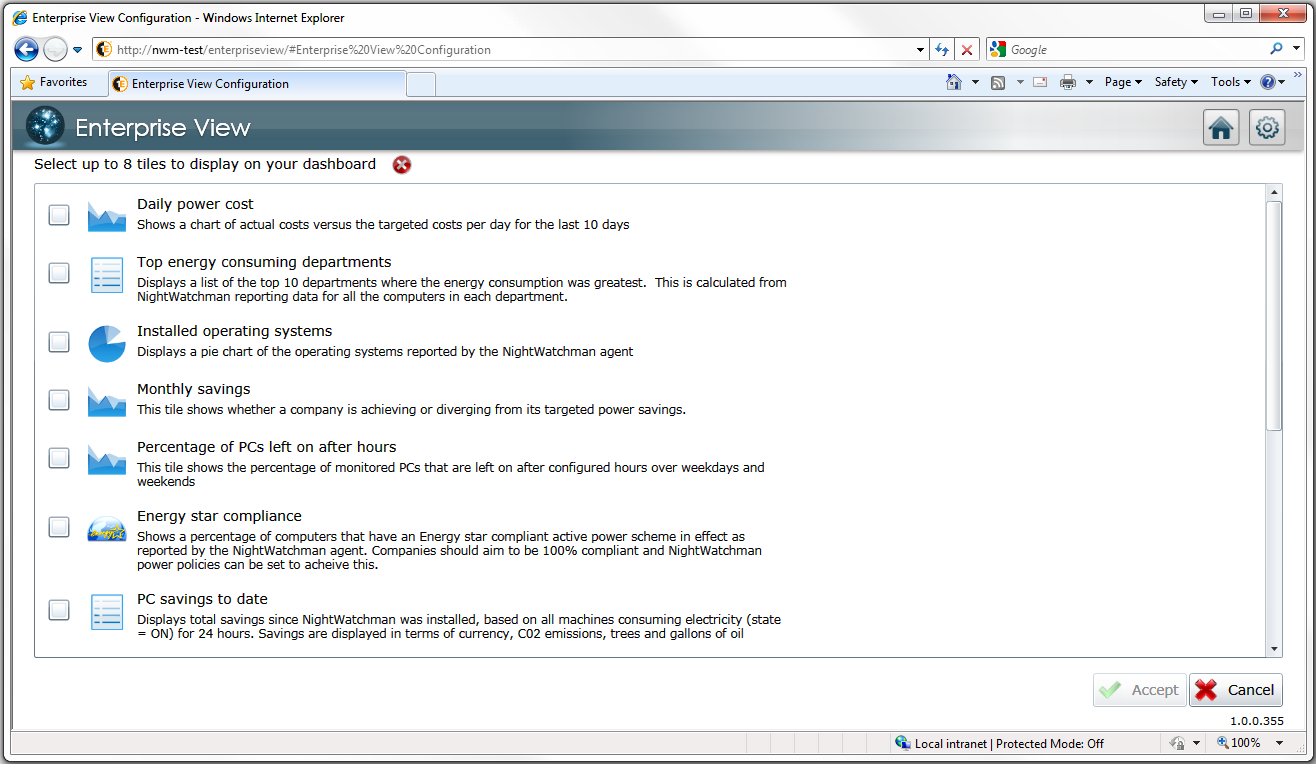
Click the checkbox to the left of the tile's icon.
When you have selected your tiles (8 maximum) click Accept to populate the dashboard.
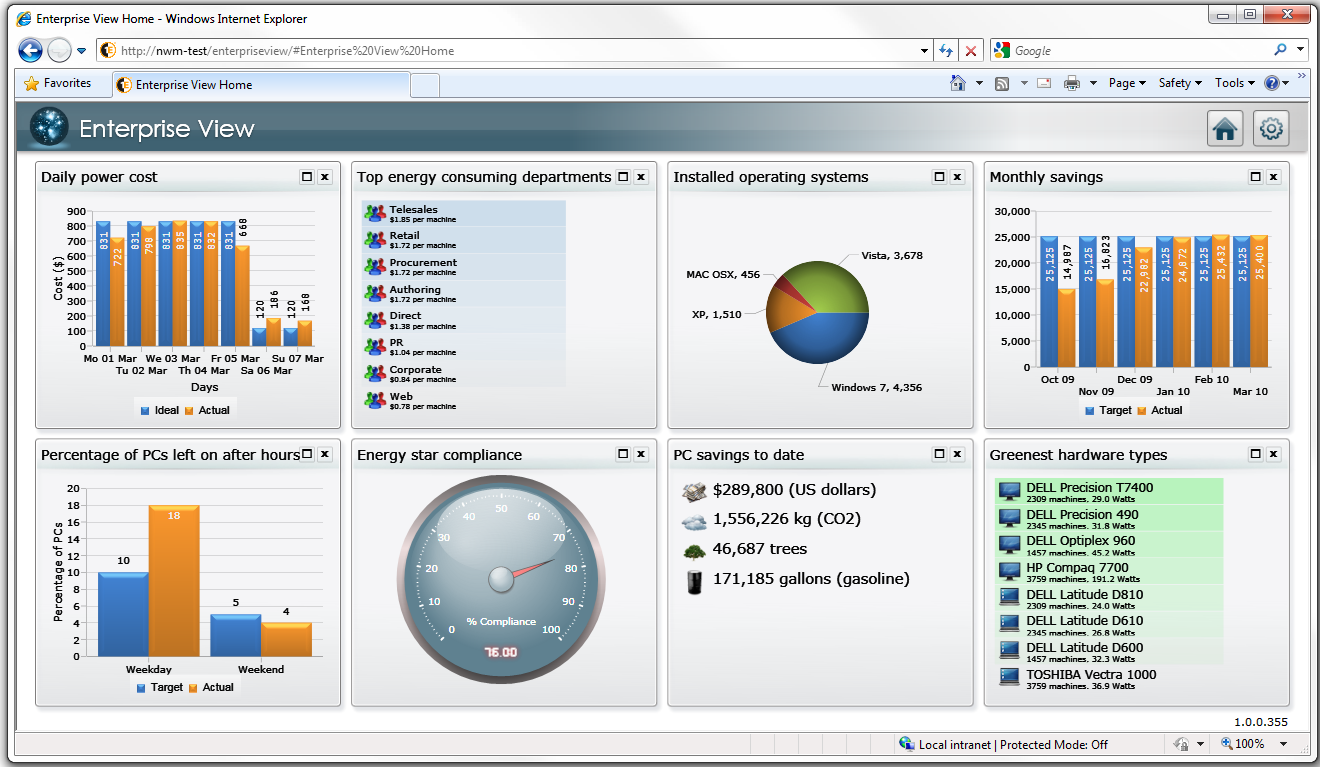
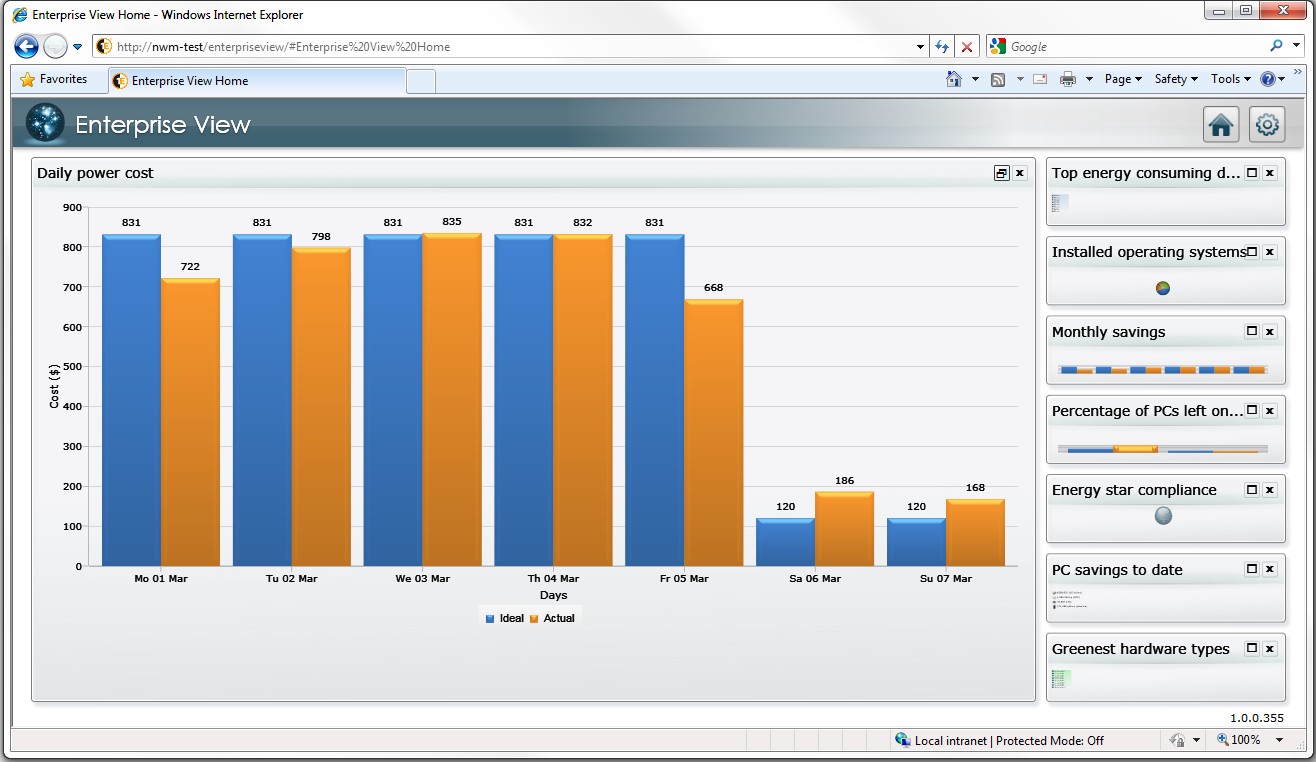
Once the tiles are on the home page, you can re-arrange them by dragging their title bars, expand them to view the details of a particular tile or close it.
Setting up the dashboard tiles
After you install the Enterprise View website, add the dashboard tiles and and configure their datasources. Tile definitions are provided when installing supported 1E applications and must be copied to the correct location in the Enterprise View website and manually configured before are available to users. When you install one of the supported applications, either NightWatchman Management Center or NightWatchman Server Edition, a folder is created in the product's installation directory which contains the XML definitions for the tiles associated with that product. The folder is relative to the product's installation directory: %installdir%\EnterpriseView
Copy the file definitions to the Enterprise View installation directory as follows:
On 32-bit platforms –
C:\Program Files\1E\Enterprise View\Dashboard.Web\SourceOn 64-bit platforms –
C:\Program Files (x86)\1E\Enterprise View\Dashboard.Web\Source
Each of the tiles requires a connection to a data source (which can be from an SQL database or a localized XML file) in order to display information. The data sources are defined in an XML file and is located at: %installdir%\1E\Enterprise View\Dashboard.Web\Source\DataSources.xml
To configure an SQL data source for NightWatchman, add a definition
DataSourceselement. For example:<DataSource Name="NightWatchman"> <ConnectionProperties DataProvider="SQL"> <Value> <![CDATA[ Server=<ServerName>;Database=AgilityFrameworkReporting;Trusted_Connection=True;pooling=false ]]> </Value> </ConnectionProperties> </DataSource>where
<ServerName>is the server where the NightWatchman Management Center database is installed.To configure an SQL data source for NightWatchman Server edition, add a definition to the
DataSourceselement. For example:<DataSource Name="NightWatchmanServer"> <ConnectionProperties DataProvider="SQL"> <Value> <![CDATA[ Server=<ServerName>;Database=NightWatchmanServerEdition;Trusted_Connection=True;pooling=false ]]> </Value> </ConnectionProperties> </DataSource>where
<ServerName>is the server where the NightWatchman Server Edition database is installed.To configure an XML data source, add the following XML snippet to the
DataSourceselement:<DataSource Name="LOCAL"> <ConnectionProperties DataProvider="XML"> <Value> <![CDATA["NONE"]]> </Value> </ConnectionProperties> </DataSource>
A tile may be duplicated provided its title is different. The default tiles are:
Title | Description | File | Notes |
|---|---|---|---|
Savings to date | Displays total savings since NightWatchman was installed and based on all machines consuming electricity (state = ON) for 24 hours. Savings are displayed in terms of currency, C02 emissions, trees and gallons of Oil | | Uses
|
Daily power cost | Displays a chart of the actual cost per day as reported by NightWatchman for the last 10 days. | | Uses
|
Monthly Savings | Shows savings for all of the PCs in all departments and all buildings for the last six months. | | This tile uses |
Top energy consuming departments | Displays the top 10 departments in descending order of energy cost per capita. Provides a way of monitoring which departments cost the most in terms of PC energy usage and are candidates for more stringent energy management. | | This tile uses |
Top 10 buildings by cost | Displays a list of the top 10 buildings where the cost of electricity usage is the highest. Reporting data from NightWatchman and current applied location-based tariffs are used to calculate power consumption and cost figures. | | This tile uses |
Installed operating systems | Displays a pie chart of the operating systems reported by the NightWatchman agent. | | This tile uses |
Percentage of PCs left on after hours | This tile shows the percentage of monitored PCs that are left on after configured hours over weekdays and weekends. The chart assumes that computers are on overnight if they are on at any time before 9AM or after 5PM on weekdays or at any time over the weekend. | | This tile uses |
Energy star compliance | Shows a percentage of machines that have a compliant active power scheme in effect as reported by NightWatchman client. You should aim to be 100% compliant and NightWatchman power policies should be set to achieve this. | | This tile uses |
Greenest hardware types | Displays a maximum of 3 desktop and 3 laptop hardware types that consume the least amount of energy in their relevant categories. This is only taken from hardware that has reported to NightWatchman in the last 90 days. | | This tile uses |
Most Consuming Hardware Types | Displays a maximum of 10 hardware types made up of any combination of desktops and laptops that consume the most amount of energy. This is only for hardware that have reported in the last 90 days. | | This tile uses |
NightWatchman Management Center stored procedure permissions
If the NightWatchman Management Center database is installed on a different server to the computer where the Enterprise View web application is running, modify the permissions of the respective stored procedures in the NightWatchman Management Center database.
To do this:
Modify the
SetSchemaObjectPermissions.sqlfile.On 32-bit platforms –
C:\Program Files\1E\NightWatchman Management Center\EnterpriseViewOn 64-bit platforms –
C:\Program Files (x86)\1E\NightWatchman Management Center\EnterpriseView
Set the string
%aspuser%to<DOMAIN> <DASHBOARDSERVER>$where<DOMAIN>is the name of the domain of the computer hosting the Enterprise View web application and<DASHBOARDSERVER>is the name of the server running the Enterprise View web application.Execute the file against the NightWatchman Management Center database.