Using AXM
This section walks you through the essential features and functionalities of AXM, including:
Application monitoring - Be at the forefront of your application performance. Our 1E AXM tool captures responsiveness and stability data continuously. Detect and troubleshoot issues promptly, minimize disruptions, and ensure your applications are always at their peak performance
AXM Score - Gain clarity on your application experience and user satisfaction with our AXM Score. This metric aggregates and analyzes application data to provide a comprehensive score representing user experience and satisfaction. With AXM Score, making data-driven decisions to enhance your application experience is easier than ever
Advanced dashboard - Navigate your application data effortlessly with our user-friendly dashboard. It presents real-time application data and insights, facilitating quick and effective decision-making
Core Web Vitals integration - Maximize your web application performance with our integration of Google Core Web Vitals. Assess key performance indicators such as Largest Contentful Paint (LCP), First Input Delay (FID), and Cumulative Layout Shift (CLS) to better understand loading, interactivity, and visual stability to deliver a superior user experience. To find out more about Google Core Web Vitals refer to https://developers.google.com/search/docs/appearance/core-web-vitals.
Installed Applications dashboard
The Installed Applications dashboard provides a summary of application performance at a glance. The Key metrics and charts displayed here help you to quickly identify any issues or trends using Session AXM Scores for the selected period.
The Applications dashboard allows IT administrators to:
Have improved visibility into the applications used in the corporate environment
Obtain application performance metrics that give a clear picture of application experience for end-users
Get details about application adoption and usage, including how much time users spend interacting with an application and how much time users need to wait for a specific application.
The Application Experience Score (AES) is a numerical value reflecting an end user's satisfaction when they use an application. It is a total of the weighted scores of three metrices shown in this table.
Metric Name | Description |
|---|---|
Application Stability | The occurrence of crashes and hangs. A higher number of crash and hang events will lead to a lower score of application stability. |
Application Unresponsiveness | The unresponsiveness events of an application. As the number of unresponsiveness events increases, the responsiveness of the application will decrease. |
Busy Cursors | The count and duration of busy cursors. More busy cursors will lead to more frustrating experience with the application. |
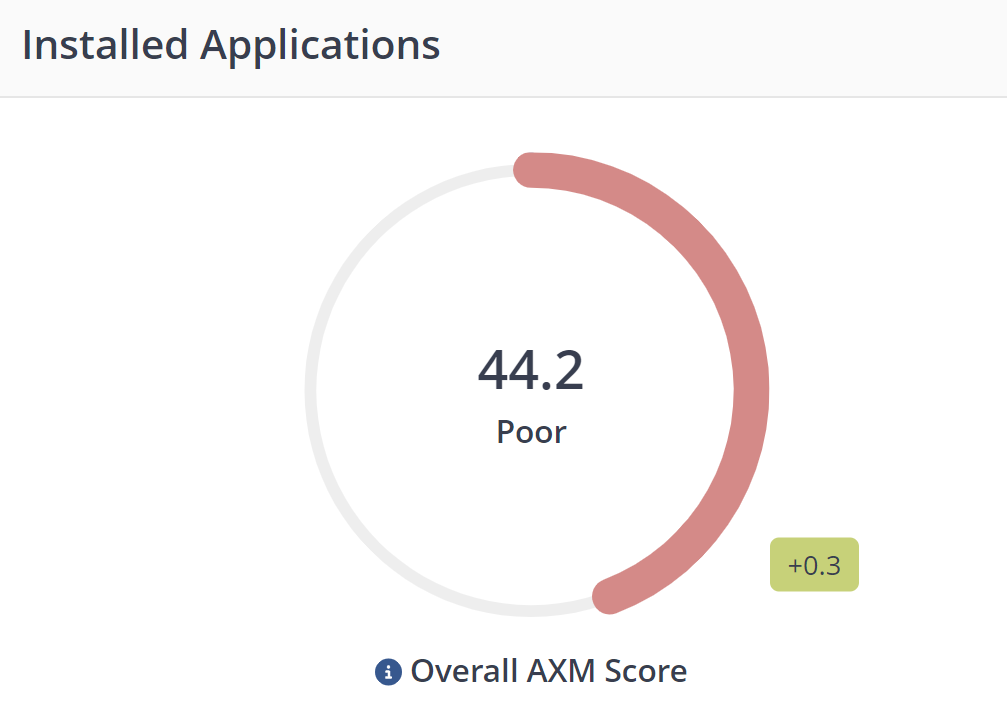
A quick measure of user frustration based on responsiveness and stability.
It displays the AXM score of all your applications aggregated for the selected period including changes in Application Experience Score carried out in the selected time period versus the one before.
A prioritized list of applications with the lowest scores, aimed at guiding troubleshooting efforts.
This section displays applications with the lowest scores. To investigate further you can either click on an application title to focus on that specific title.
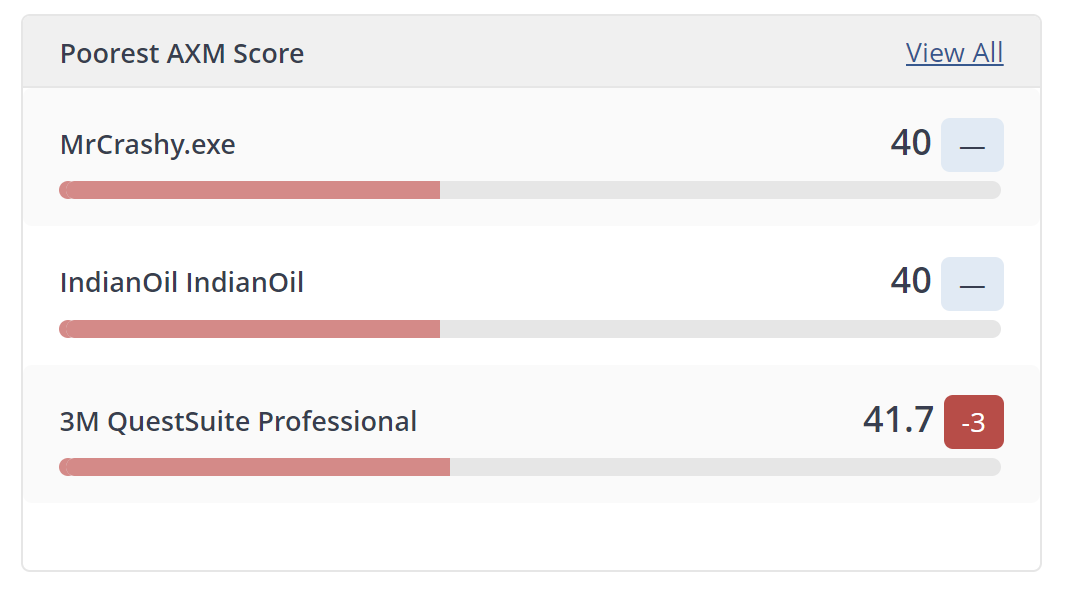
Clicking View All displays the All Applications drawer with every application displayed by AXM score.
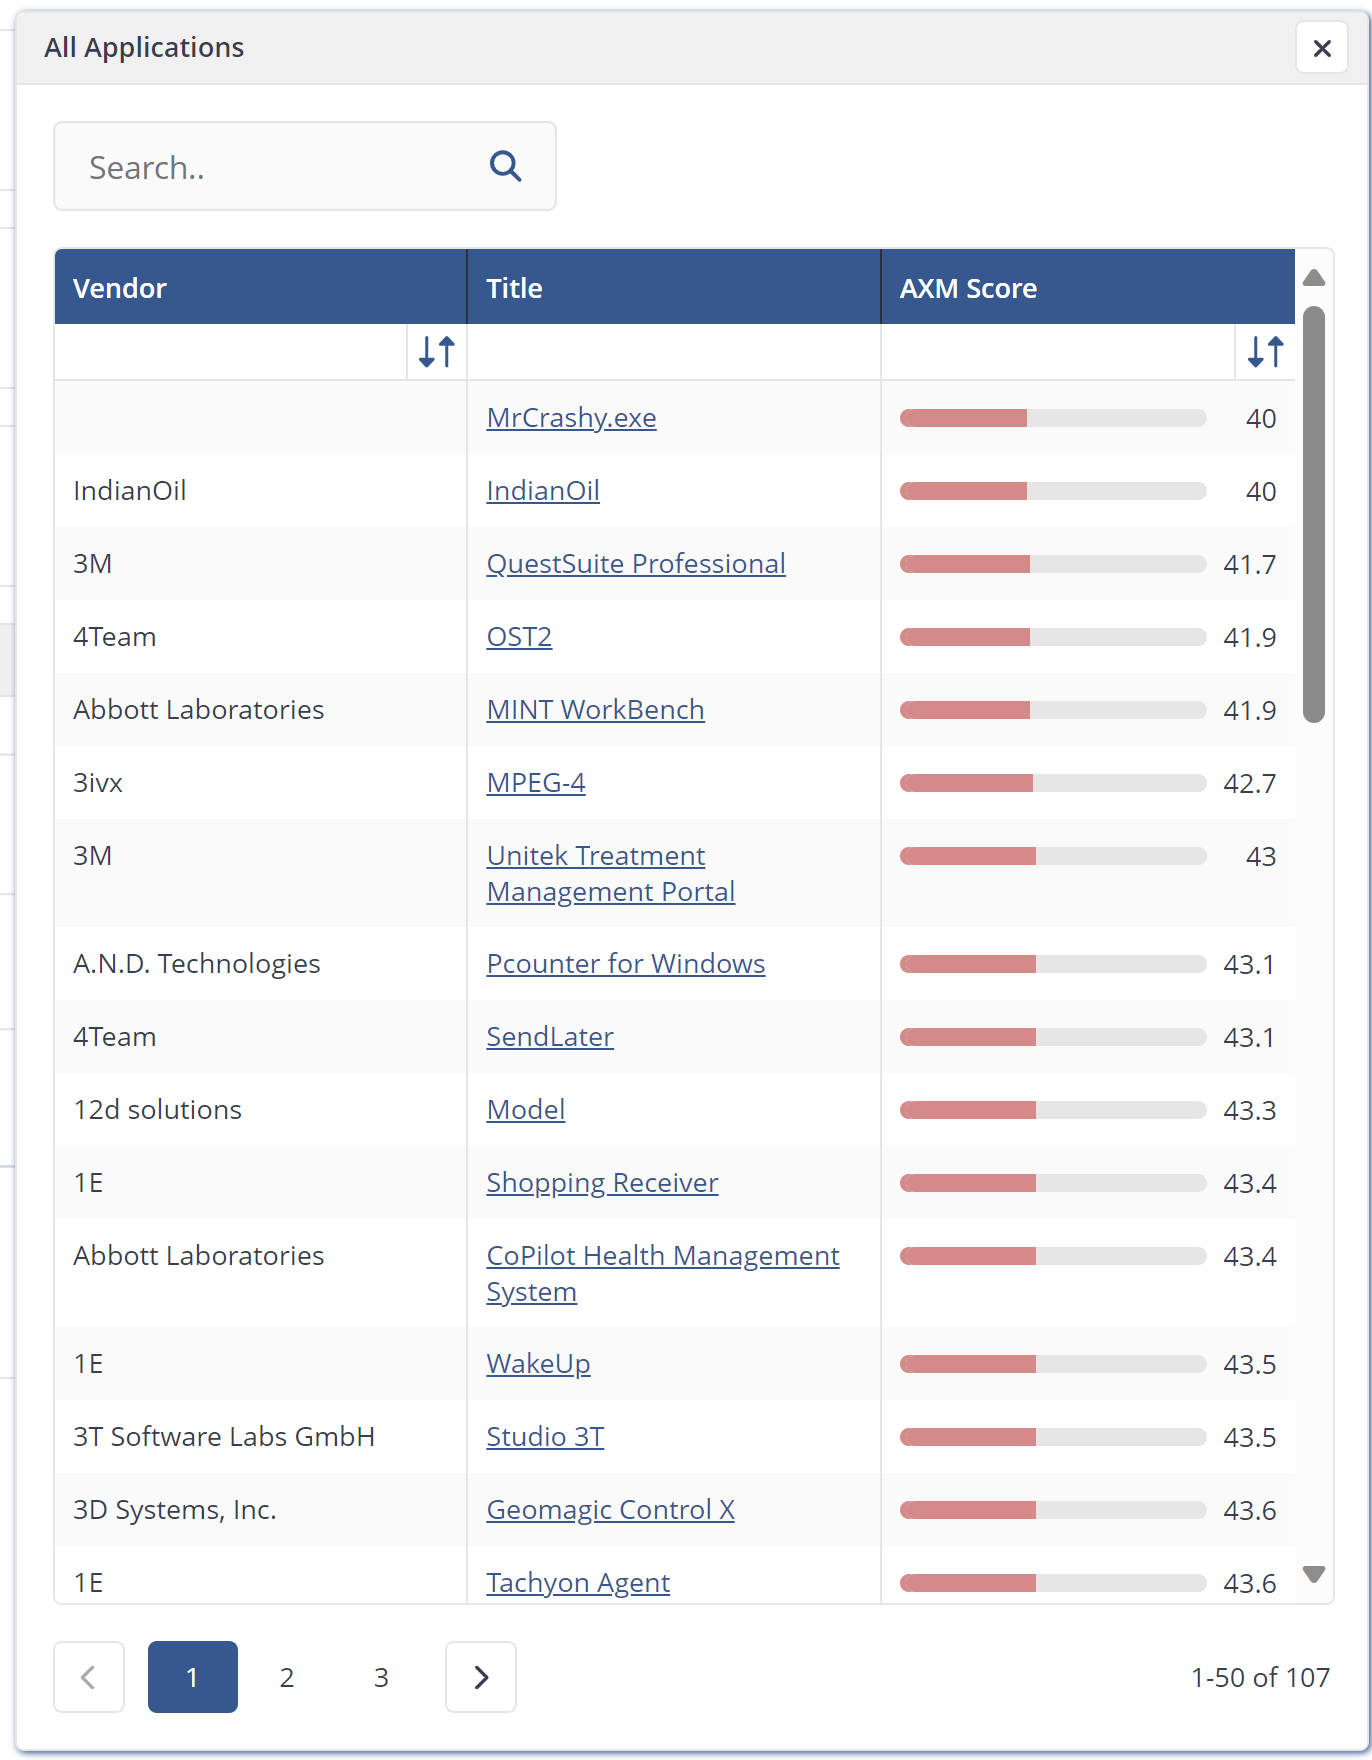
Includes an adjustable time range to compare metrics before and after events, enabling analysis of their impact on application performance.
The chart displays the aggregated number of sessions for the selected period, according to their AXM Score grade (good/average/poor). The bar graph displays the evolution of AXM scores over time, allowing users to make informed decisions around applications with friction and focus on reducing them. The chart dynamically updates as new data becomes available, allowing users to monitor the changes in AXM scores over time.
Clicking on either good, average or poor segments of the chart displays a drawer with those corresponding application for the selected time period. To investigate further you can click on an application title.

All Application list
The All Application list shows every application you are monitoring. Each entry provides essential details about the application's status and performance.
By clicking on an application title in the list you can review that application's details.
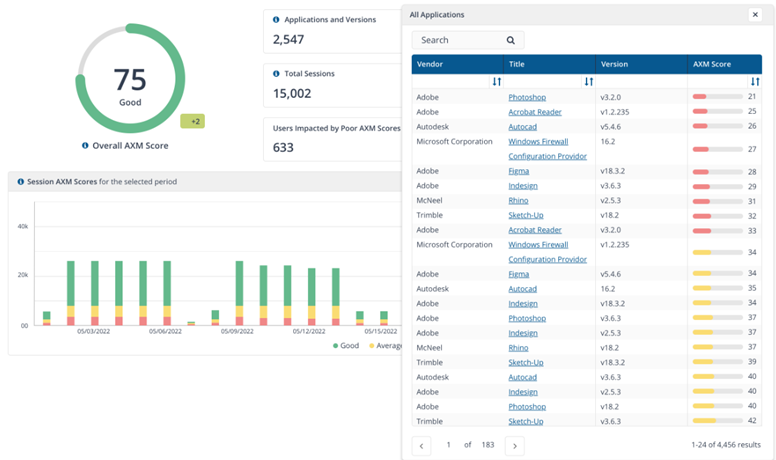
Application details
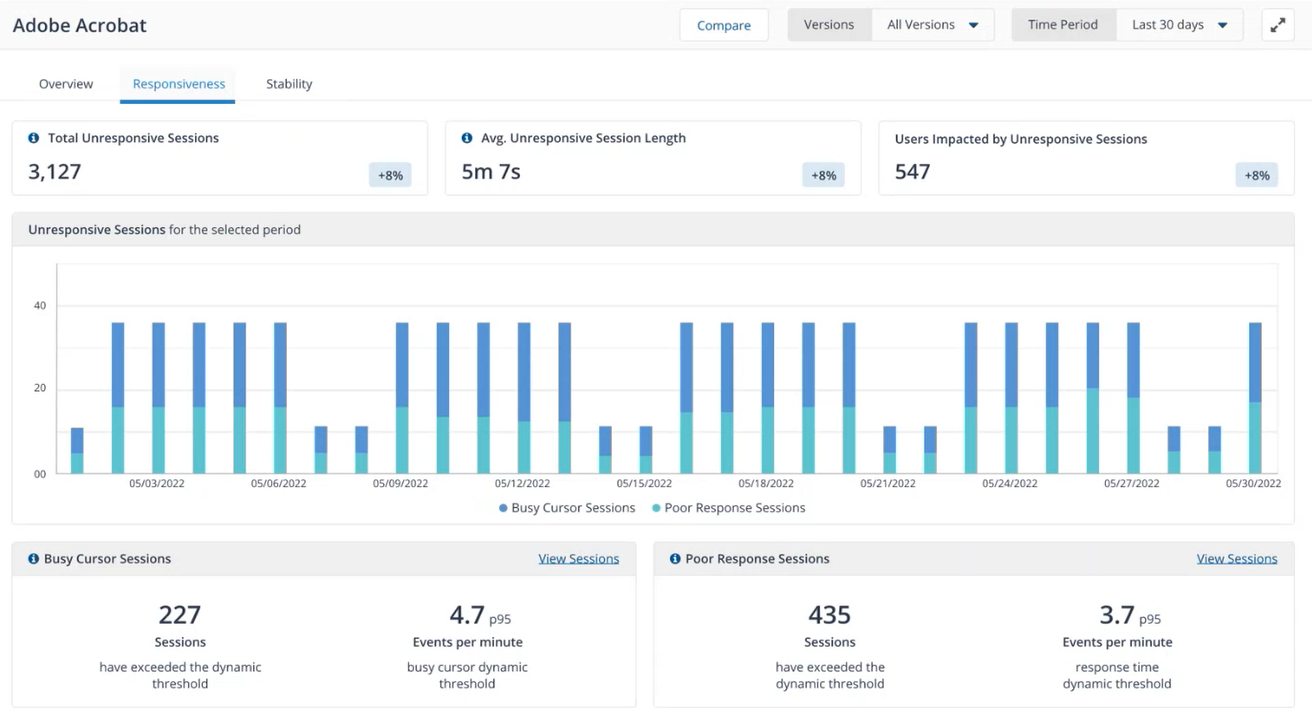
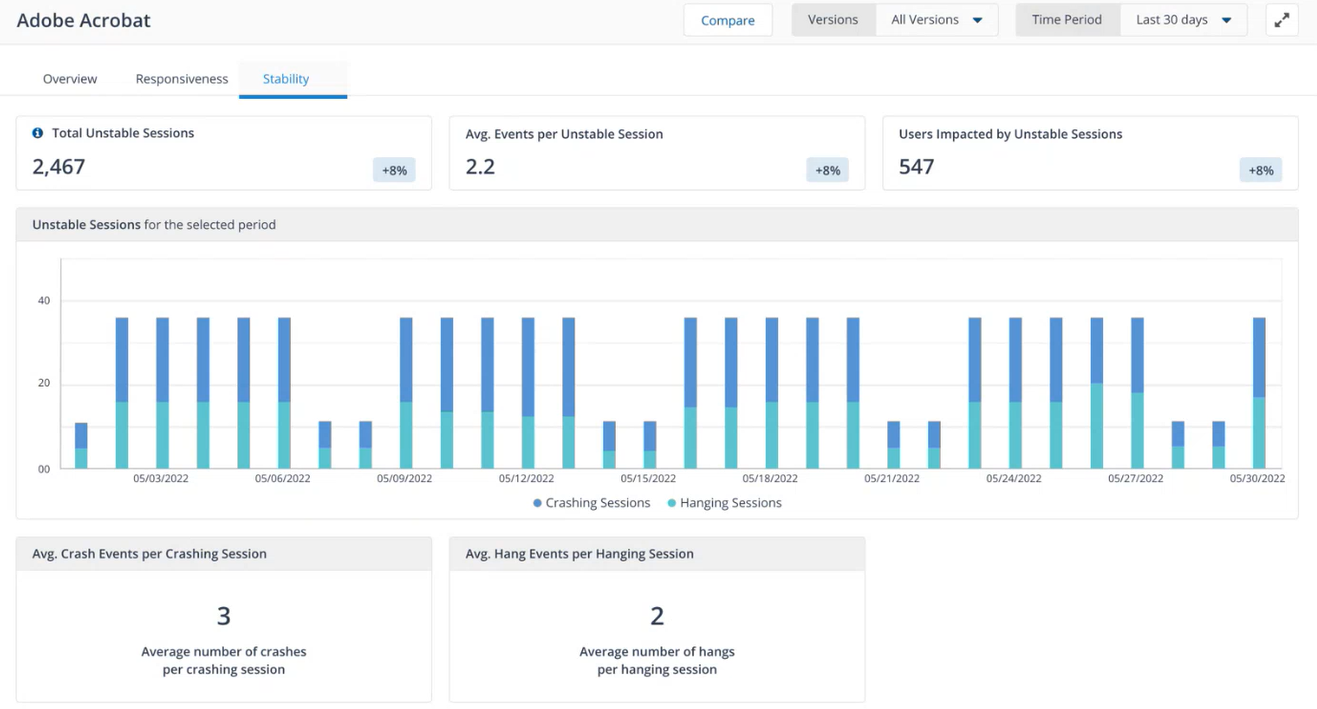
By viewing application details you can explore in-depth analytics, performance metrics, user behavior data, and more. The application details view includes three tabs.
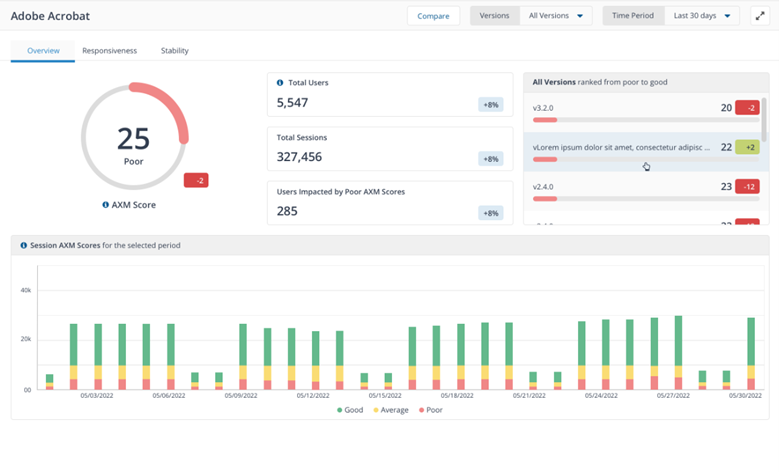
The Overview tab of each application features the following tiles:
AXM score - an aggregation of scores for every session in the selected Time Period
Session AXM Scores - the aggregated number of sessions for the selected period, according to their AXM Score grade, either good, average or poor
All Versions ranked from poor to good - every version of the selected software title ranked by AXM Score.
These scores are built from the Responsiveness and Stability tabs on the Application details page for a specific application, the associated metrics are gathered by the 1E Client.
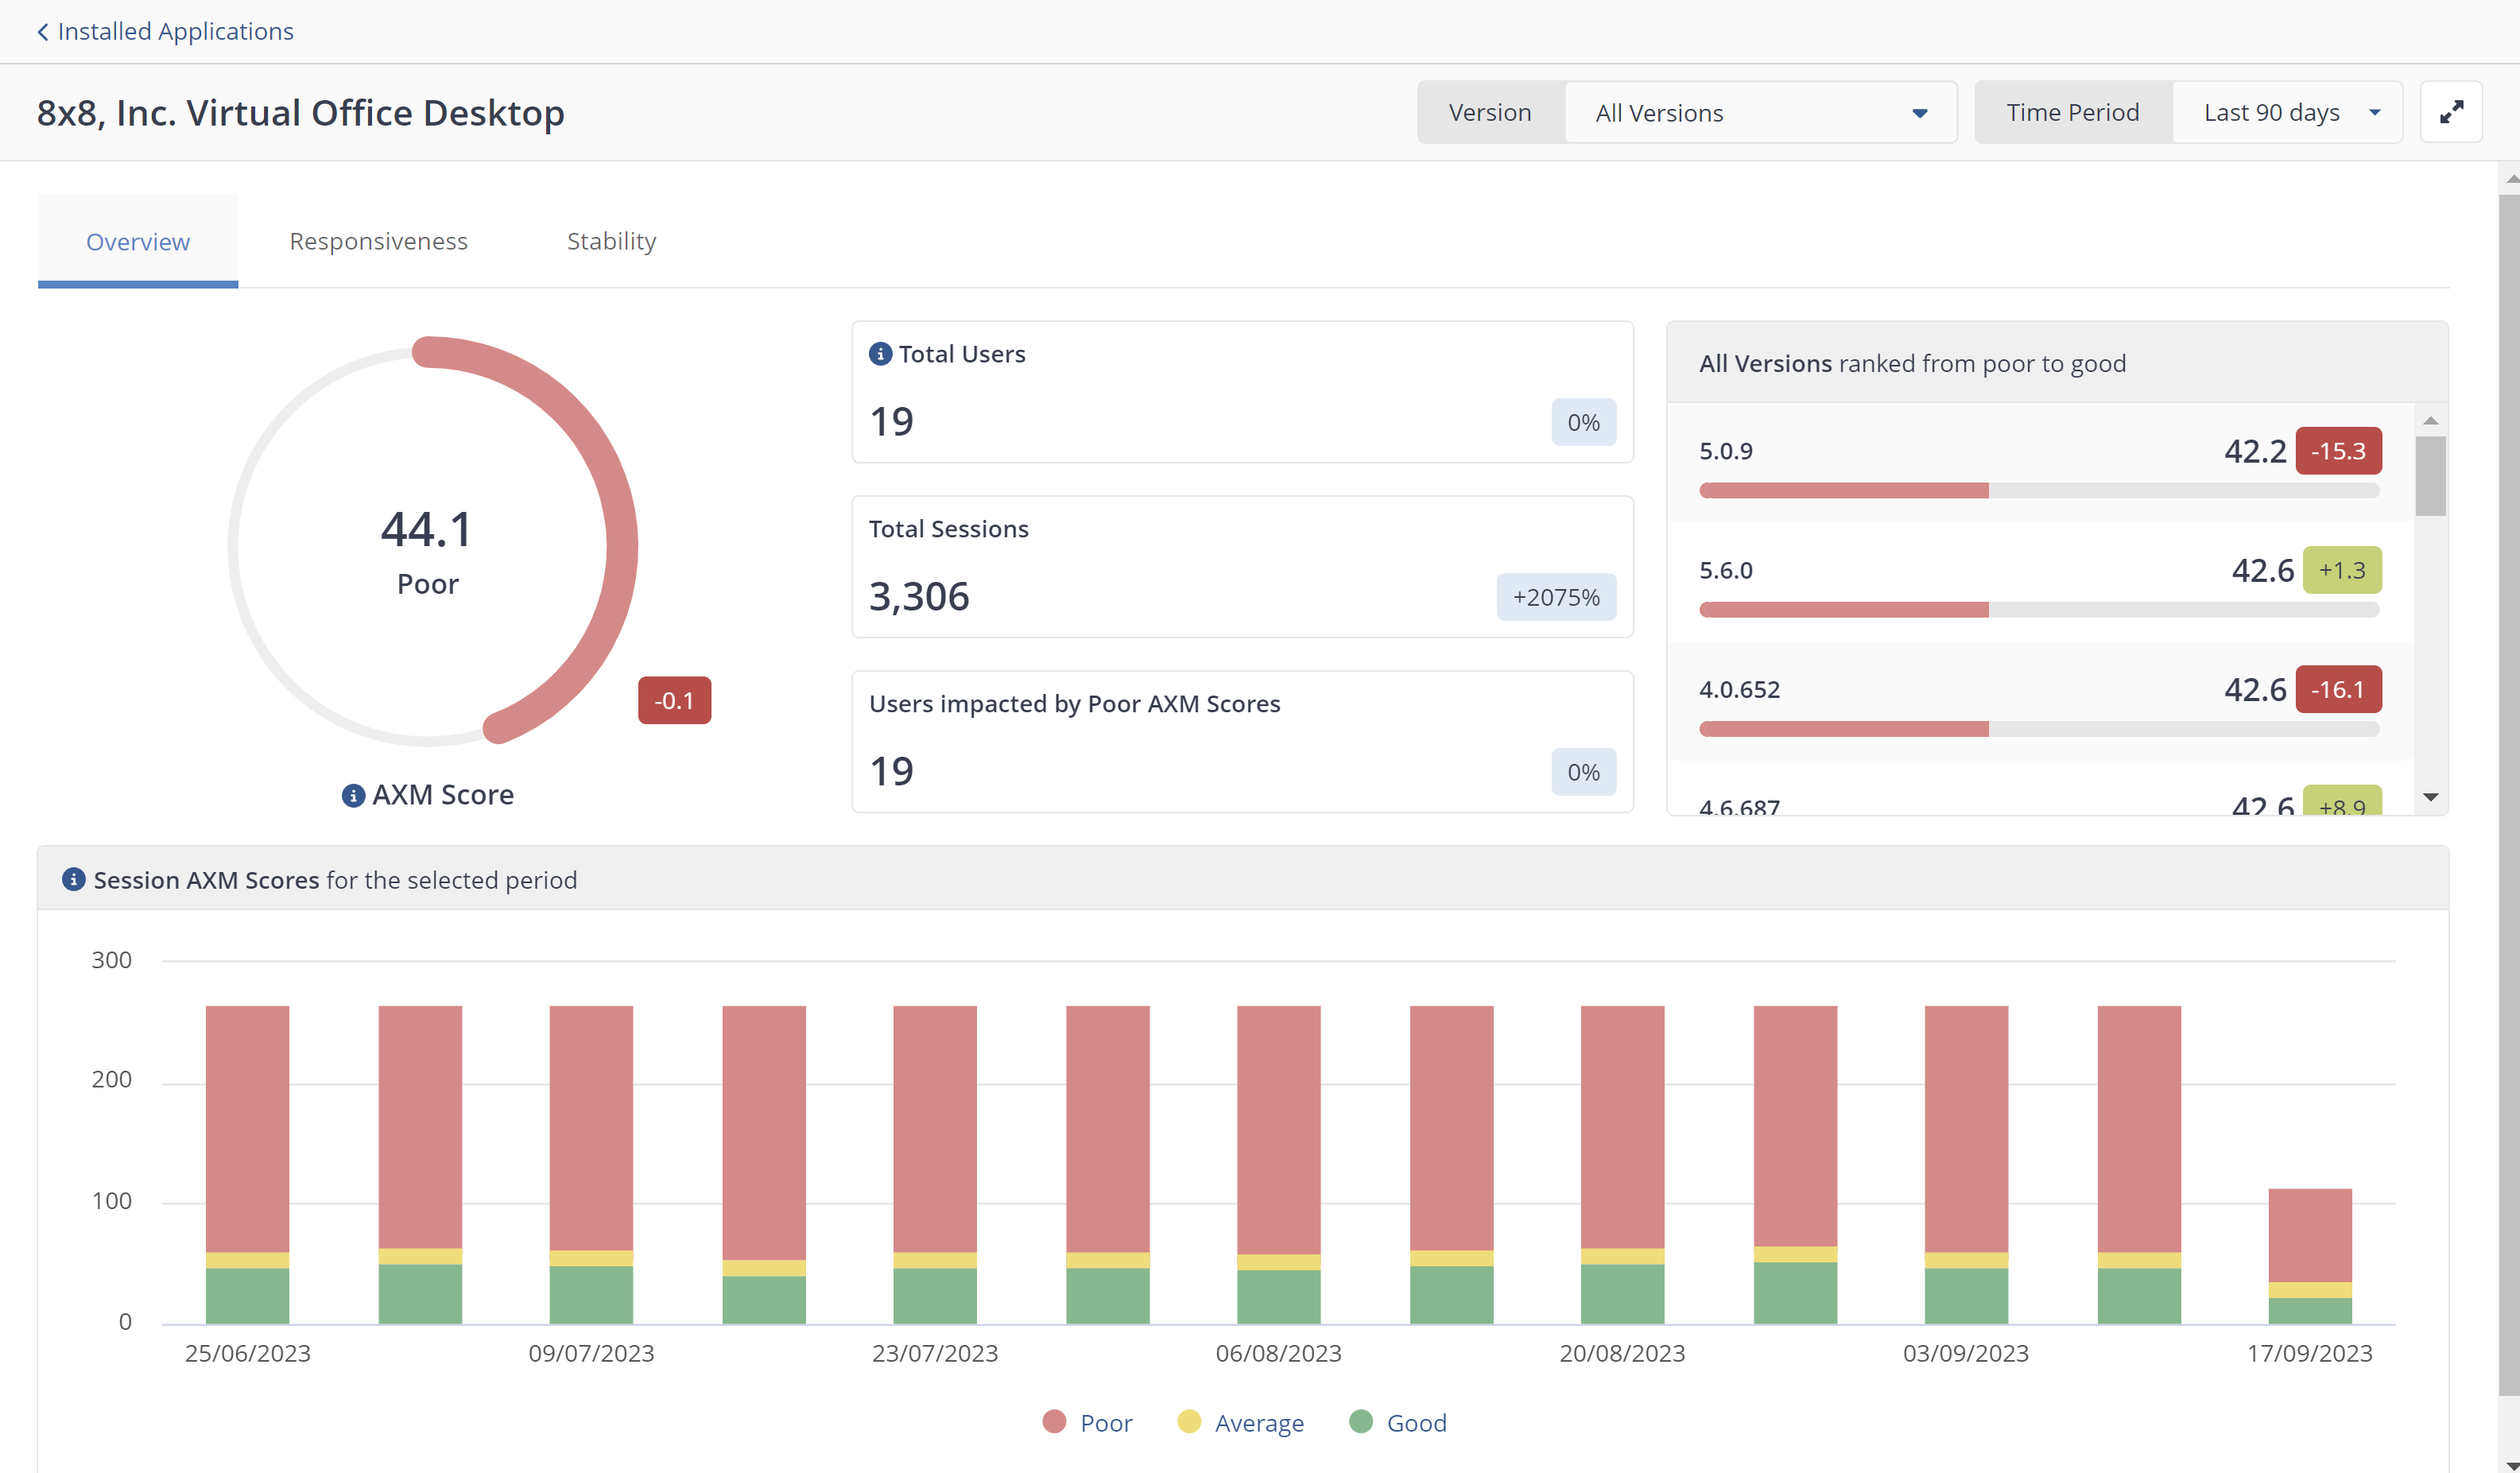
The Stability and Responsiveness pages use the percentile method for score calculation. In statistics, percentiles are used to understand and interpret data. The nth percentile of a set of data is the value at which n percent of the data is below it.
Percentiles are used to understand and interpret data. They indicate the values below which a certain percentage of the data in a data set is found.
Percentiles can be calculated using the formula n = (P/100) x N, where P = percentile, N = number of values in a data set (sorted from smallest to largest), and n = ordinal rank of a given value.
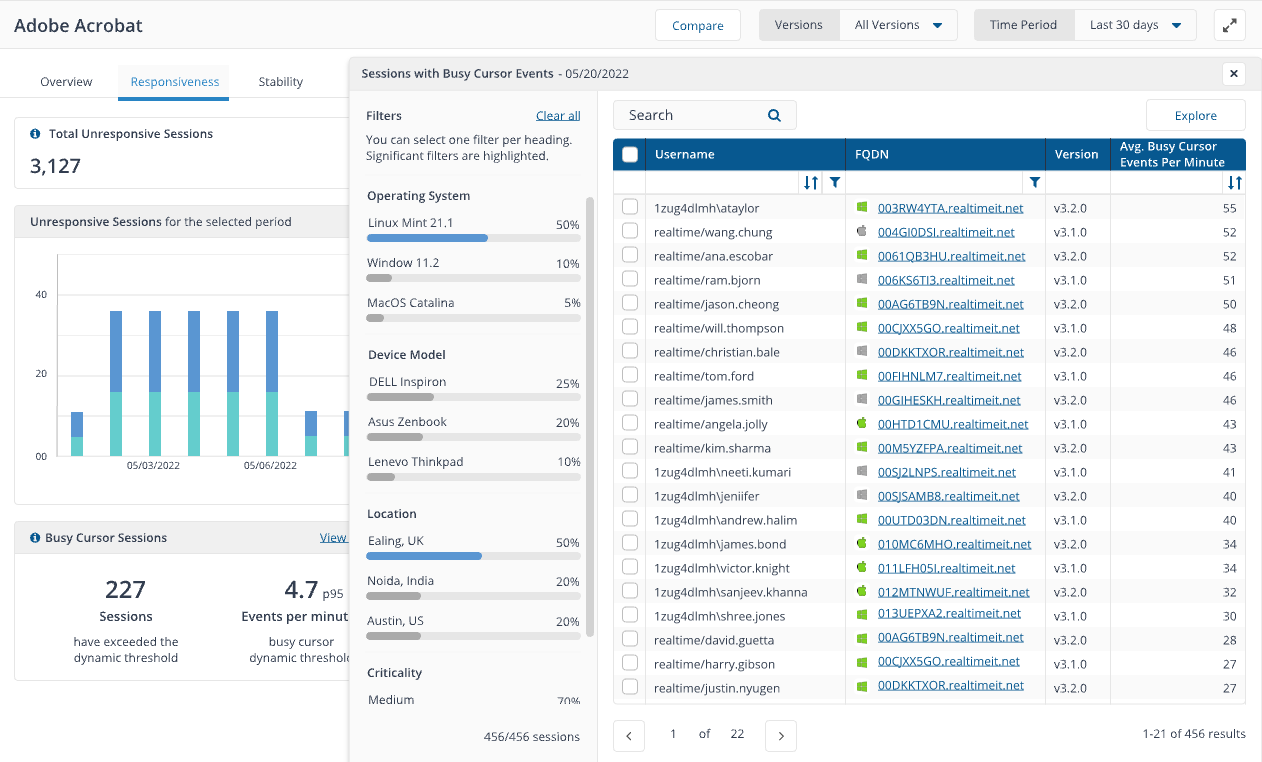
To help troubleshooting, there is a drawer that opens on the Stability and Responsiveness pages, where you can filter by Operating System, Device Model and Location and by specific device.
Web Applications
With AXM you gain insights into Core Web Vitals for your web-based business applications. Core Web Vitals by Google, are specific web performance metrics designed to measure the overall user experience of your website or web page.
By focusing on critical aspects such as web page loading, interactivity, and visual stability, these metrics directly influence user satisfaction and engagement. Core Web Vitals play a pivotal role in enhancing the digital employee experience (DEX). These metrics offer valuable insights into user interactions, optimizing application performance, and providing essential benchmarks for tracking the progress of application experience.
Note
Web Applications monitoring requires a Chromium plugin for data collection using the 1E Client and requires use of either Google Chrome or Microsoft Edge on the endpoints you want to monitor with AXM. Refer to AXM Browser Extension for details.
Overview
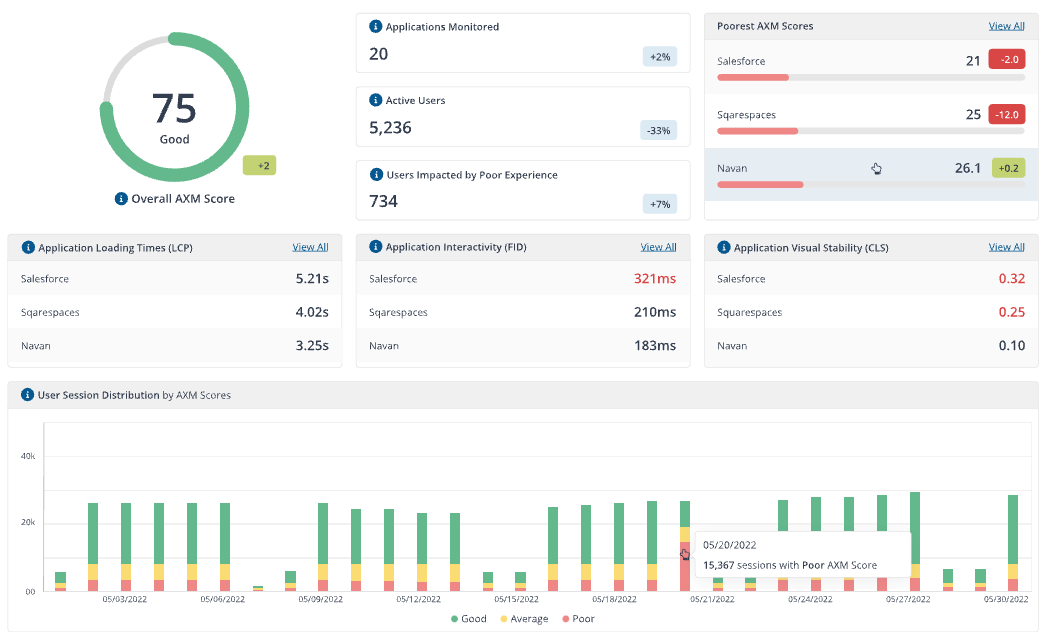
The Overview page provides a summary of your applications' performance at a glance. The Key metrics and charts displayed here help you identify any issues or trends.
Web application scoring is based on the Apdex standard.
Apdex (Application Performance Index) is an open standard for measuring software application performance. It scores the level of satisfaction of application responsiveness by calculating the degree to which user expectations compare to performance in a fractional 0 (no users satisfied) to 1 (all users satisfied) scale. For more details about Apdex refer to https://www.apdex.org/.
Note
The metrics used for AXM score calculation, are web vitals and page load time.
Metrics type | Description | Good | Average | Poor |
|---|---|---|---|---|
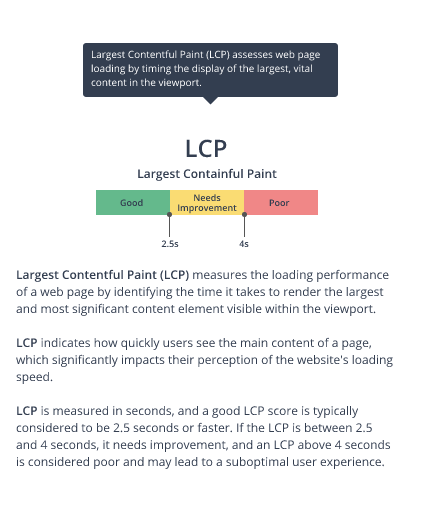
Largest contentful paint | Measure loading performance, basically how quickly you get the largest item drawn on the page. | <= 2.5 seconds | >2.5 seconds and <= 4.5 seconds | >4 seconds |
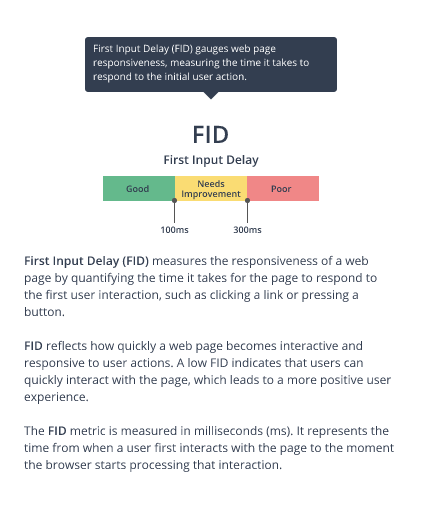
First input delay | Measures the time between when the user interacts with a page, clicking on a link or a button. For example, when the browser processes that click. It is there to measure the interactivity of a page. | <= 100 milliseconds | >100 milliseconds and <= 300 milliseconds | >300 milliseconds |
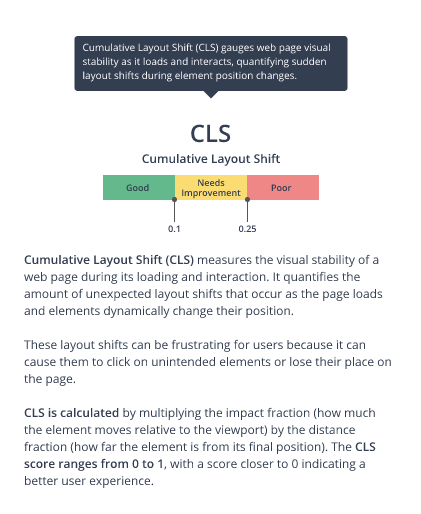
Cumulative layout shift | Measures the visual stability of the page. How much it changes as new content slots into place. | <=0.1 | >0.1 and <=0.25 | >0.25 |
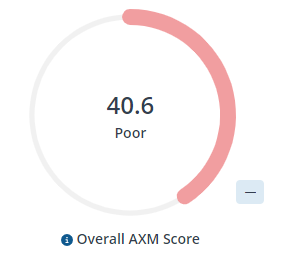
A quick measure of user frustration, based on Core Web Vitals.
Overall AXM Score provides an overall performance score for all the websites tracked in the Configuring web applications in AXM page. The score is calculated based on various factors, including page load time, server response time, and other performance metrics. The score updates dynamically, reflecting the latest data for all the tracked websites.
A prioritized list of applications with the lowest AXM scores, aimed at guiding troubleshooting efforts.
Providing a quick overview of the total number of web applications currently being monitored by AXM. This tile serves as a helpful indicator to understand the scope and coverage of the monitoring system. The tile updates dynamically to reflect any changes in the number of monitored web applications.
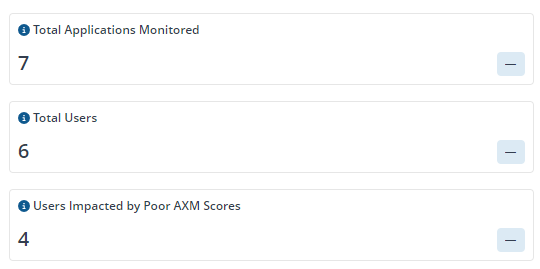
A count of users that have interacted with any monitored web application within the seelcted time period.
The Total Users tile shows the number of users currently accessing all the tracked websites in real-time. It allows you to monitor the live user activity across your monitored websites and updates dynamically, reflecting the latest data.
The tile displays the cumulative number of users who have visited the tracked website or path, updates dynamically without requiring page refreshes and provides a clear and concise representation of the total user count.

Web applications with the poorest AXM Score.
Provides users with a ranked list of applications based on their AXM scores. This tile allows you to identify websites that require immediate attention due to poor performance, and updates dynamically, reflecting the latest AXM scores for each website.
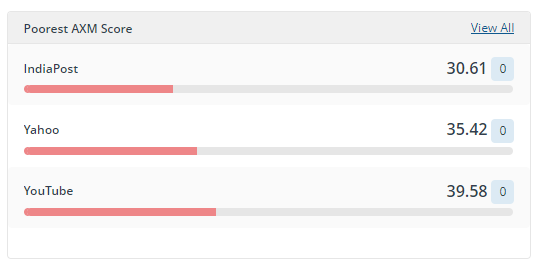
Clicking View All displays the Applications with Poorest AXM Score drawer with your web applications sorted by AXM score along with the corresponding user sessions.
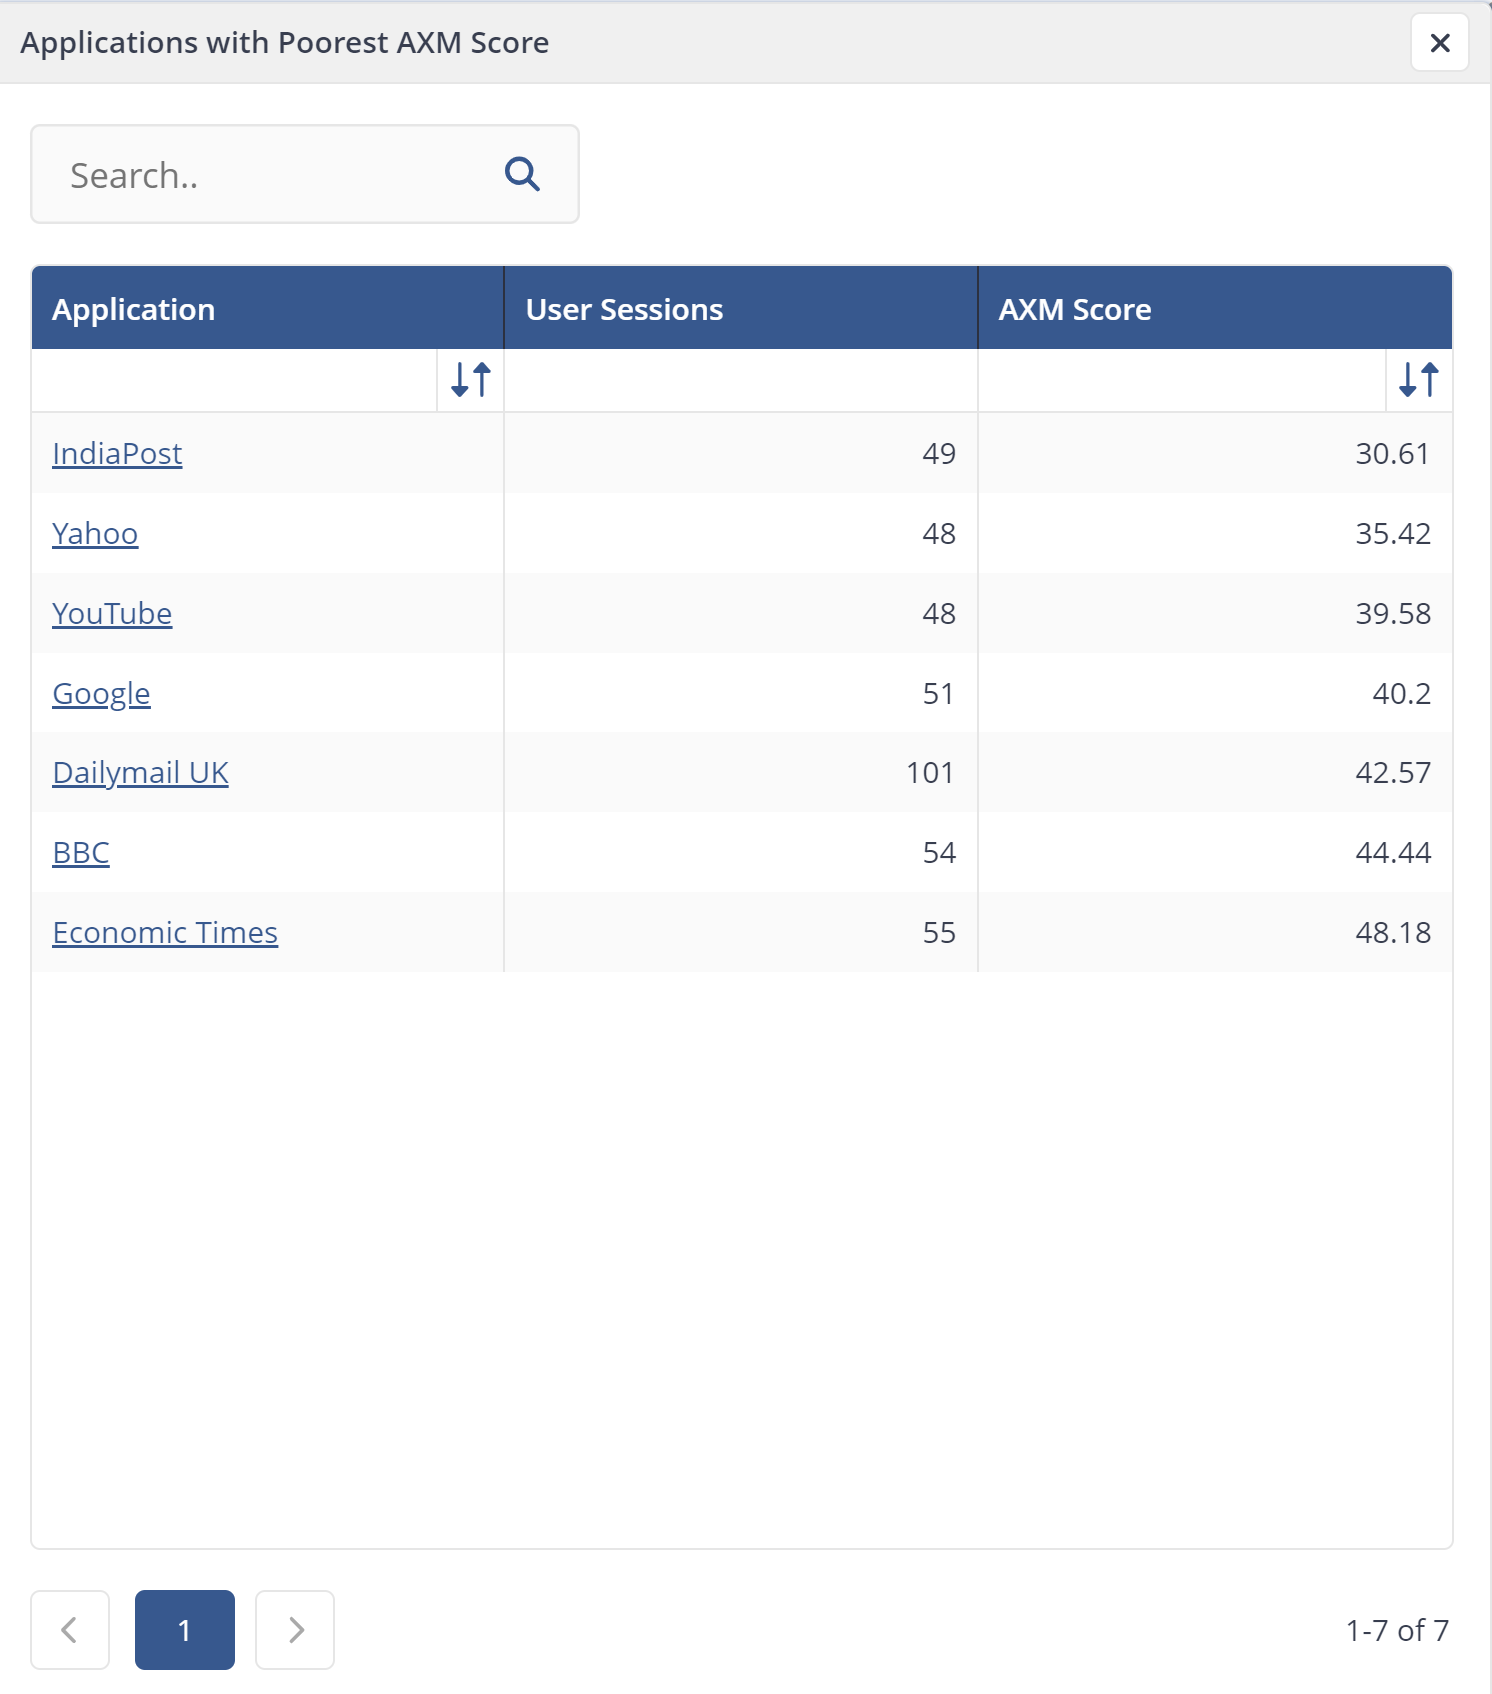
To investigate further you can click on an application title to navigate to a dedicated page with further details and analysis of that specific application.

Aggregated number of sessions for the selected period, according to their AXM Score grade (good/average/poor).
Investigate further with the User Session Distribution by AXM Scores chart allows you to isolate, troubleshoot and remedy the causes of user sessions with poor AXM scores.

Clicking on a web application title allows you to focus on an individual application where you can view its Total Users, Users Impacted by Poor AXM Scores and Percentage of Users with Poor Experience.
The individual web application page also contains various metrics related to the monitored web path for the associated web application:
Sessions column represents the number of sessions initiated by users on each page path
Visits column indicates the total number of visits (unique sessions) for each page path
LCP, FID, and CLS columns display the respective Core Web Vitals metrics for each page path.

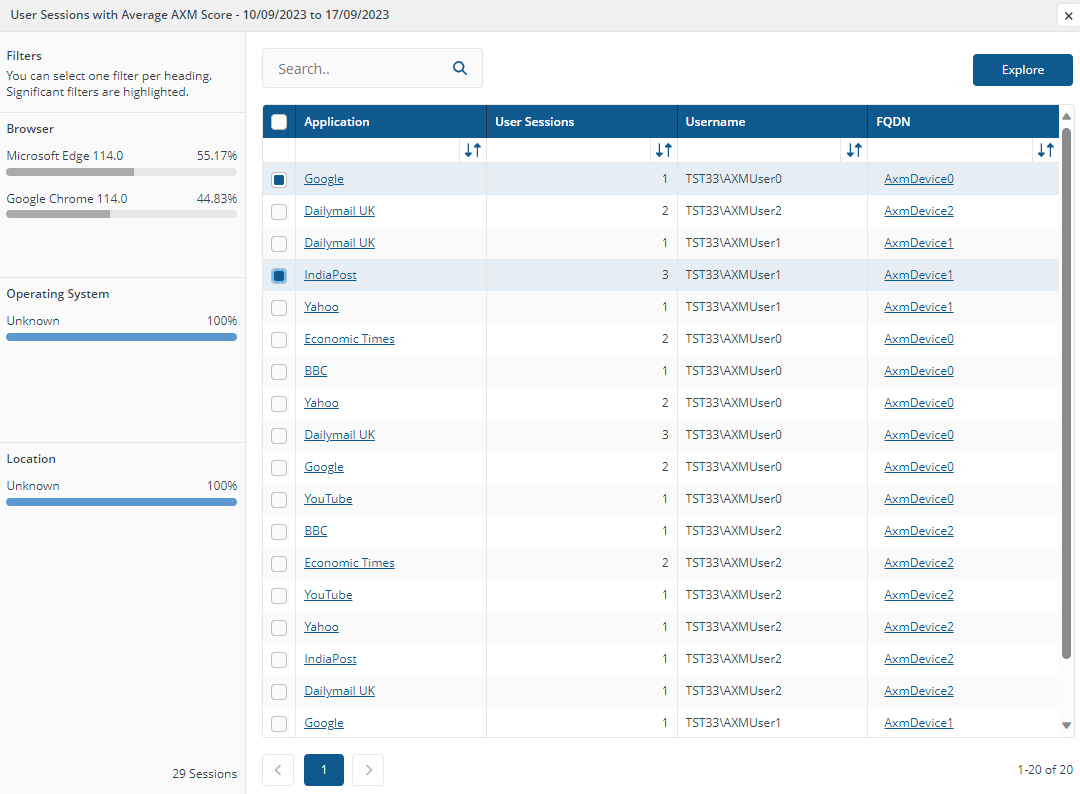
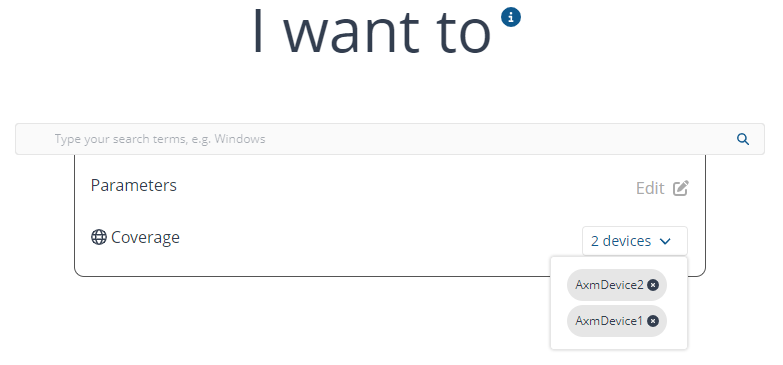
Selecting one or more applications in the Application column and clicking Explore allows you to run 1E instructions against the devices using those applications.
Core Web Vitals metrics
Core Web Vitals are a set of specific, user-centric metrics that Google uses to assess the overall performance and user experience of a website. These metrics are considered crucial for evaluating the quality of web pages and how well they perform for real users. Google introduced Core Web Vitals as a part of its broader effort to promote a better web experience.

Core Web Vitals consists of three areas.
Definition - LCP measures the loading performance of a web page. It specifically gauges the time it takes for the largest content element (an image, video, or text block) to become visible within the viewport of the user's browser.
Why it Matters - LCP reflects the perceived loading speed of a page. A fast LCP indicates that users can see and interact with the main content of the page quickly, which enhances their experience.
Definition - FID measures the responsiveness of a web page. It calculates the time it takes for a user to interact with a page (e.g., clicking a button or filling out a form) after the page has initially loaded
Why it Matters - FID is crucial for determining how quickly users can engage with your site. A low FID score indicates that users can interact with your website without experiencing frustrating delays.
Definition: CLS measures the visual stability of a web page during the loading process. It quantifies the amount of unexpected layout shifts that occur as users interact with the page
Why it Matters: A good CLS score indicates that the page's elements do not move around unexpectedly, preventing users from accidentally clicking on the wrong items due to layout shifts. A stable layout contributes to a positive user experience.
Configuring web applications in AXM
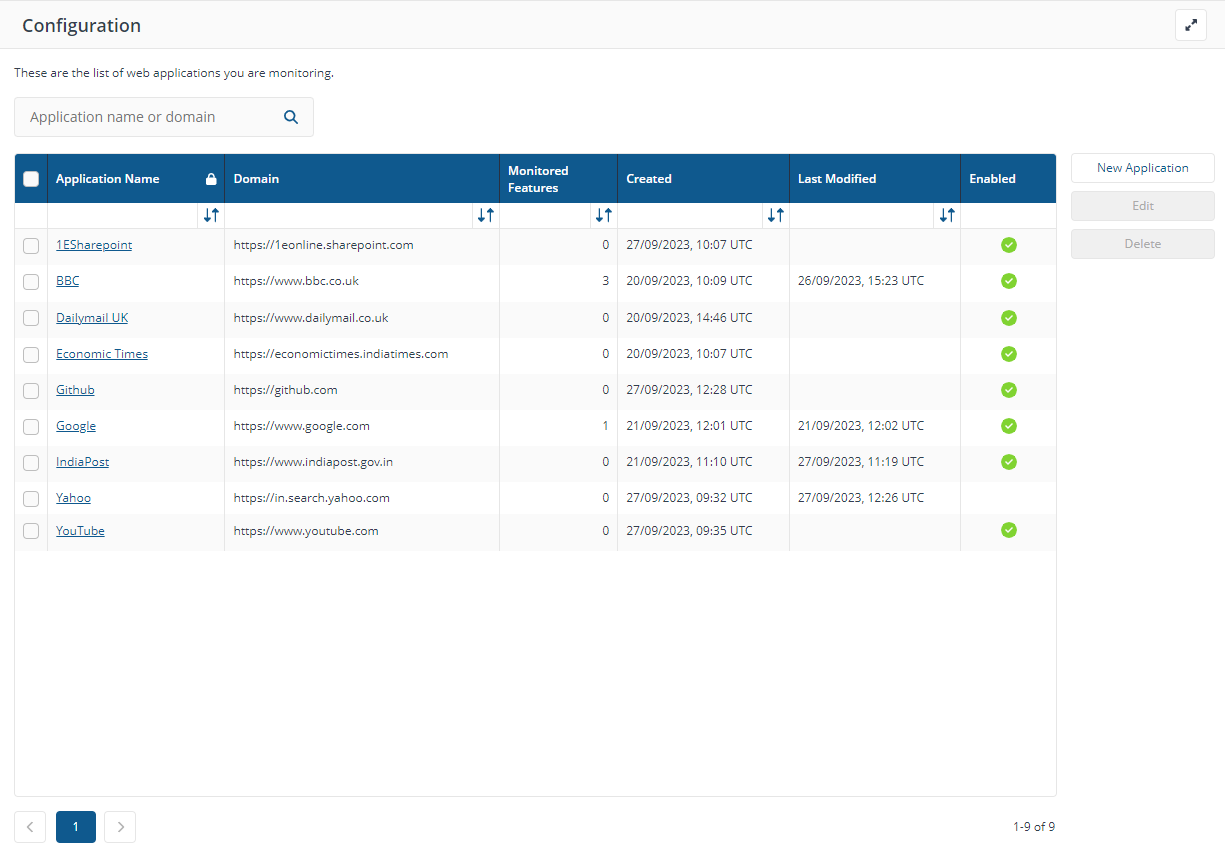
The Configuration page shows a list of web applications you are monitoring.
Administrators can add URLs or domains the tool should actively monitor. This ensures the monitoring tool focuses on the critical parts of an application.
Tip
For whitelisting, administrators can also individually add URLs or domains.
Each URL being monitored in the list has a green tick indicator in the enabled column. When a URL is Enabled for tracking, it is actively monitored by AXM, when a URL is disabled for tracking, it is displayed in the list but not marked as Enabled.
Important
Application names must be unique
An application domain name cannot be modified after it is created
Two applications cannot be mapped to the same domain name
A domain name will be validated against a regular expression (regex)
Domain names cannot end with a slash ('/'). For example,
https://www.google.com/is not a valid domain name, buthttps://www.google.comisApplications cannot have more than 20 paths
Applications cannot have duplicate paths in the same domain, even if the feature names are different
Paths cannot contain the characters ? or *or .
Paths must start with a slash ('/')
The path value cannot be null or empty
Paths with the feature name
_Globalare not allowedThe feature name for a path cannot be null or empty
Creating contains paths are not supported. For example, if a user creates the path
/O/Reports, they will not be allowed to create the path/O/Reports/Accounts. Users must create more specific paths, such as/O/Reports/HR and /O/Reports/Accounts.
To add a new application to whitelist, click New Application.
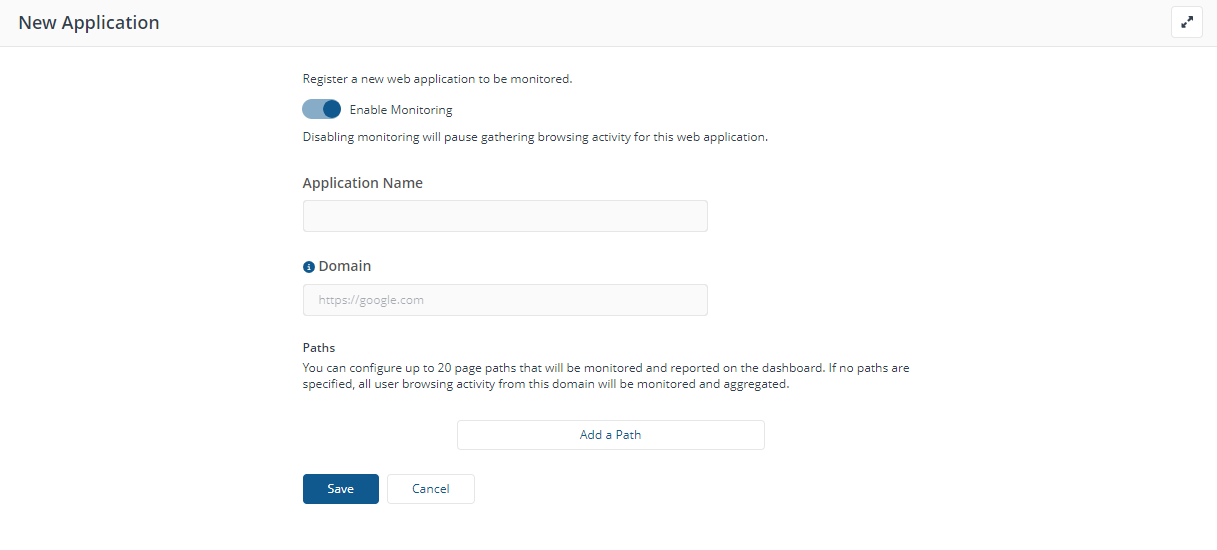
Enable Monitoring - turn on monitoring for URLs.
Application Name and Domain - enter the URL and Name for each application you would like to track. These will display in the following reports. Add paths underneath to track sub-pages.
Page Paths - here you can add the Page Path URL segment that corresponds to the desired feature's location. For example, if the web application has a shopping cart feature, the associate Page Path might look like /shopping-cart or /checkout-process.
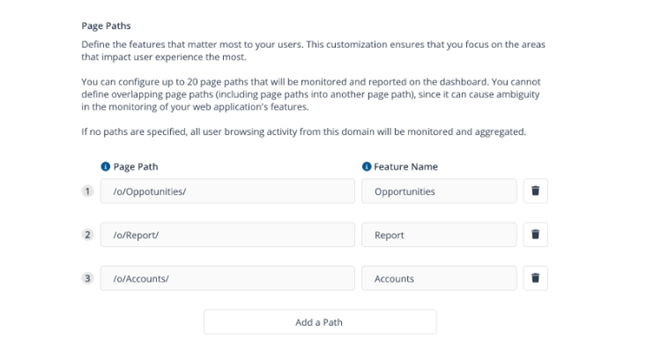
Click Edit on the AXM Configuration page to make changes to the URL and save the updated version. After editing a URL or associated paths, the modified URL is shown in the list of tracked URLs on the configuration page.
You can configure up to 20 page paths that will be monitored and reported on the dashboard. If no paths are specified, all user browsing activity from this domain will be monitored and aggregated.
Note
Before making changes to page paths for a web application, please note that the data for the original URLs will remain intact. However, new data will be collected based on the updated configuration.
To delete an application, select the title in the Application Name column and click Delete.

Note
All collected data for that application will also be deleted.

