Score Calculation popup
The popup that is displayed when you click on the information icon on a chart provides descriptions for how the chart's score is calculated. If it is calculated differently for Windows and macOS a tab is displayed that lets you select the platform and see the relevant description.
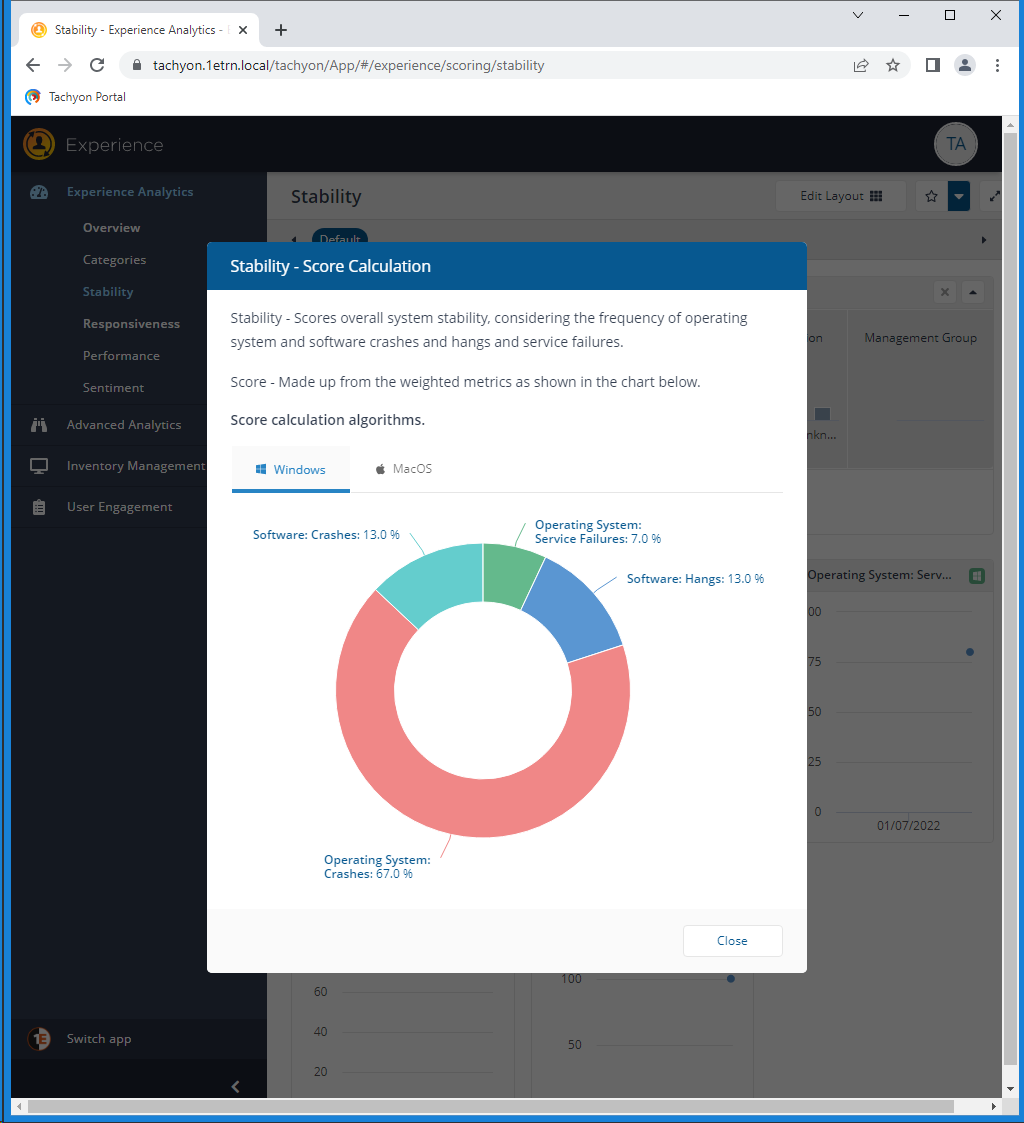
For example, the following picture shows the stability score calculation for Microsoft Windows.
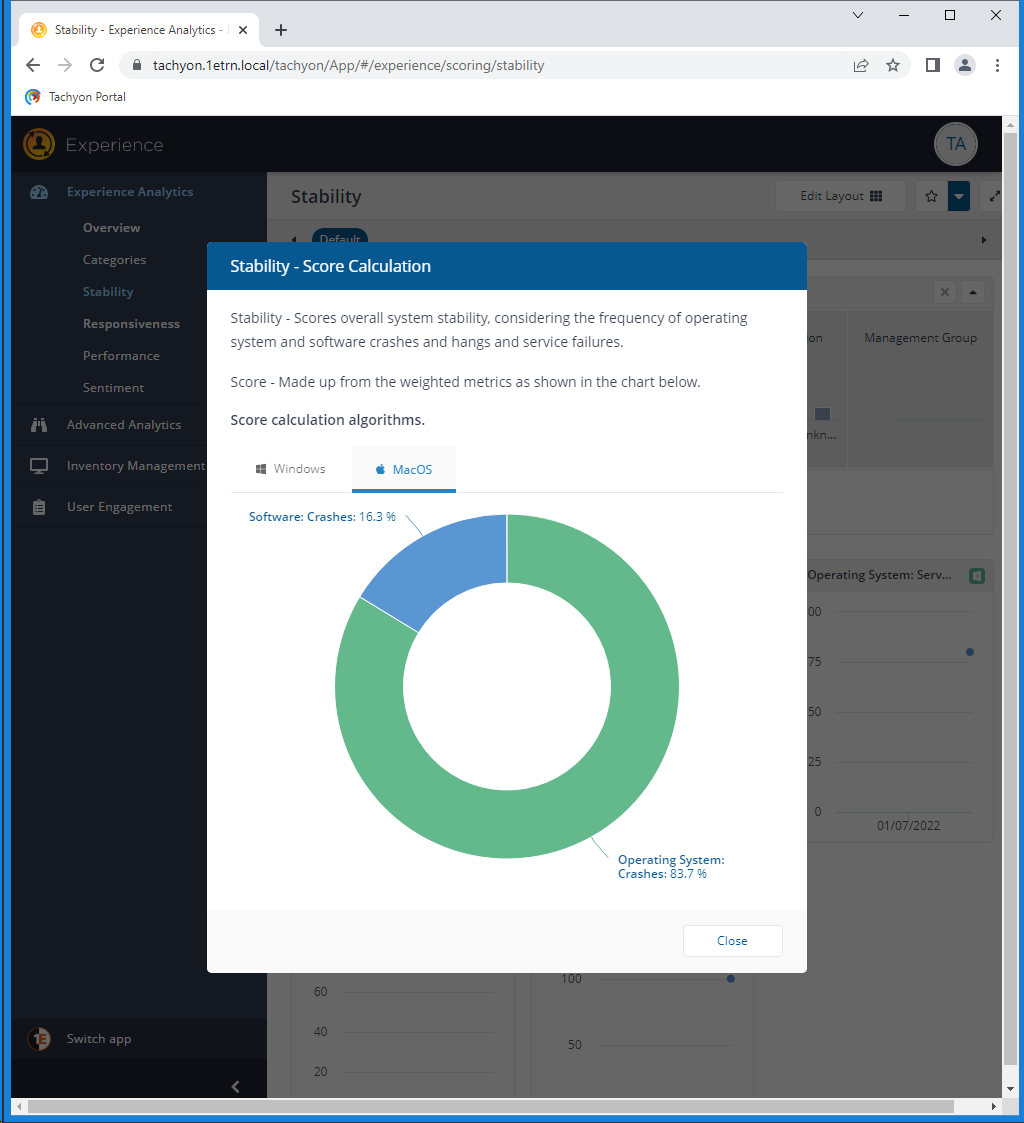
Whereas the stability score calculation for macOS is like the following picture.