Product Usage
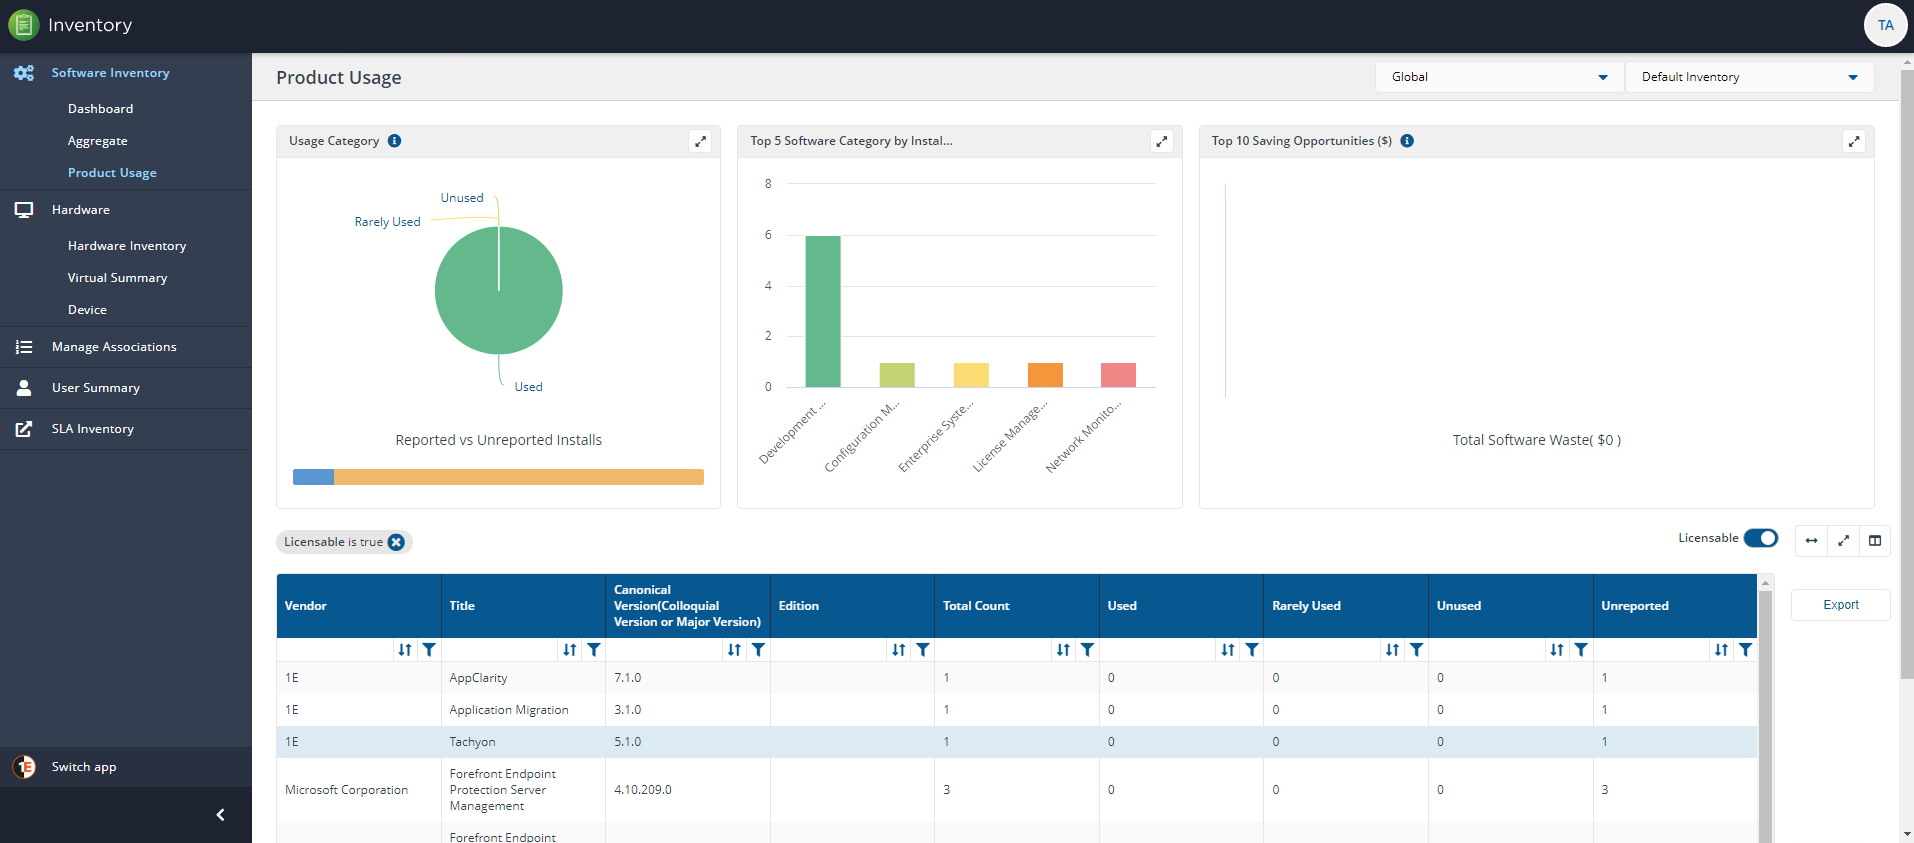
The Product Usage page shows the distribution of software installs, the top five categories by install and top saving opportunities across your software estate.
In the top right of the page in line with the screen title are two dropdown lists, Global and Default Inventory. If you select the Global dropdown list and look at the available options, you'll see any Management groups you have configured listed there.
If you have multiple Management Groups, choose each option and see how the display changes to show the software installed on each Management group, you may need to scroll to see all the groups. To find out more about Management Groups refer to the Management Groups page. If you have configured more than one Inventory they will be available to choose from the Default Inventory dropdown list.
By clicking each colored bar and segment in the three top panels you can narrow the view to only those related products. The table below the top panels is then dynamically updated with these results which are exportable to a downloadable .TSV format. For both the displayed table and the exported file you can choose which columns are shown and exported.
Note
You can choose which columns are displayed in some detail tables to increase readability. On pages where you can pick the displayed columns you'll see a new control like the one below:

To find out more about this feature refer to Choosing the columns displayed in reports.
Available Product Inventory columns:
Column | Description |
|---|---|
Vendor | The software vendor. |
Title | The software title. |
Canonical Version (Colloquial Version or Major Version) | If known or exists the Colloquial version is installed. |
Edition | The edition installed. |
Total Count | Total count per software title. |
Used | Total count of used instances of a title. |
Rarely Used | Installs are categorized as rarely used. |
Unused | Installs are categorized as unused. |
Unreported | Total count of titles where usage information is unavailable. |
Price per Unit (USD) | The price per title is shown in the default currency. |
Licensable | Yes or No if the software is Licensed. |
Software Category | Category information is set in Configuration Manager. |
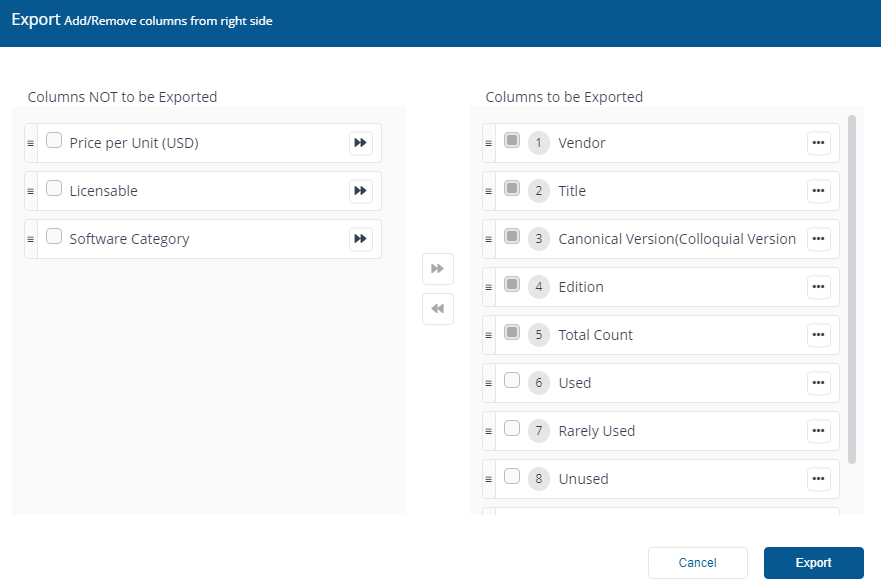
You can use the Export button to export currently displayed data in a downloadable report.
When you click on the Export button you'll see the Export popup. You can choose which columns to export in the same way you can choose columns to display in the main report panel.
The report is exported in a .TSV format, for example, InventoryProductUsage_20200813102621.tsv and is downloaded to the browser's download folder.
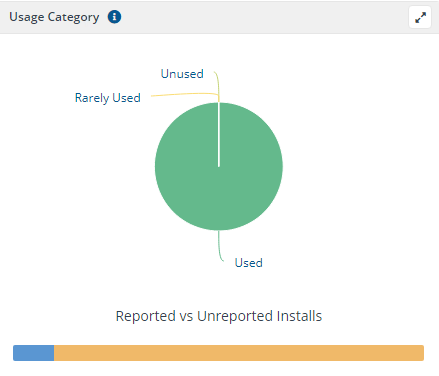
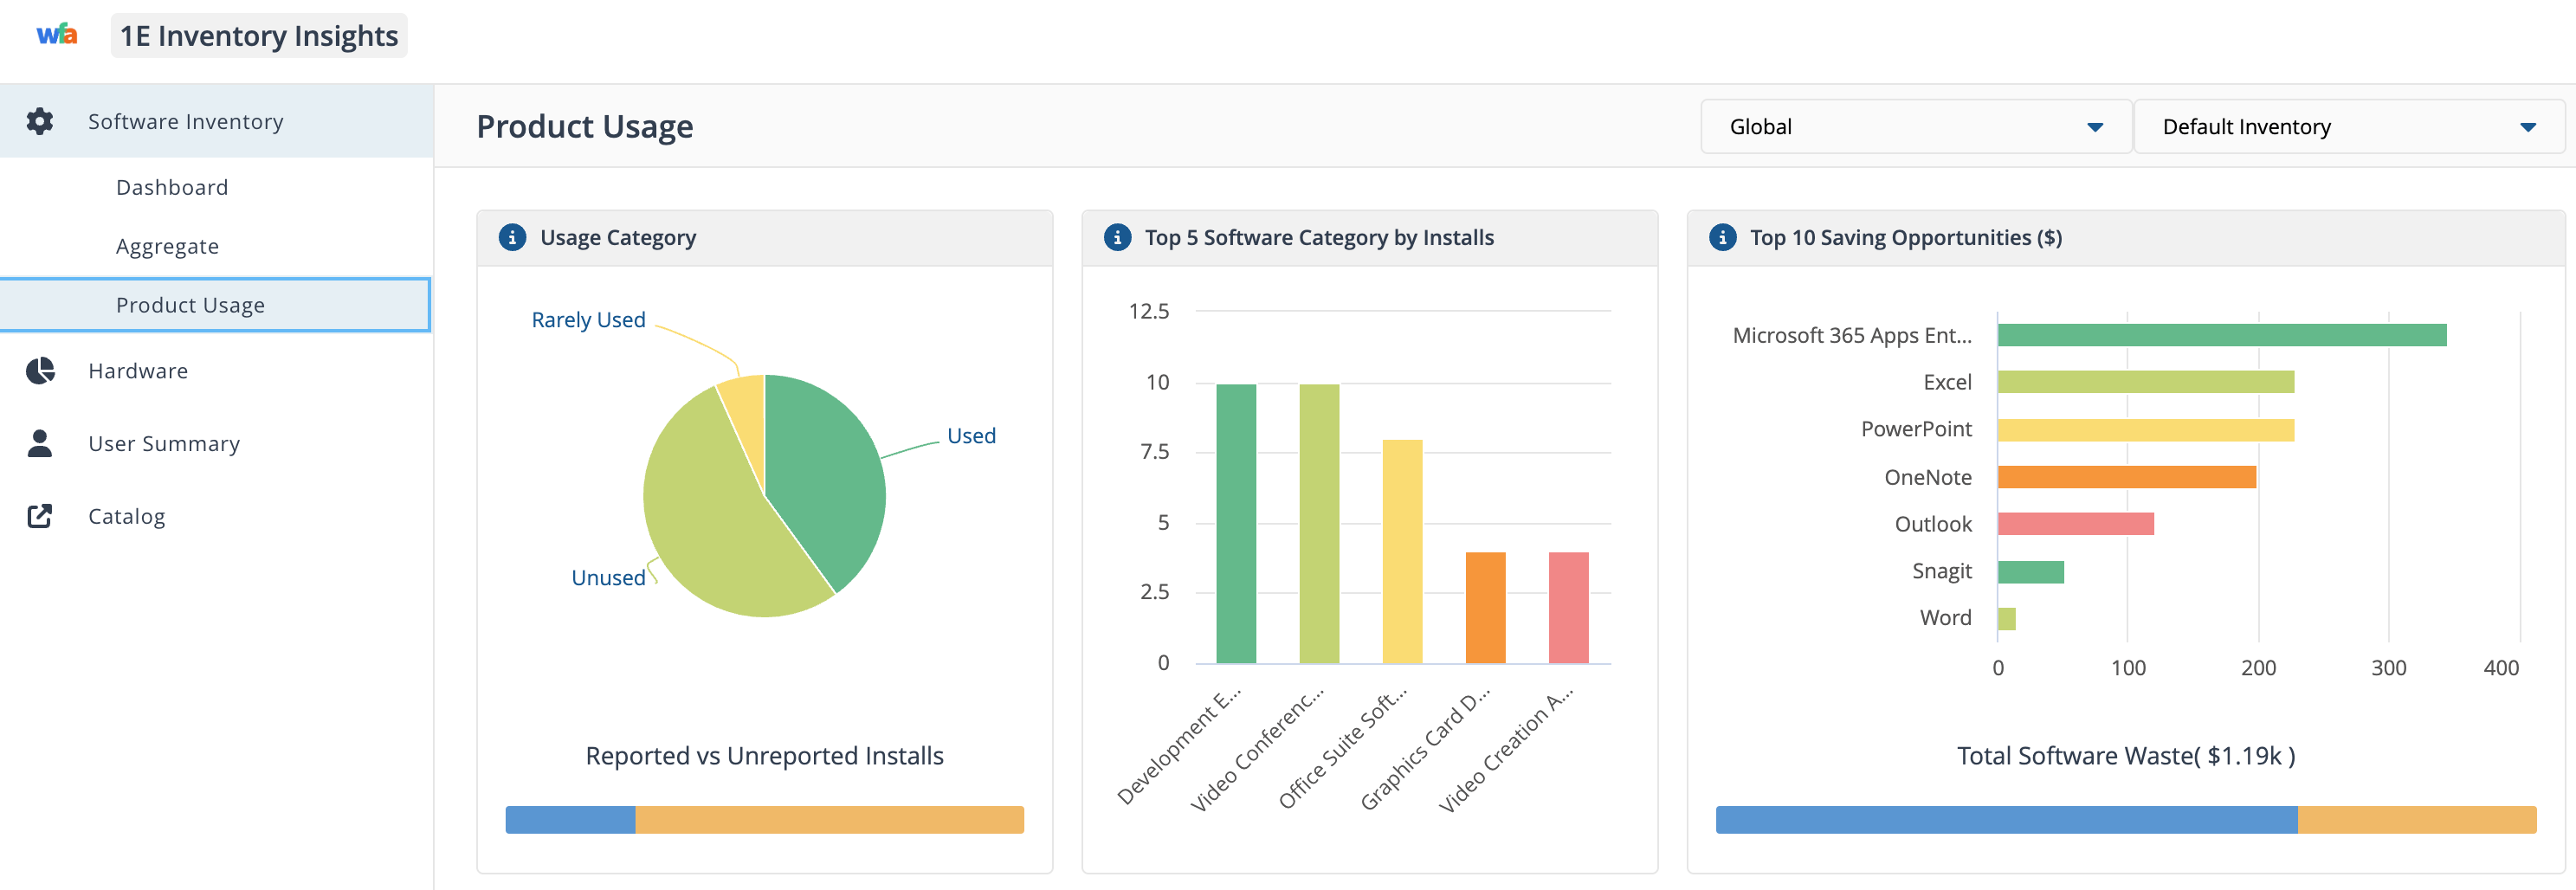
Usage Category
The pie chart shows the distribution of installs Used, Rarely used, and Unused as a percentage of total installs that report usage (i.e. Total Reported Installs). The bar at the bottom shows the distribution of installs as Reported and Unreported as a percentage of Total Installs.
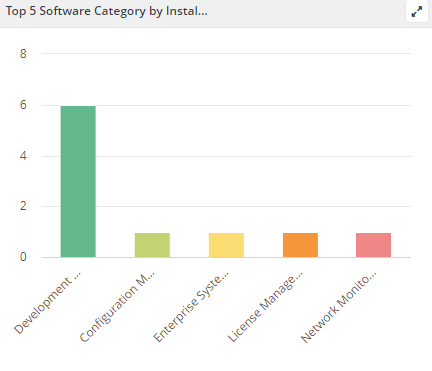
Top 5 Software Category by installation
The bar chart shows the top five categories by installs. The chart ignores operating systems and internet browser categories for calculating the top five categories.
Top 10 Saving Opportunities ($)
The bar chart shows the top ten products offering maximum saving opportunities in USD. The calculation is based on multiplying a product's unit price and the sum of Unused and Rarely Used installs. The bar at the bottom shows the total opportunity in USD, segregated from Unused and Rarely Used installs.
Note
Both Software Reclaim and Inventory Insights display Top 10 Saving Oppurtunites but you may see differences in the data they present to you. This is because the opportunity cost for each app is calculated differantly:
Software Reclaim opportunity cost:
Includes exact product waste (unit price multiplied by rarely used and unused software)
Does not report software from server devices
Considers cost values from created reclaim policies.
Inventory Insights opportunity cost:
Includes reporting software from server devices
Relies solely on the Catalog for costs
Is a high level figure that does not account for license metric cost.