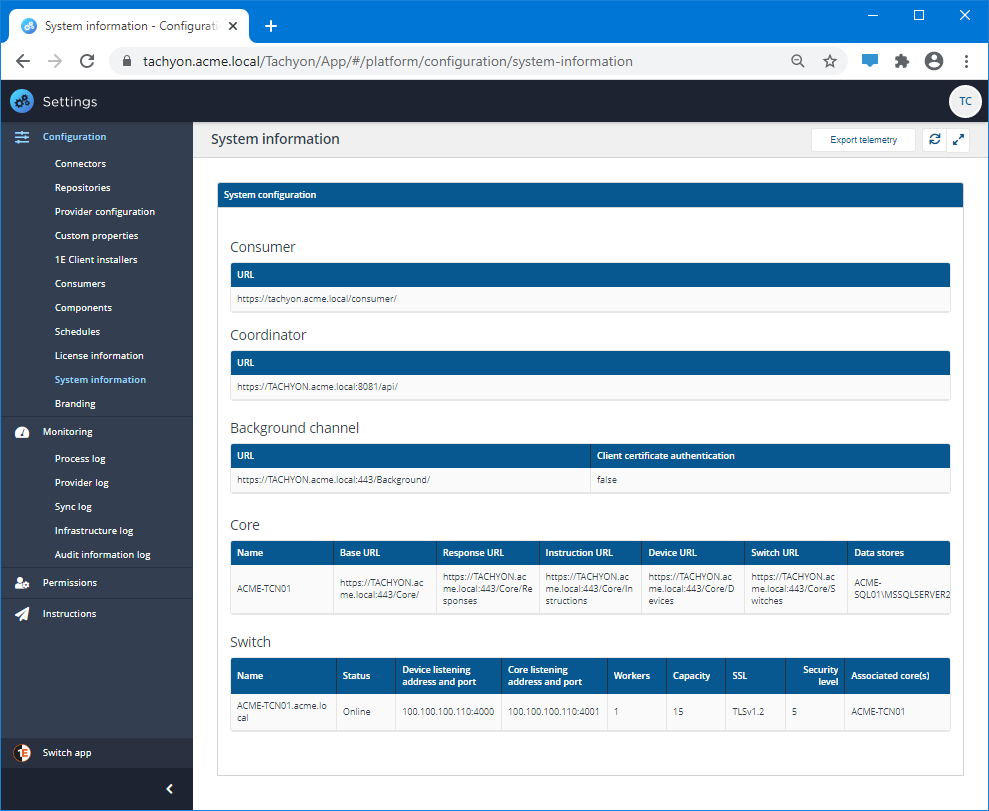
System information page
The System information page lets you review the configuration of Tachyon components used for Tachyon real-time features. There are no configuration options.

System information
The information on this page is described in the following table:
Field | Description | ||||||||||||||||||||||
|---|---|---|---|---|---|---|---|---|---|---|---|---|---|---|---|---|---|---|---|---|---|---|---|
Displays the URL for the consumer API. For example: https://TACHYON.acme.local/Consumer/ | |||||||||||||||||||||||
Displays the URL for the coordinator API. For example: https://TACHYON.acme.local:8080/api/ | |||||||||||||||||||||||
Displays a list of configured background channels, showing the following information:
| |||||||||||||||||||||||
Displays a list of the configured cores, showing the following information:
| |||||||||||||||||||||||
Displays a list of the configured switches, showing the following information:
|
Export telemetry
The Export telemetry button triggers a collection process for Server telemetry data and exports a CSV file. The contents of the file are not encrypted.
If you have disabled automated sending of Server telemetry to 1E, and you contact 1E Support for assistance with any problems, you may be asked use the Export telemetry button, and then send the CSV file to 1E.
Telemetry helps 1E to continually improve your experience with Tachyon. Only summarized statistical information is collected, which enables 1E to see how customers use features of the application. No personally identifiable data is collected. 1E use this information to:
Understand how the product is being used to influence future development decisions
Plan supported platforms (OS, SQL etc. versions) over time
Deliver a smooth upgrade experience as we can focus testing on implemented scenarios
Improve system performance
Identify early warning signs of potential issues such as excessive growth of database tables, instruction failures etc. so we can proactively address them.
Server telemetry reports how the platform is used and data is compressed, encrypted and sent to 1E through email on a configurable schedule. Full details of the Server telemetry data sent to 1E is provided in Server telemetry data.
User Interface telemetry reports how the user interface is used, and data is sent directly from administrator browsers to the 1E Cloud.