Tile Buttons
The Stability, Responsiveness, Performance, and User Experience pages all have a set of tiles that allow navigation or a change of view. Each tile has a set of menu buttons in its upper right. The buttons are hidden until you hover over the tile. Hovering over the button itself, brings up the name of the button.
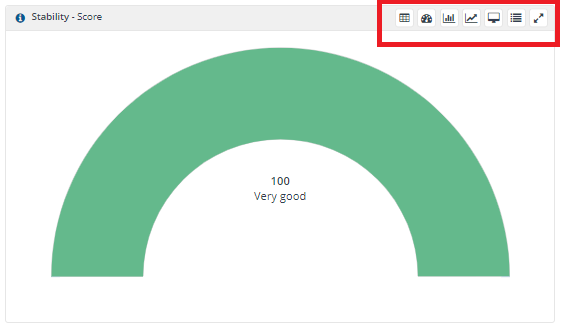
This image shows the buttons exposed. The buttons in order from left to right are:
The first three of the buttons change that tile's focus to another view (if you do not have that one currently selected).
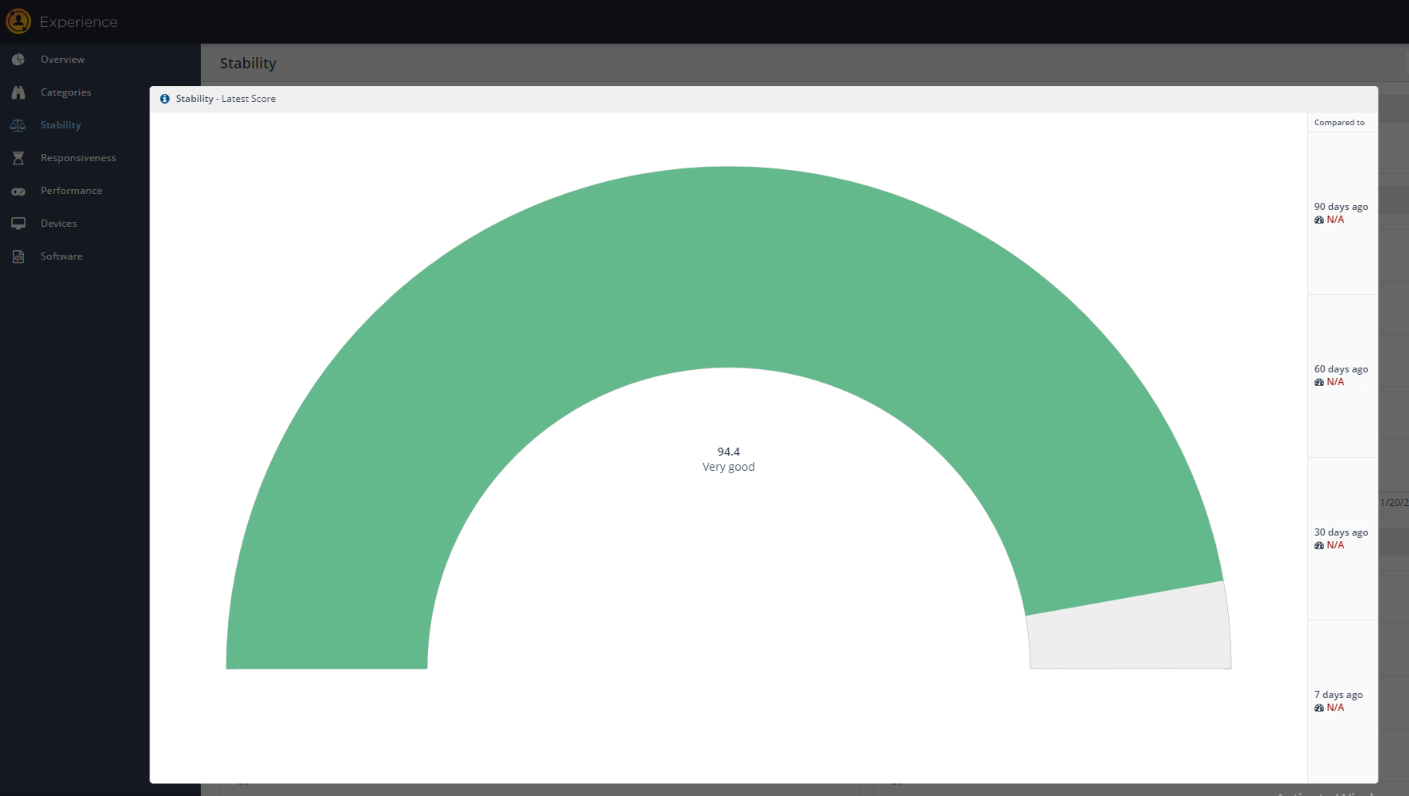
View Latest Score button
View Latest Score button does not do anything if the latest score tile is exposed in the first tile position. If you have changed the tile to View Latest Grading, clicking the first button will change it back to the default View Latest Score.
This image shows an example where the second button on the first tile (View Latest Grading) was selected previously. The first tile now shows the default view of the second tile.
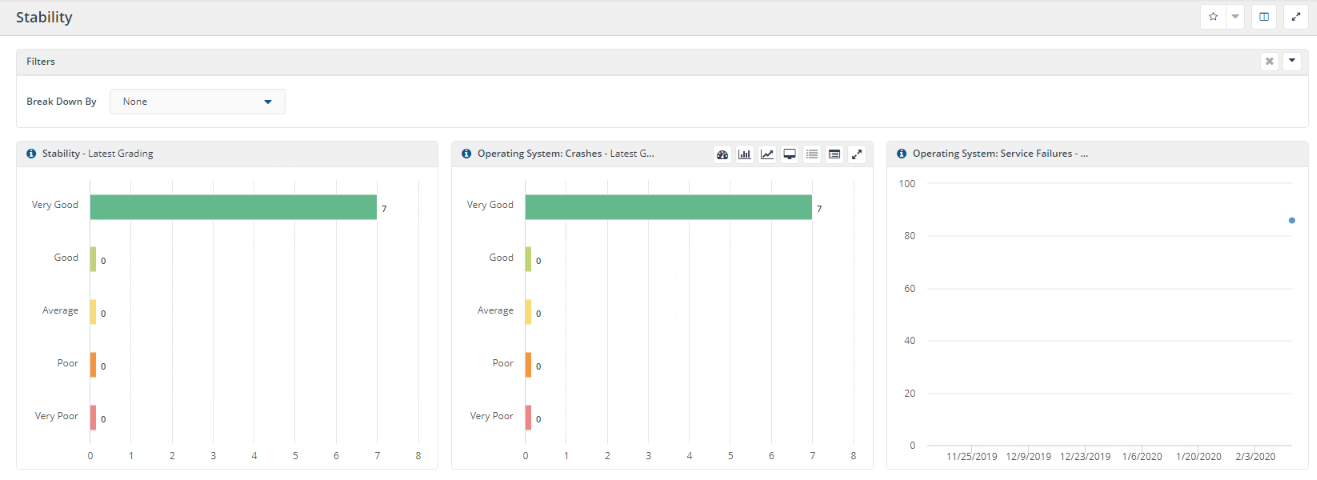
View Latest Grading button
This button will change the view of the current tile to the latest grading tile.
View Trend button
This button will change the view of the current tile to Trend view.
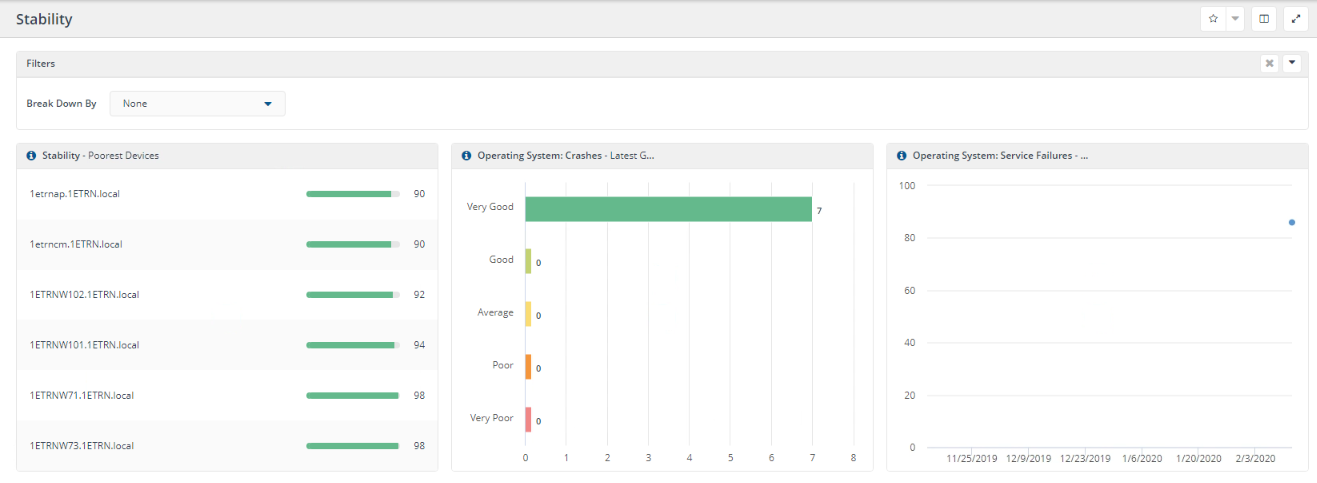
View Poorest Devices button
This button will change the current view of the tile to the top 5 poorest devices for that category.
View What's Changed (last 7 days) button
This button will show what has changed over the last seven days.
View Detailed Data button
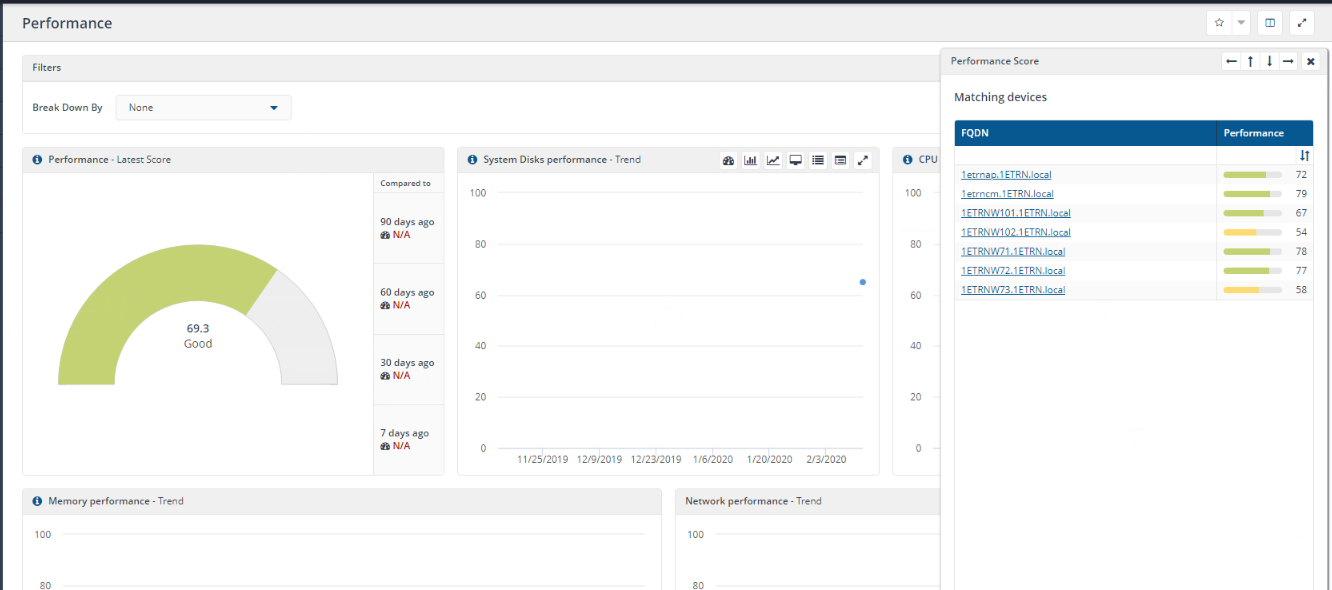
The View Detailed Data button brings up a list of devices with each device's score for that category. This is the View Detailed Data from the Performance page - Performance Score tile. The colored bars show the grading category for that particular score (Very good, Good, Average, Poor or Very Poor).
Details tab
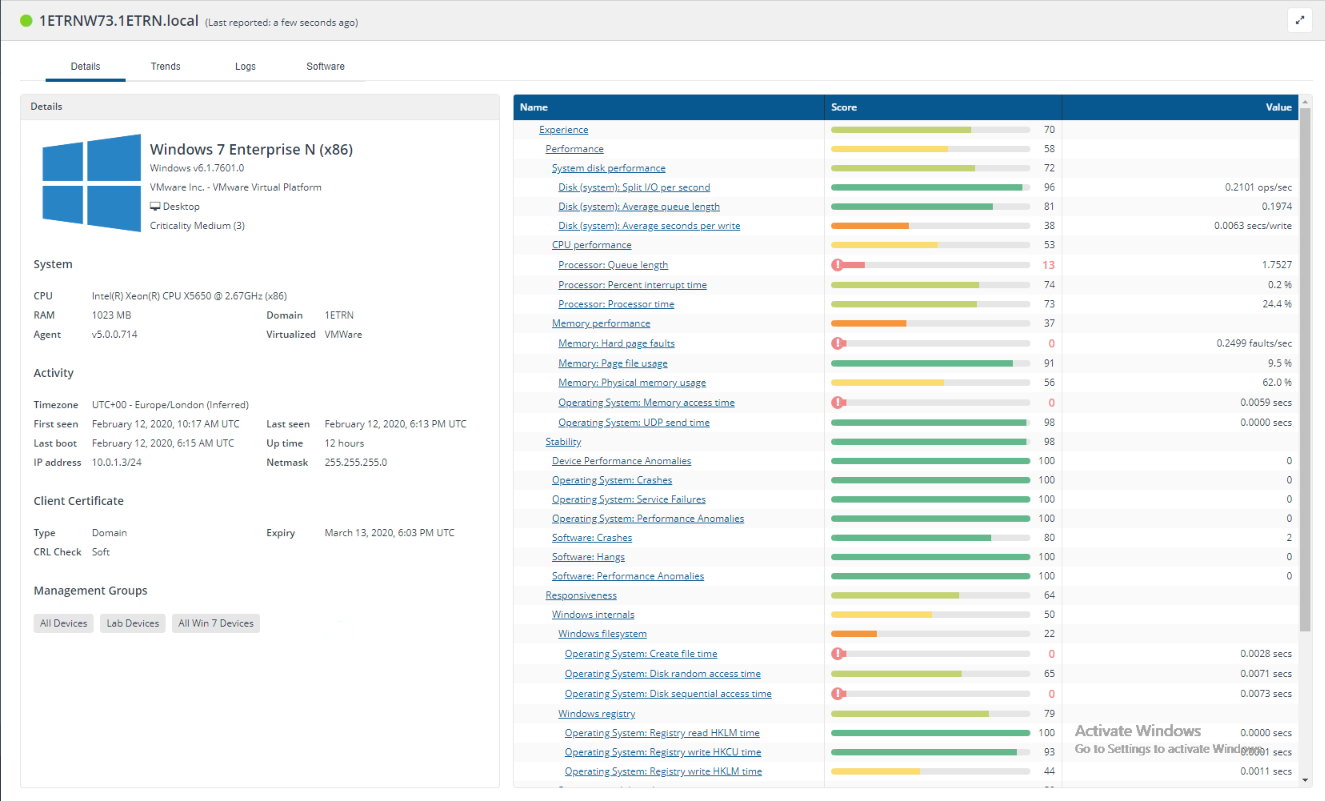
Selecting one of the devices opens the Device's raw data. The Details tab shows all the metrics that make up the score for that device. The first line shows the overall Experience score. The subsequent lines shows the metrics under each category (Performance, Stability and Responsiveness).
Trends tab
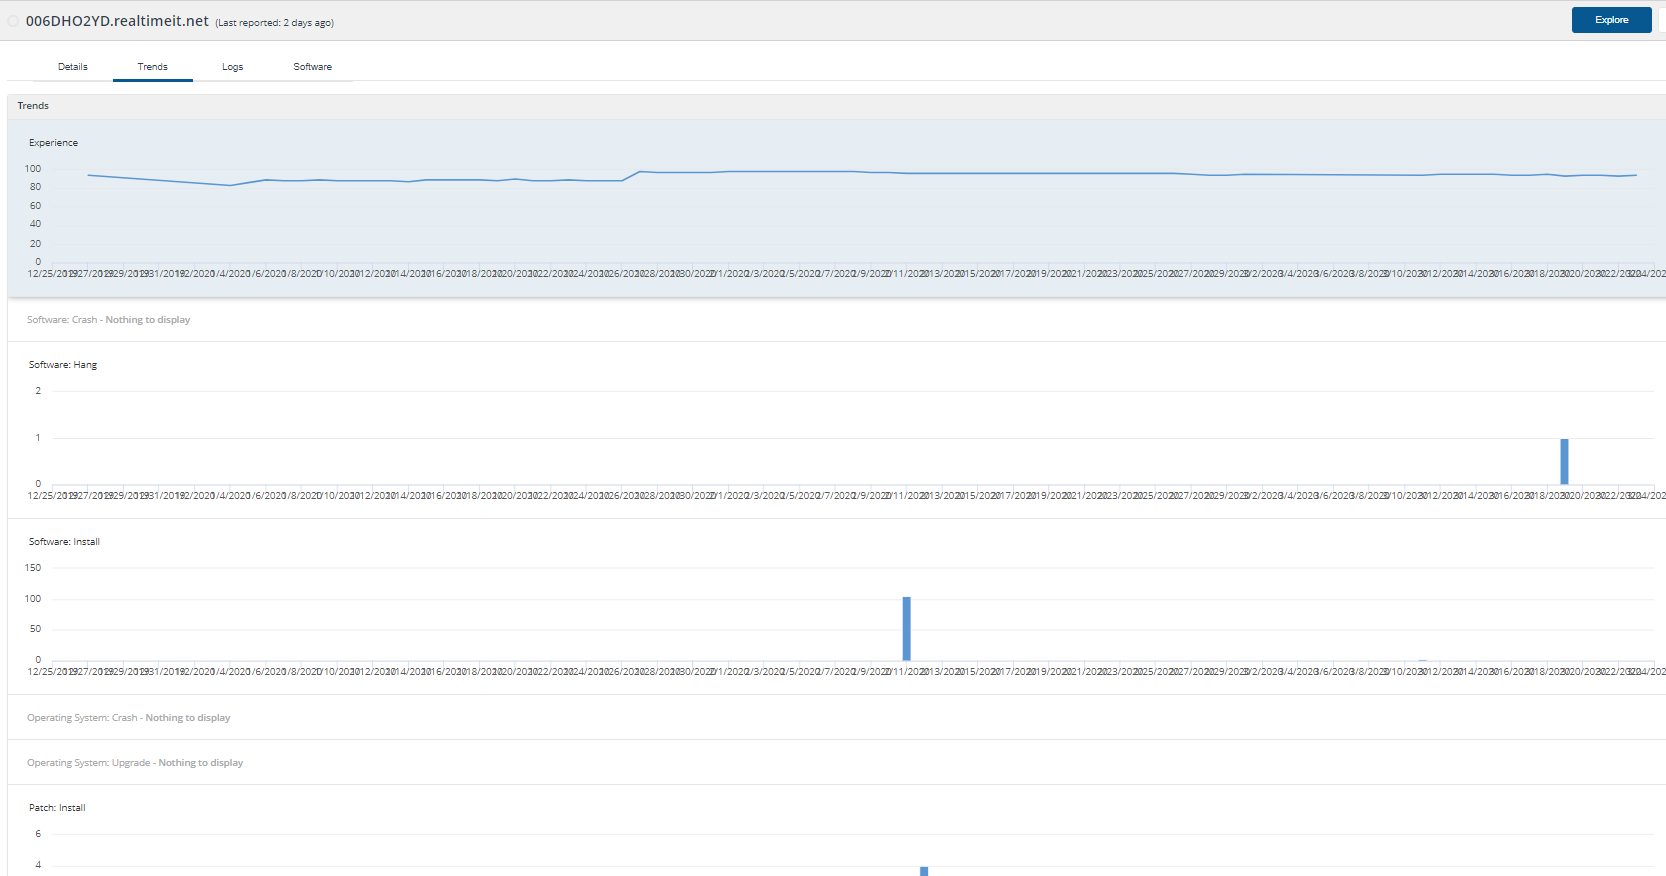
The Trends tab shows the changes in the scores over time. Hovering over any of the bars shows the details for that time and event. If the user viewing the device details also has the ability to at least ask a question in Explorer the Explore button will be visible.
Logs tab
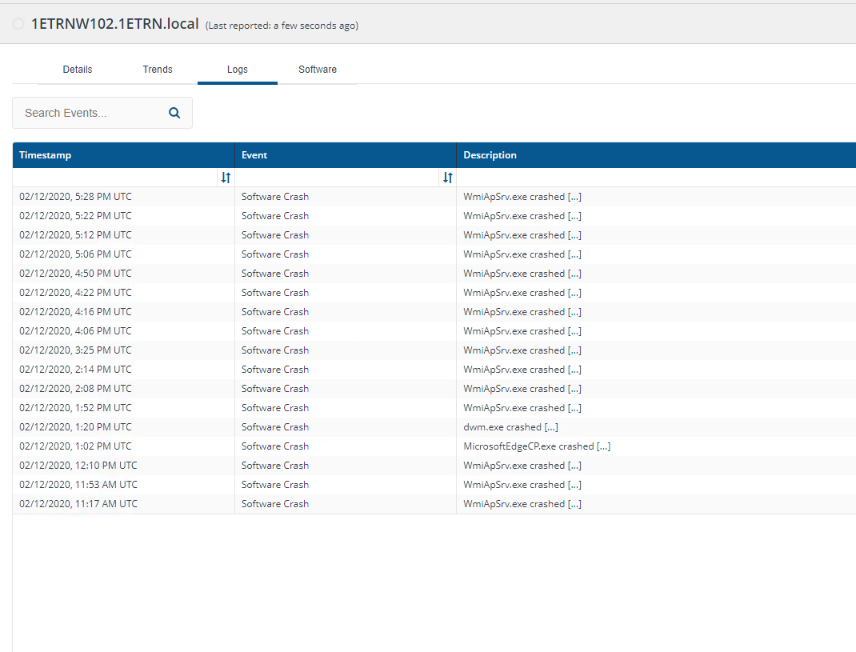
The Event Logs tab gives you a listing of the Windows Event log entries for that device. This brings that data to this view and is very useful when determining the root cause of an issue that has been reported on the device.
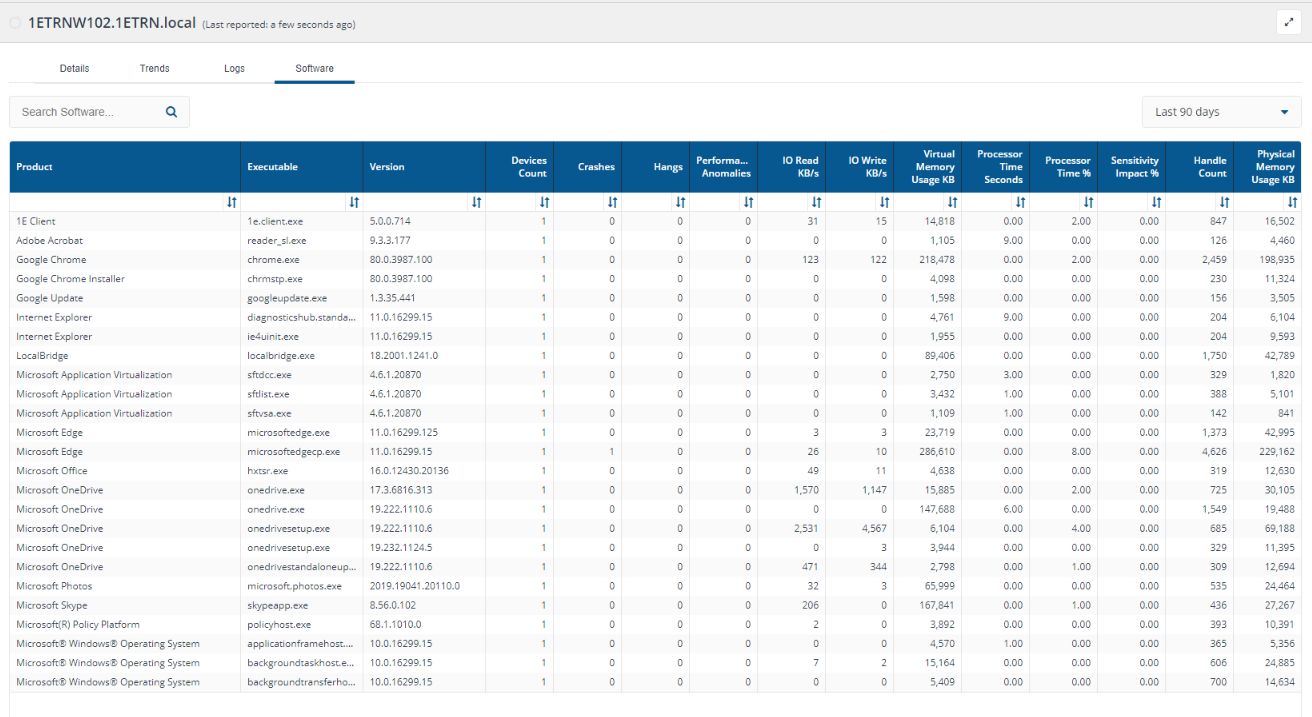
Software tab
The Software tab lists all the software that is installed on the device. This view also shows the metric data for that software. Clicking the ellipsis will show the entire list with the raw scores for each one.
Expand button
Clicking the Expand button in the far right pops the tile out of the dashboard and enlarges it.