Inventory Management menu
The Inventory Management menu contains three pages:
Devices page provides a list of all devices visible to Tachyon Experience
Software page provides a tabular listing of all the Software products that are installed in the environment (including executable, version, architecture).
Users page displays user experience information.
Devices page
The Devices page provides a list of all devices visible to Tachyon Experience. You can see all of their Experience, Stability, Performance, and Responsiveness statistics and sort them accordingly.
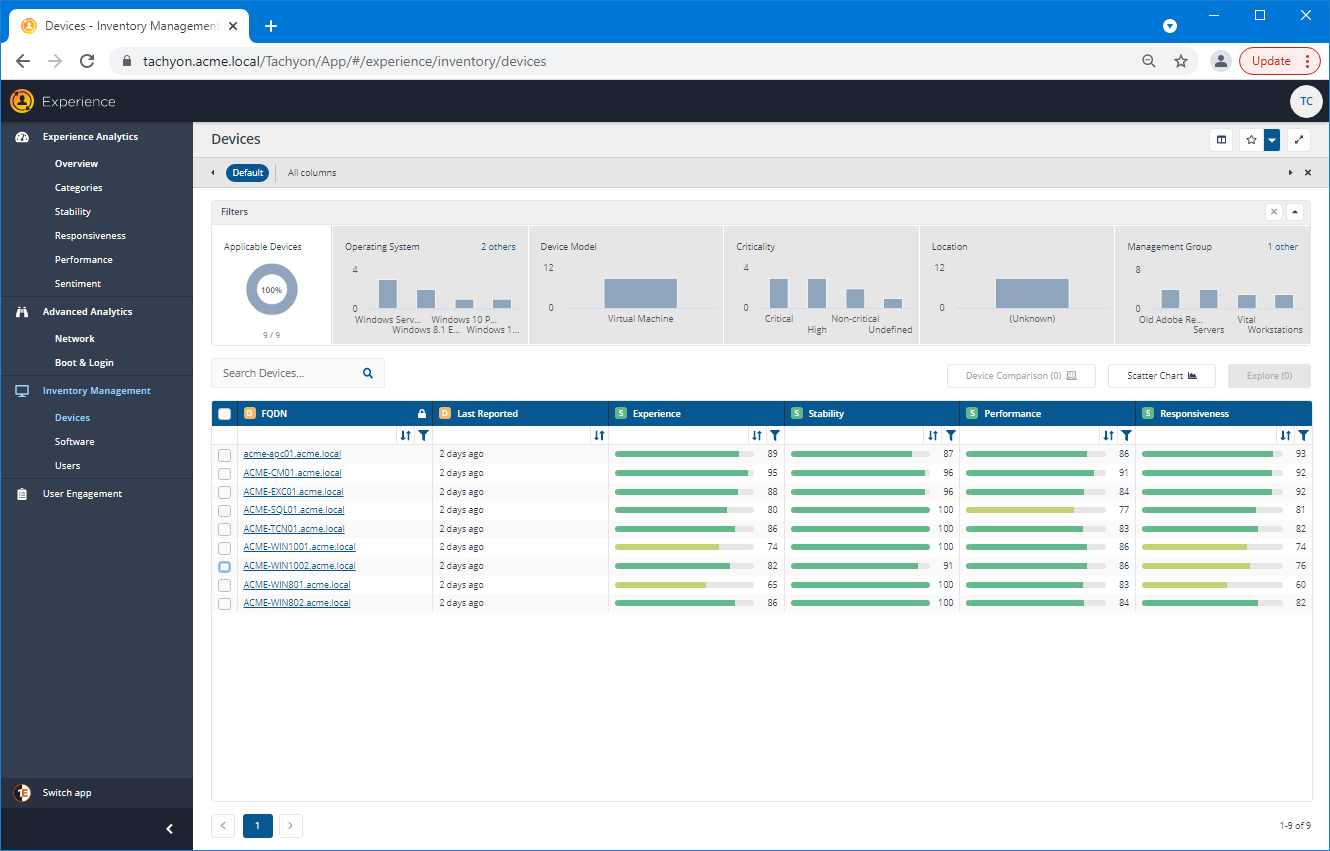
The Devices page
The Devices page allows you to view detailed information for each device in your environment by drilling into a device. From here, you can:
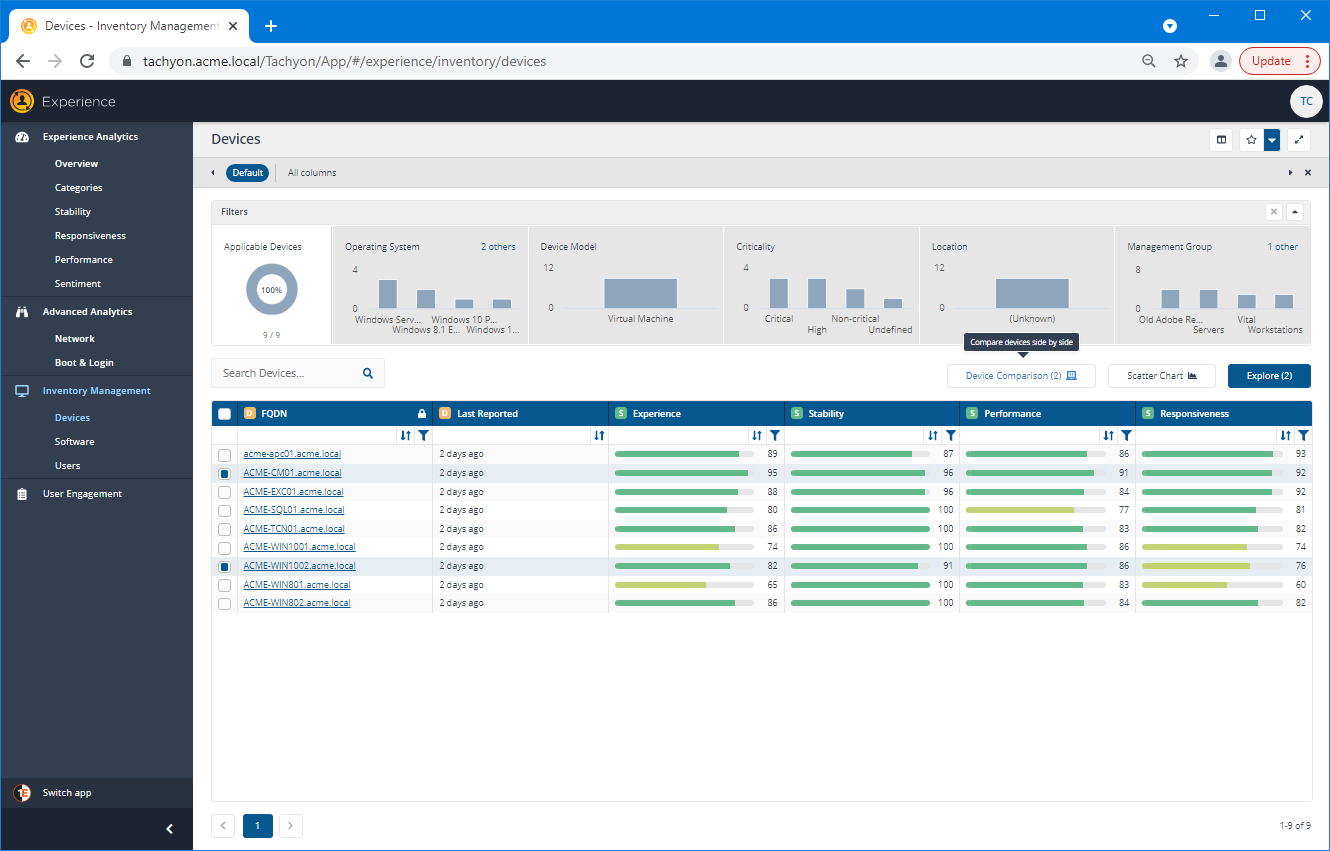
Select two devices and use Device Comparison to compare their settings
Use the Scatter Chart to plot the displayed devices on a two-dimensional graph with configurable axes
Select one or more devices and use Explore to set them as the scope for an explorer instruction
You can display the Device View for a selected device by clicking on its link in the FQDN column.
Device Comparison
Selecting two devices from the Devices table enables the Device Comparison button. Clicking on the button displays the Device Comparison popup.
The data for the comparison is fetched in real-time from both the selected devices.
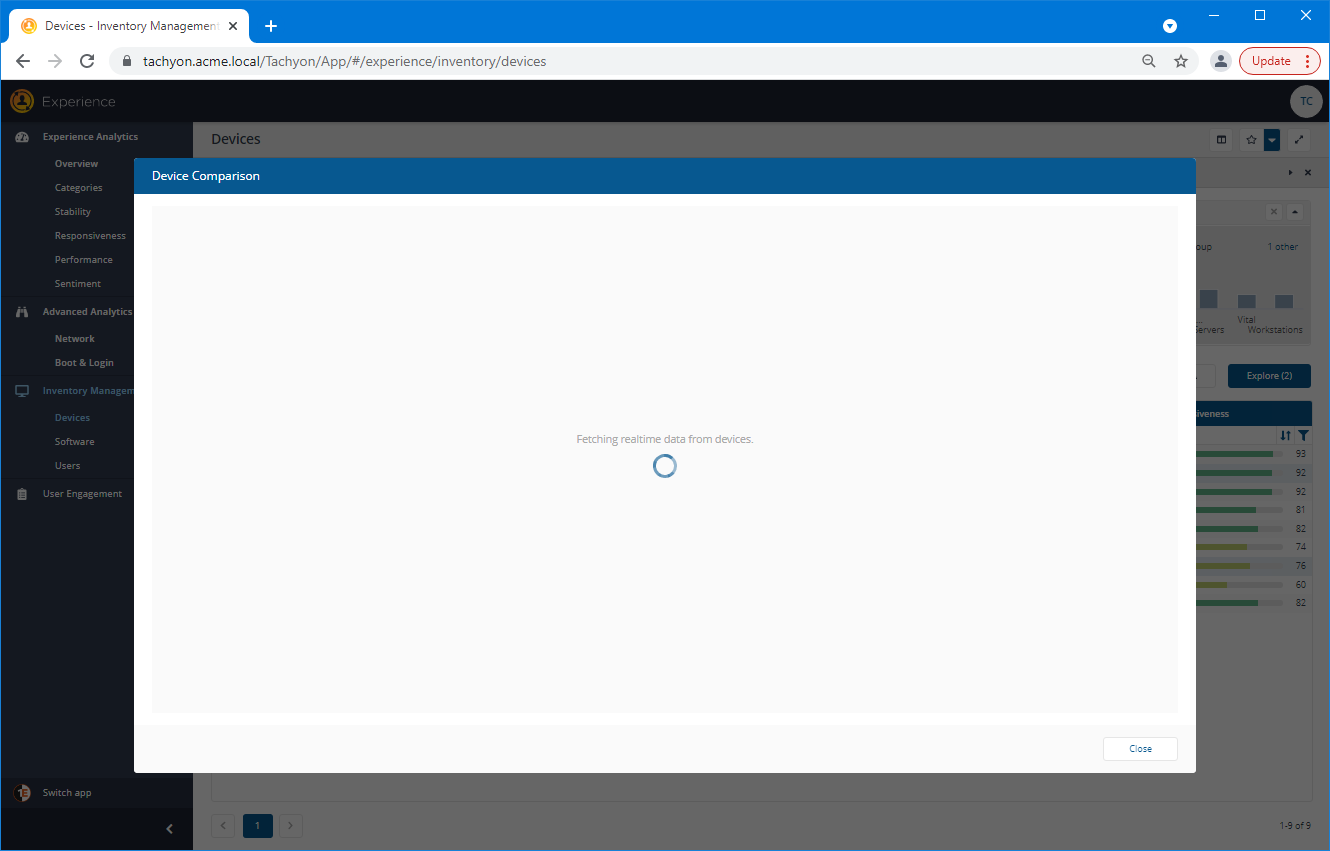
The details for the comparison are displayed in a table, with the parameter headings on the left-hand column and then one column per-device showing the values corresponding to the parameters.
Each column heading for the devices contains a checkbox, that can be used to select the device as the scope for an Explorer session by clicking on the Explore button. The FQDN name for each device is a link that can be used to display the Device View for that device.
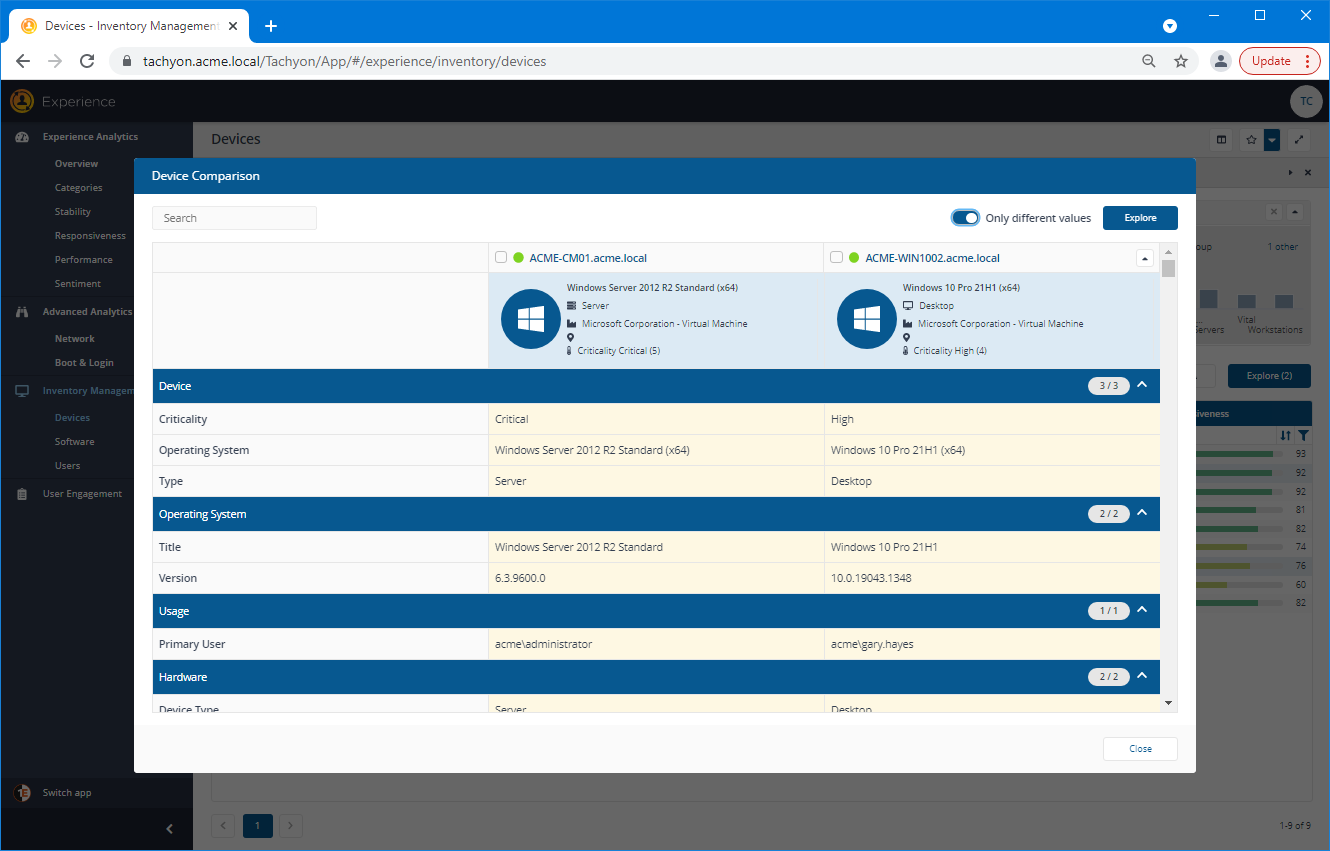
The information in the table is grouped into 7 collapsible category headings: Device, Operating System, Usage, Hardware, Software, Services and Processes.
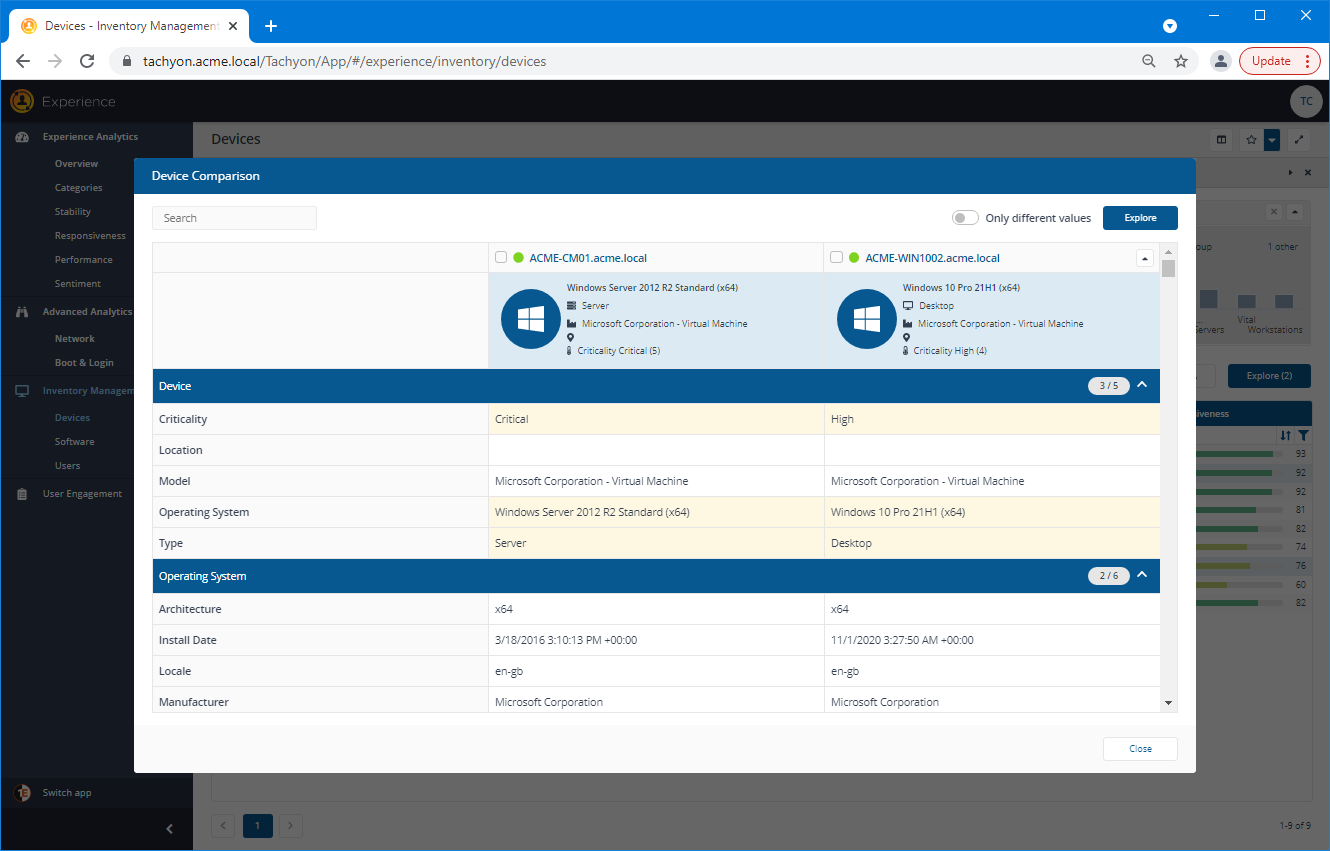
Each row where there is a difference is highlighted in yellow and where the information is the same in white. You can select to focus on only the differences by switching the Only different values toggle to on.
Scatter Chart
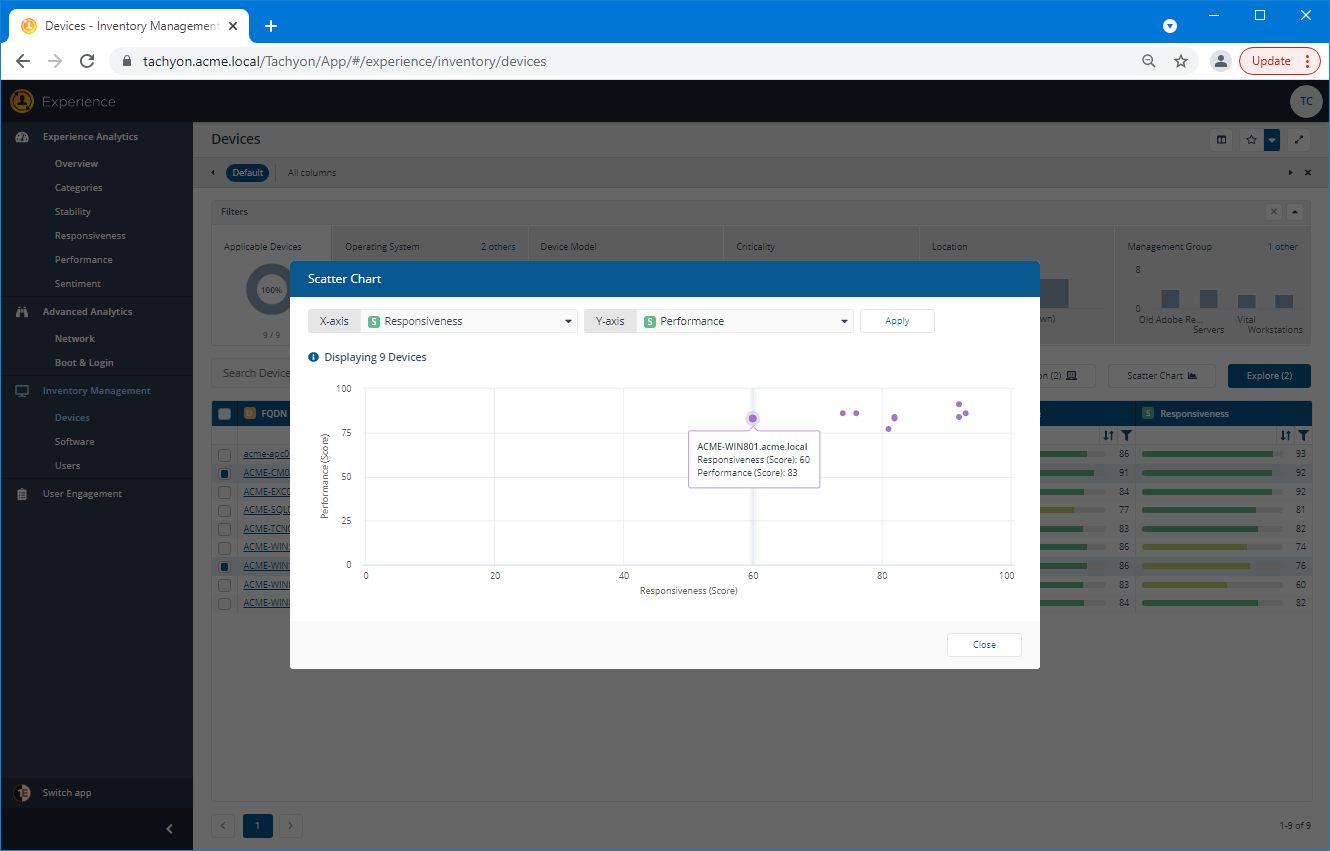
Clicking on the Scatter Chart button in the Devices page displays the Scatter Chart popup. The devices from the current view are plotted as points on a graph according to their Responsiveness scores on the X-axis and Performance scores on the Y-axis.

You can hover over a point on the graph to view its details.
The parameters plotted on the axis can be changed using the axis dropdowns. The parameter you want to plot is selected from a list that can be filtered by typing text into the search field. The picture opposite shows the Memory: Hard page faults parameter selected.
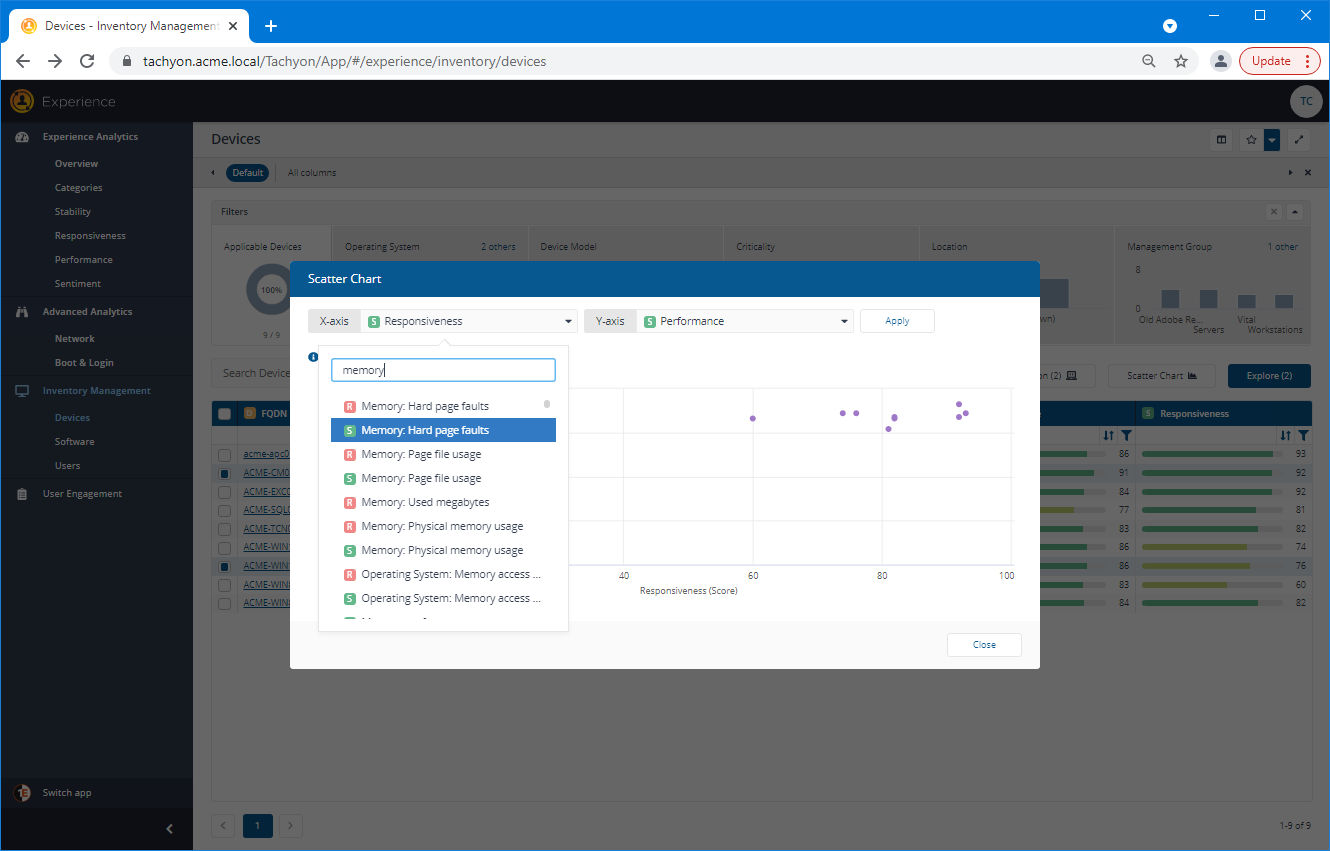
You must click the Apply button to re-plot the graph according to the new selection.
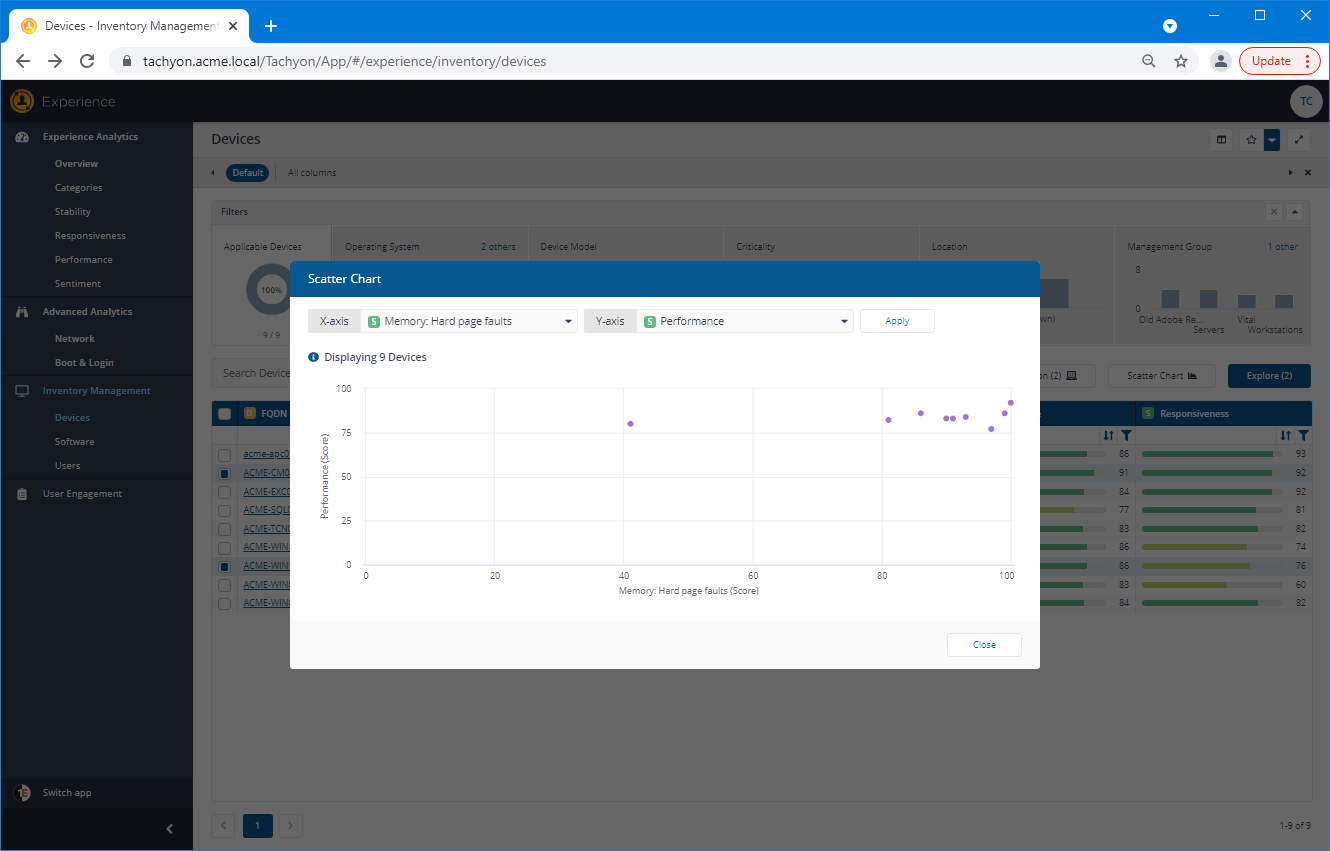
Both axes can be changed. The picture opposite shows the device Memory: Hard page faults plotted against the Memory: Page file usage scores.

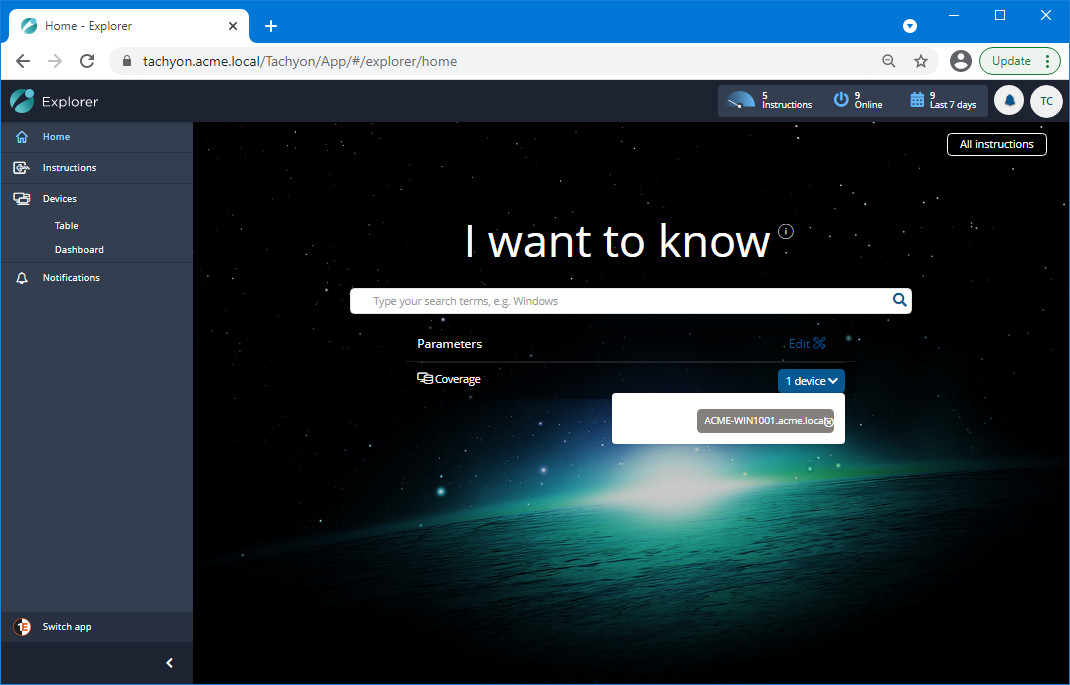
Explore Button
If the account you are viewing Tachyon Experience with has at least the Global Questioner role, you will also see an Explore button. Clicking this button will launch Tachyon Explorer.
The coverage will be set to the device you were viewing in Experience.
The Device View
Clicking on one of the links in the FQDN column of the Devices page displays the Device View for the selected device. The aim of the Device View is to provide a combined overview of all the information known about a device, along with the ability to retrieve information about the device in real-time. There are a number of tabs available in the Device View, but the Experience tab is specific to the Experience application.
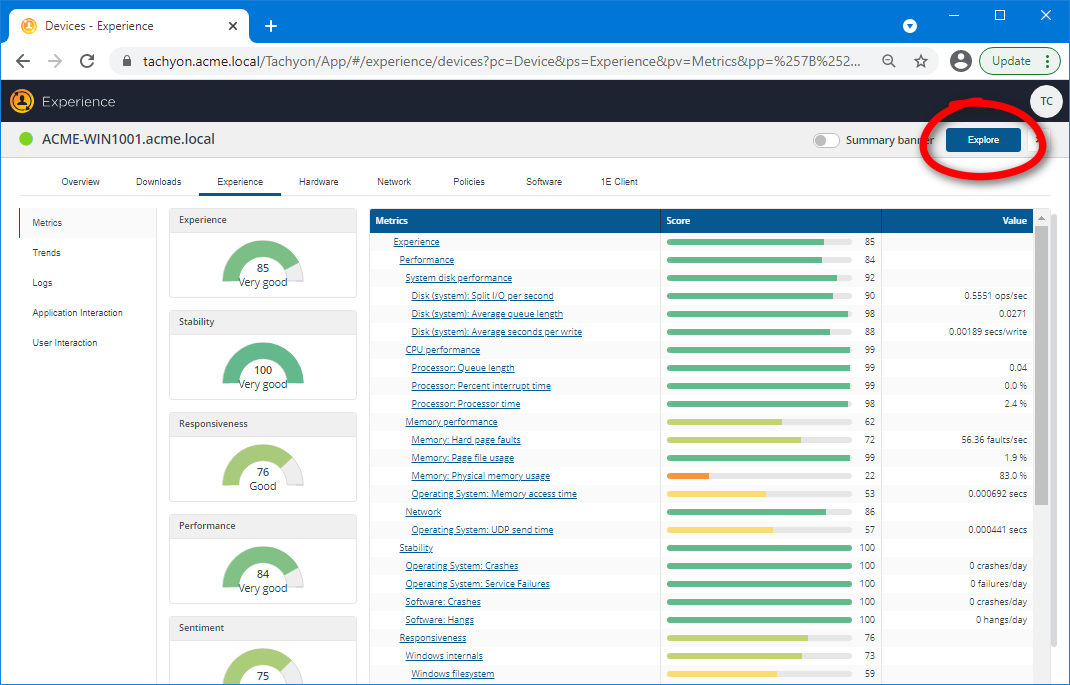
The Device View Experience tab
When displaying the Device view from an Experience page the view defaults to the Experience tab. The Experience tab contains information derived from and useful for Tachyon Experience. It contains the following panels:
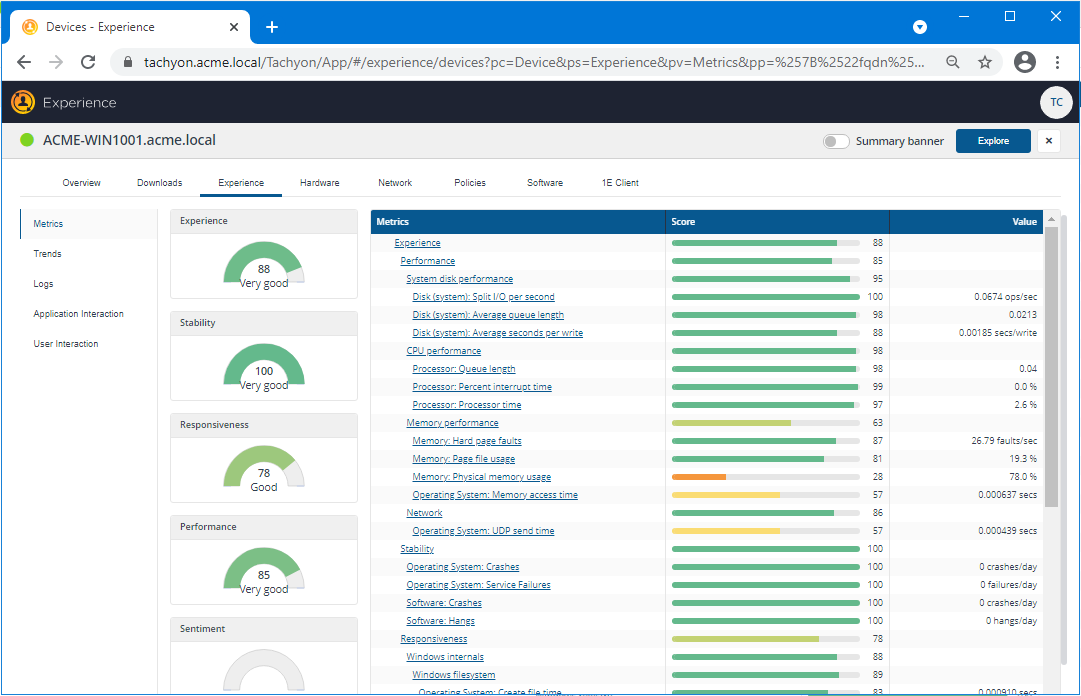
Metrics panel
This panel shows the current gradings for all the Metrics that are measured by Tachyon Experience.
Note
Only the current gradings can be seen here, there is no ability to look at the history information in this panel.
Metrics with a Very Poor grading are marked by lines in red with an exclamation mark.
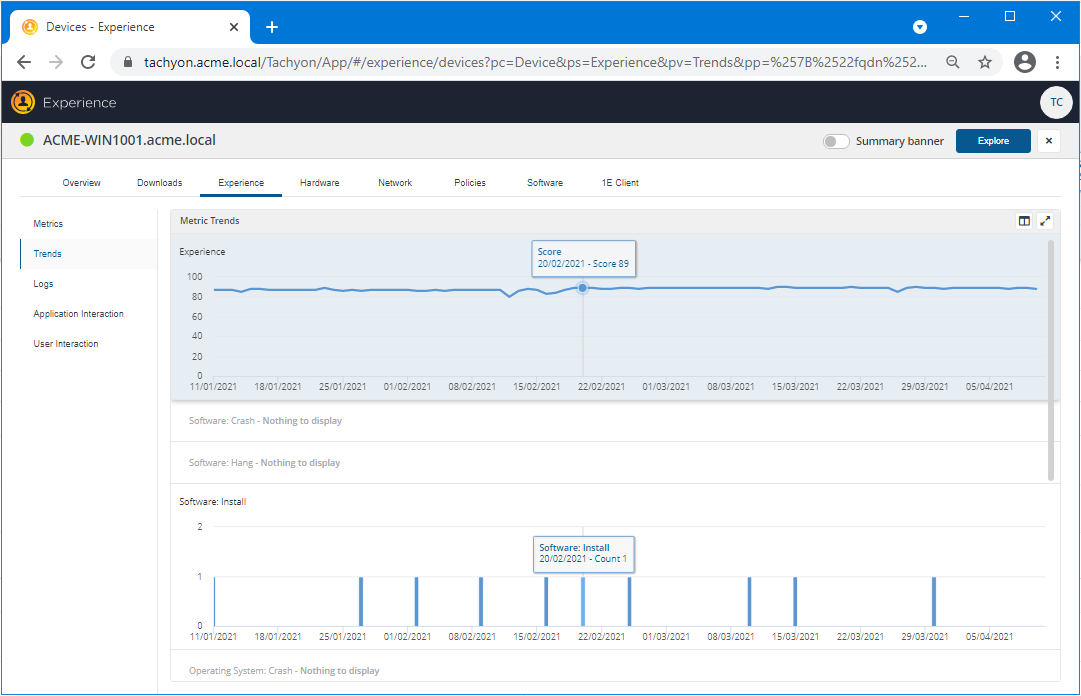
Trends panel
The Trends panel shows the Metric measurements over time, making it easy to determine trends and see what else was happening on the device as an issue progressed.
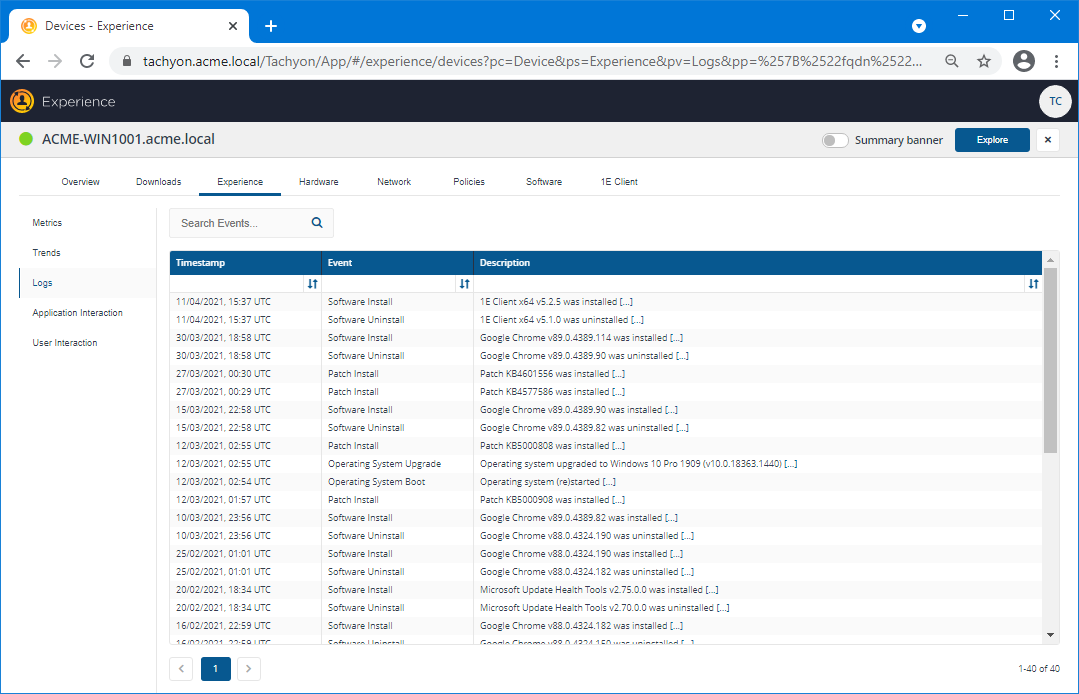
Logs panel
The Logs panel shows the Windows Event Log entries for significant events. These events are captured as they happen, the device does not wait for the daily digest to send the information to the switch.
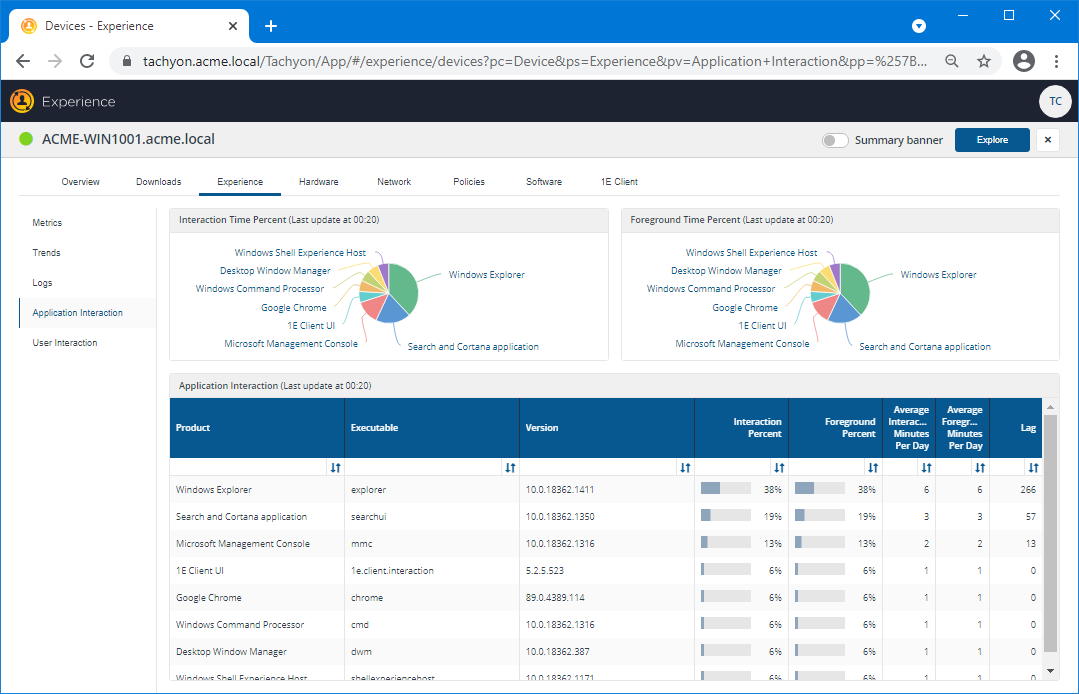
Application Interaction panel
This panel provides a couple of charts and lists the applications that have most recently been interacted with on the device.
The Interaction Time Percent chart shows the amount of time each application on the device was interacted with as a percentage of the time for all the applications.
The Foreground Time Percent chart shows the amount of time each application spent in the foreground as a percentage of the time for all the applications.
The table lists the applications most recently interacted with on the device. The table can be sorted on each column.
Column | Description |
|---|---|
Product | The common name for the product. |
Executable | The executable name associated with the product. |
Version | The version number for the product entry. |
Interaction Percent | The percentage of time the product was interacted with out of the total time all the applications were interacted with. |
Foreground Percent | The percentage of time the product spent in the foreground out of the total time all the applications spent in the foreground. |
Average Interaction Minutes Per Day | The daily average number of minutes the product was interacted with. |
Average Foreground Minutes Per Day | The daily average number of minutes the product spent in the foreground. |
Lag | The maximum lag time between interacting with the application and getting a response. |
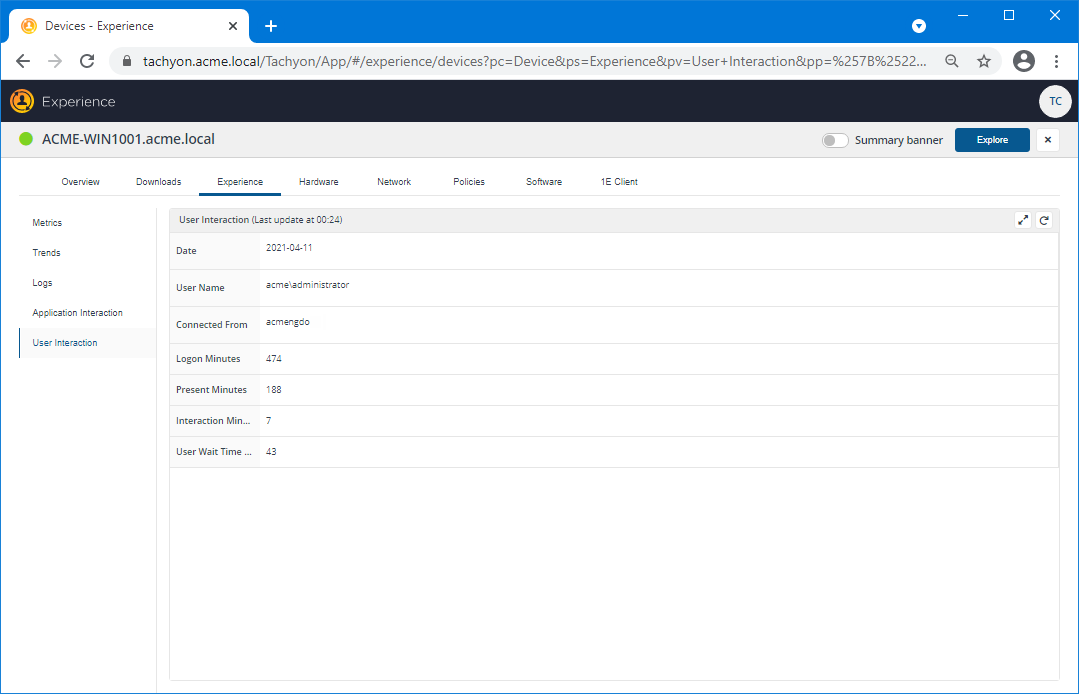
User Interaction panel
This panel provides information about the last known user for the device.
Row | Description |
|---|---|
Date | The date the interaction took place. |
User Name | The domain user name who performed the interaction. |
Connected From | The device the user connected to the device from. |
Logon Minutes | The number of minutes the specified user has been logged on for. |
Present Minutes | The number of minutes the specified user was counted as present on the device while they were logged on. |
Interaction Minutes | The number of minutes the specified user interacted with the device. |
User Wait Time | The amount of wait time in seconds the user spent waiting for a response from an application. |
Additional Device View tabs
In addition to the Experience tab, there are a number of other tabs, each corresponding to an app, feature or data set implemented in Introducing Tachyon:
The Overview and 1E Client tabs are always present in the Device View. Other tabs are visible if an app has been installed and is licensed.
Each tab has one or more panels with tiles populated with data from various sources, some by instructions that are run instantly, with results cached for 3 minutes. An appropriate error message is displayed instead of a tile in the following circumstances:
If the device is offline, as indicated by the color of the icon in the top left
The user does not have at least Viewer permission to view use the license the tab or panel
The user does not have questioner permission to run the instruction
An instruction has not been uploaded.
The Device View tabs and panels page lists the names of tabs and their panels, and a description of each tile indicating how the tile is populated.
Tab | Panel | Description | Data source | |||||||||||||||||||||||||||||||
|---|---|---|---|---|---|---|---|---|---|---|---|---|---|---|---|---|---|---|---|---|---|---|---|---|---|---|---|---|---|---|---|---|---|---|
Displays a number of tiles sorted into Identification, Hardware and Operating System and Connectivity and Activity columns that show information for the selected device retrieved from the online status information stored in the Tachyon Master database. The columns and tiles are shown in the following table:
| Data from Tachyon Master (the latest online status message) | |||||||||||||||||||||||||||||||||
Shows a list of the environment variables set on the device. | ||||||||||||||||||||||||||||||||||
Two panels:
| 1E-TachyonPlatform-Hardware-ResourceUsage 1E-TachyonPlatform-Hardware-ResourceUsageByMinute | |||||||||||||||||||||||||||||||||
Download activity and status for the device. Whenever you click on an FQDN on any of the Nomad pages then the Device View will be displayed with the Downloads tab selected. | Data from Content Distribution. | |||||||||||||||||||||||||||||||||
Content Titles on the selected device, the default view is from All Sources, All Types and All Status. NoteYou may see a difference in the number of items in a device’s Nomad cache versus that displayed in the Nomad app Device View. This is because if downloaded content has been deleted from Configuration Manager, the content titles cannot be resolved in the Nomad app and are not displayed. This is under consideration for re-design and may be revised in future versions of Nomad. | Data from Content Distribution. | |||||||||||||||||||||||||||||||||
1E Nomad Branch Settings . | 1E-Nomad-NomadBranchSettings | |||||||||||||||||||||||||||||||||
Metrics are the data points that are collected by the 1E Client and sent to the Tachyon server. They are collected at different intervals depending on the type of data that is being collected. | Data from Experience metrics | |||||||||||||||||||||||||||||||||
The Trends tab shows the changes in the scores over time. Hovering over any of the bars shows the details for that time and event. If the user viewing the device details also has the ability to at least ask a question in Explorer the Explore button will be visible. | Data from Experience metrics | |||||||||||||||||||||||||||||||||
The Event Logs tab gives you a listing of the Windows Event log entries for that device. This brings that data to this view and is very useful when determining the root cause of an issue that has been reported on the device. | Data from Experience metrics | |||||||||||||||||||||||||||||||||
Shows user interaction times and ratios across applications measured over the last 30 days | 1E-Experience-ApplicationInteraction | |||||||||||||||||||||||||||||||||
Shows user interactive sessions with activity over last 30 days. | 1E-Experience-UserInteractionHistory | |||||||||||||||||||||||||||||||||
Shows disk drives, including hardware and usage information.
| 1E-TachyonPlatform-Hardware-DiskDrives | |||||||||||||||||||||||||||||||||
Shows the list of plug and play hardware devices (Windows only).
| 1E-TachyonPlatform-Hardware-Devices | |||||||||||||||||||||||||||||||||
Shows network throughput on all adapters for the last hour, represented by the following tiles:
| 1E-TachyonPlatform-Network-AverageThroughput | |||||||||||||||||||||||||||||||||
Returns the output from the native network interface configuration command (e.g. ipconfig or ifconfig). | 1E-TachyonPlatform-Network-InterfaceConfiguration | |||||||||||||||||||||||||||||||||
Shows the Cache and Host file tiles:
| 1E-TachyonPlatform-Network-DnsCache 1E-TachyonPlatform-Network-HostFileContent | |||||||||||||||||||||||||||||||||
Returns a list of established TCP connections.
| 1E-TachyonPlatform-Network-TcpConnections | |||||||||||||||||||||||||||||||||
Returns a list of processes which are listening for network connections.
| 1E-TachyonPlatform-Network-ListeningPorts | |||||||||||||||||||||||||||||||||
Returns a list of processes which are listening for network connections and also shows routing tables. | 1E-TachyonPlatform-Network-ArpCache 1E-TachyonPlatform-Network-RoutingTable | |||||||||||||||||||||||||||||||||
Shows a list of visible wifi networks, including basic network properties.
| 1E-TachyonPlatform-Network-WiFiNetworks | |||||||||||||||||||||||||||||||||
| Data from Guaranteed State | |||||||||||||||||||||||||||||||||
Shows (per-device) installed software.
| 1E-TachyonPlatform-Software-Installations | |||||||||||||||||||||||||||||||||
Shows list of installed Windows services and their current state.
| 1E-TachyonPlatform-Software-Services | |||||||||||||||||||||||||||||||||
Shows operating system environment variables. | 1E-TachyonPlatform-Software-EnvironmentVariables | |||||||||||||||||||||||||||||||||
Shows detailed information about all running processes.
| 1E-TachyonPlatform-Software-Processes | |||||||||||||||||||||||||||||||||
Shows a list of the binary files in the executable folder of the 1E Client.
| 1E-TachyonPlatform-Client-Binaries | |||||||||||||||||||||||||||||||||
Shows the full content of the 1E Client configuration file, including:
| 1E-TachyonPlatform-Client-ConfigFileContent | |||||||||||||||||||||||||||||||||
Shows extensibility objects (modules and providers) loaded by the 1E Client.
| 1E-TachyonPlatform-Client-Extensibility | |||||||||||||||||||||||||||||||||
Shows Data Files and Client Inventory Database Use tiles that display the list of:
| 1E-TachyonPlatform-Client-DataFiles 1E-TachyonPlatform-Client-InventoryDatabaseUse |
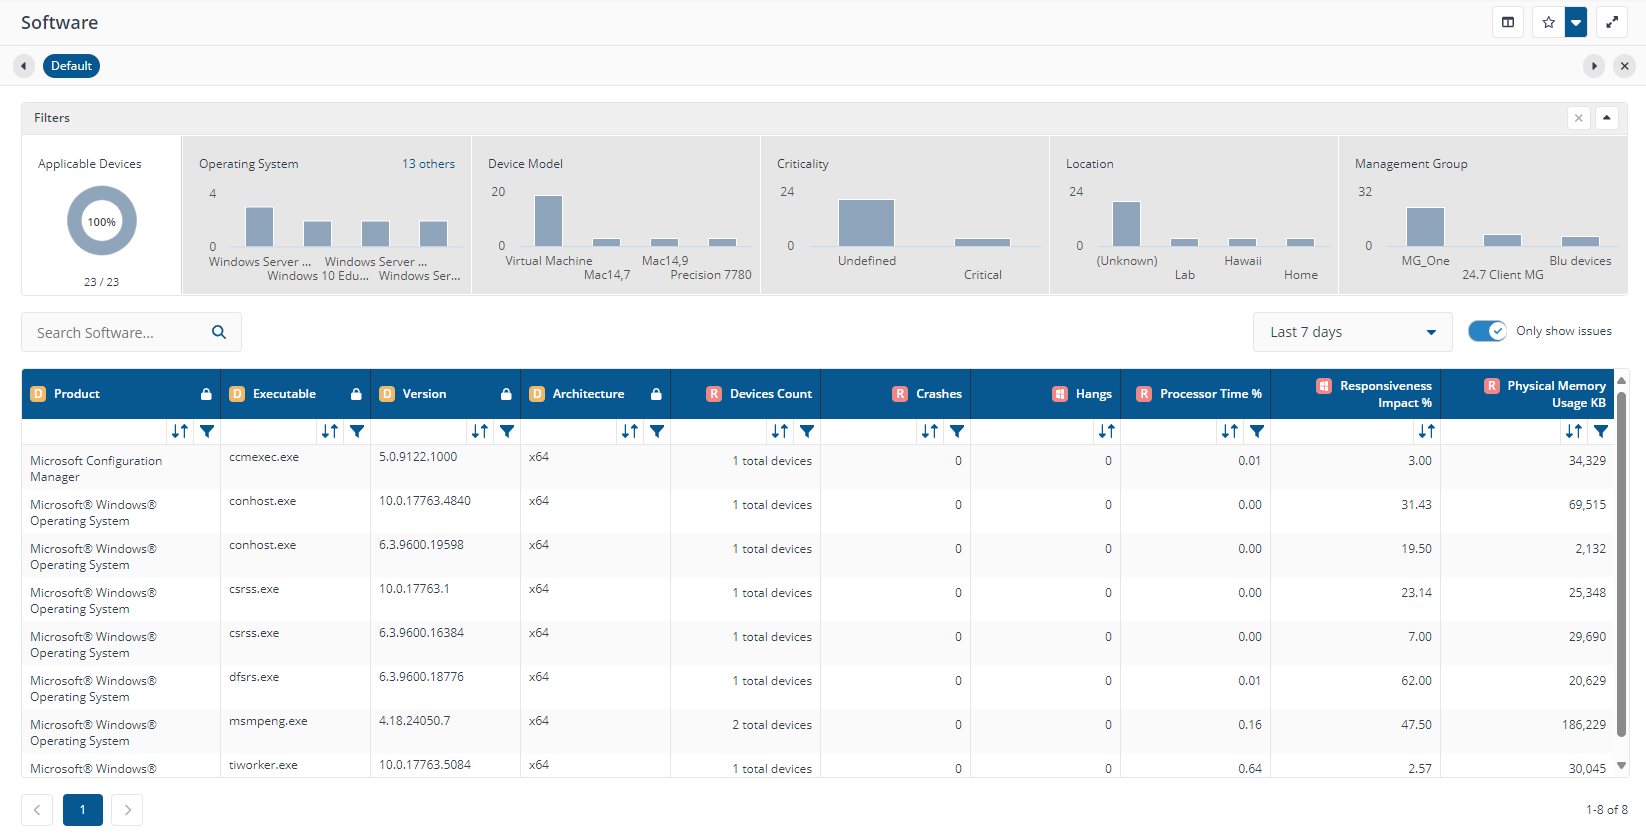
Software page
The Software page provides a tabular listing of all the Software products that are installed in the environment (including executable, version, architecture). The second set of columns in the list provide additional metrics or event details associated with the Software products.
Filtering and navigation
The drop-down selection at the top right of the page allows you to select to display data for the last 90, 60, 30 or 7 days.
The Filters at the top of the page, also lets you focus the data, allowing you to center your insights on specific areas of the environment. For example, specific Operating Systems and/or Locations.
The table can be sorted by each column (ascending or descending), as well as filtered based on the available columns values.
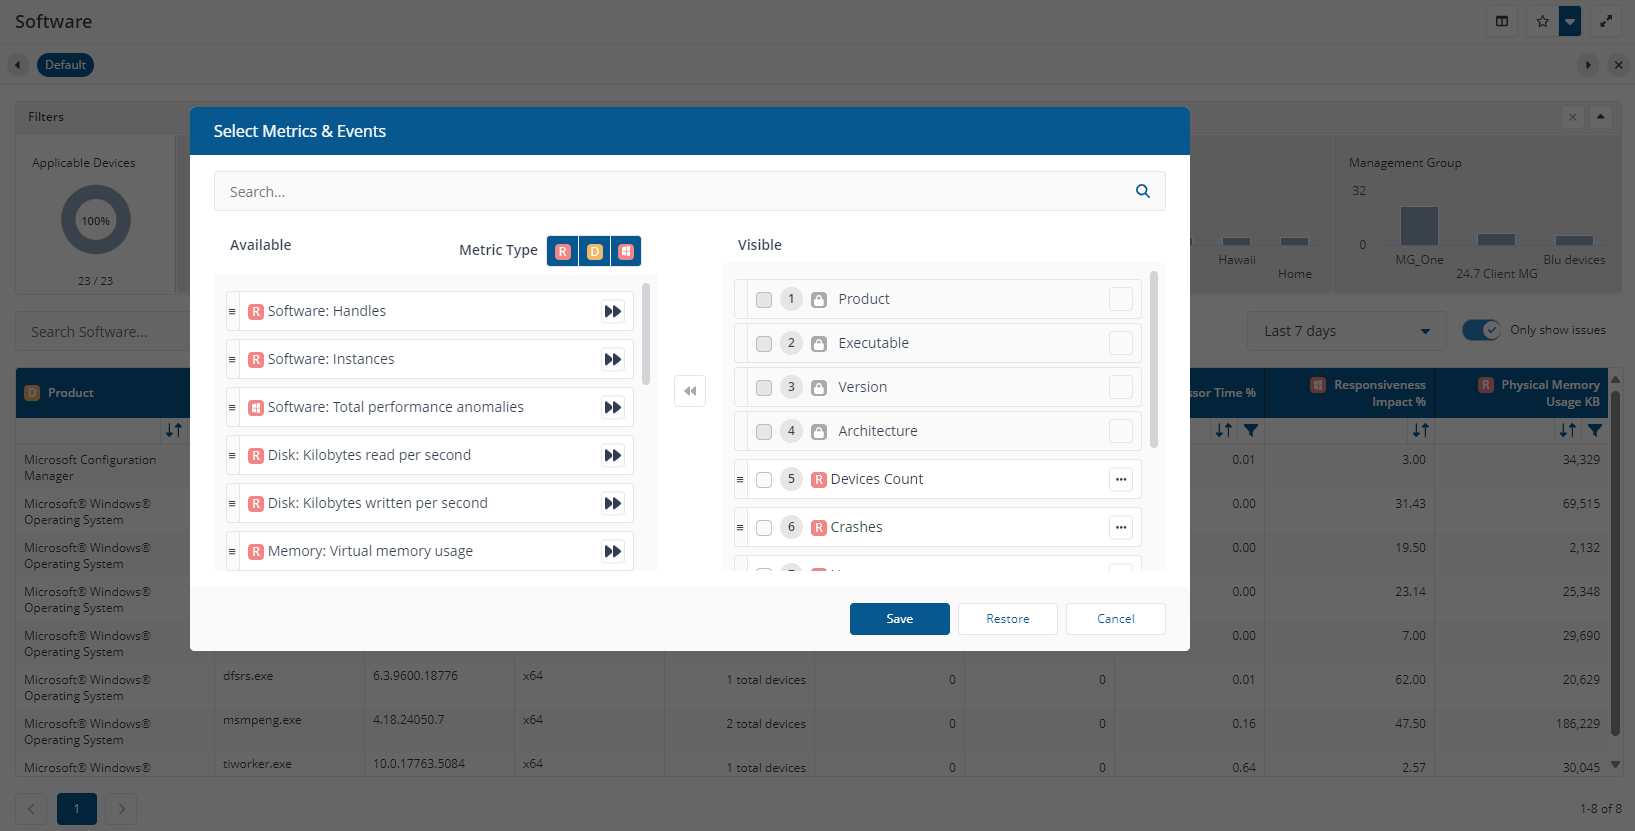
You also have the ability to add or remove columns from the tabular listing, which is present at the bottom of the page, based on the level of detail that your investigation requires. You can also set the new structure of the page as a persistent preset.
Clicking on a row filters the table to only display entries that match the Product, Executable, Version and Architecture values for that row. The table displayed subsequently omits the Product, Executable, Version and Architecture columns, as these will all be the same, so you can focus your attention on the rest of the data.
Software page metrics
The other metrics or events that can be added and removed from the list are:
Metric | Description |
|---|---|
Devices Count | Number of devices on which the Software product and its associated process is installed. |
Crashes | Number of crashes that have occurred for the Software product's process during the reporting period. |
Hangs | Number of hangs that have occurred for the Software product's process during the reporting period. |
Processor Time % | Average processor time for the Software product's process during the reporting period. |
Sensitivity/Responsiveness Impact % | How sensitive this software product's process appears to be in relation to operating system activity used to indicate how reactive a process is to activity by other processes on the device. |
Physical Memory Usage KB | Average memory usage in KB for the Software product's process during the reporting period. |
Virtual Memory Usage KB | Average Virtual Memory Usage KB for Software product's process during the reporting period. |
Handles | Average number of Windows handles used by this Software product's process during the reporting period. |
Processor Time Seconds | Average total process time consumed by the Software product's process instance per second during the reporting period. |
Kilobytes read per second | Average KB read from disk per second by the Software product's process during the reporting period. |
Kilobytes write per second | Average KB written to disk per second by the Software product's process during the reporting period. |
Disk Read IOPS | Average disk I/O read rate per second of the Software product's process during the reporting period. |
Disk Write IOPS | Average disk I/O wire rate per second of the Software product's process during the reporting period. |
Bytes Received per Second | Average network bytes received per second for the Software product's process during the reporting period. |
Bytes Sent per Second | Average network bytes sent per second for the Software product's process during the reporting period. |
Bytes Exchange per Second | Average sum of network bytes received and sent per second for the Software product's process during the reporting period. |
Total Megabytes Sent | Total network megabytes sent for the Software product's process during the reporting period. |
Total Megabytes Received | Total network megabytes received for the Software product's process during the reporting period. |
Users page
The Users page displays user experience information, with measurements of how well their devices are providing them with a good experience combined with their user survey responses.
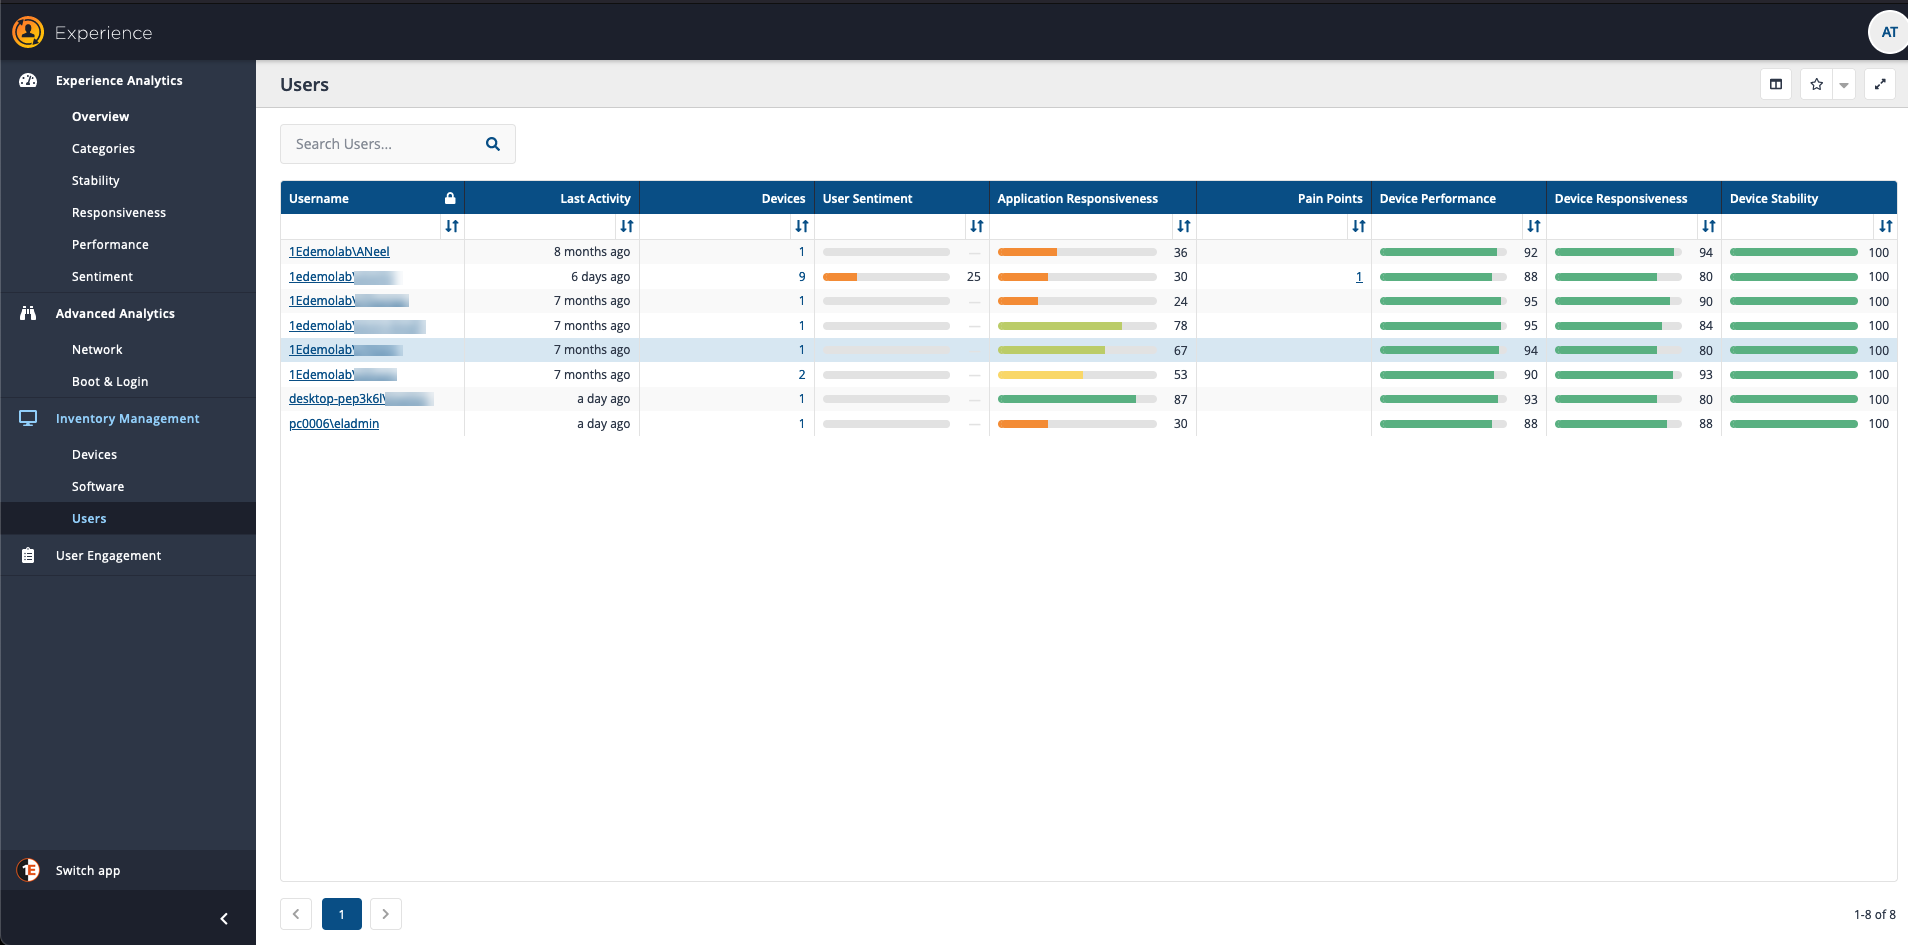
The Users page
Here you can find all of the user-related information in Experience. The main part of the page is the Users table, which displays the following information:
Column | Description |
|---|---|
Username | The name of the user. This is a link to a page that provides data specific to that user, as gathered by Experience. |
Last Activity | The last time data was gathered for the user. |
Devices | The number of devices the user is associated with. |
User Sentiment | The user's latest User Sentiment score. |
Application Responsiveness | The latest score for how reactive the user's sessions have been. |
Pain Points | The number of entries where the latest User Sentiment score is marked as Poor (orange) or Very Poor (red with an exclamation mark). The number is a link, which displays the particular user's Sentiment Survey responses, filtered to show the latest and just Poor or Very Poor ratings. |
Device Performance | The average device performance for the user and their devices. |
Device Responsiveness | The lowest score for device responsiveness for the user across all their devices. |
Device Stability | The score for device stability for the user across all their devices. |
Additional Metrics | Any Metric that has been created by an Experience Survey Administrator as part of defining a new User Sentiment Survey. These aren't shown by default but can be added from the Select Metrics popup. |
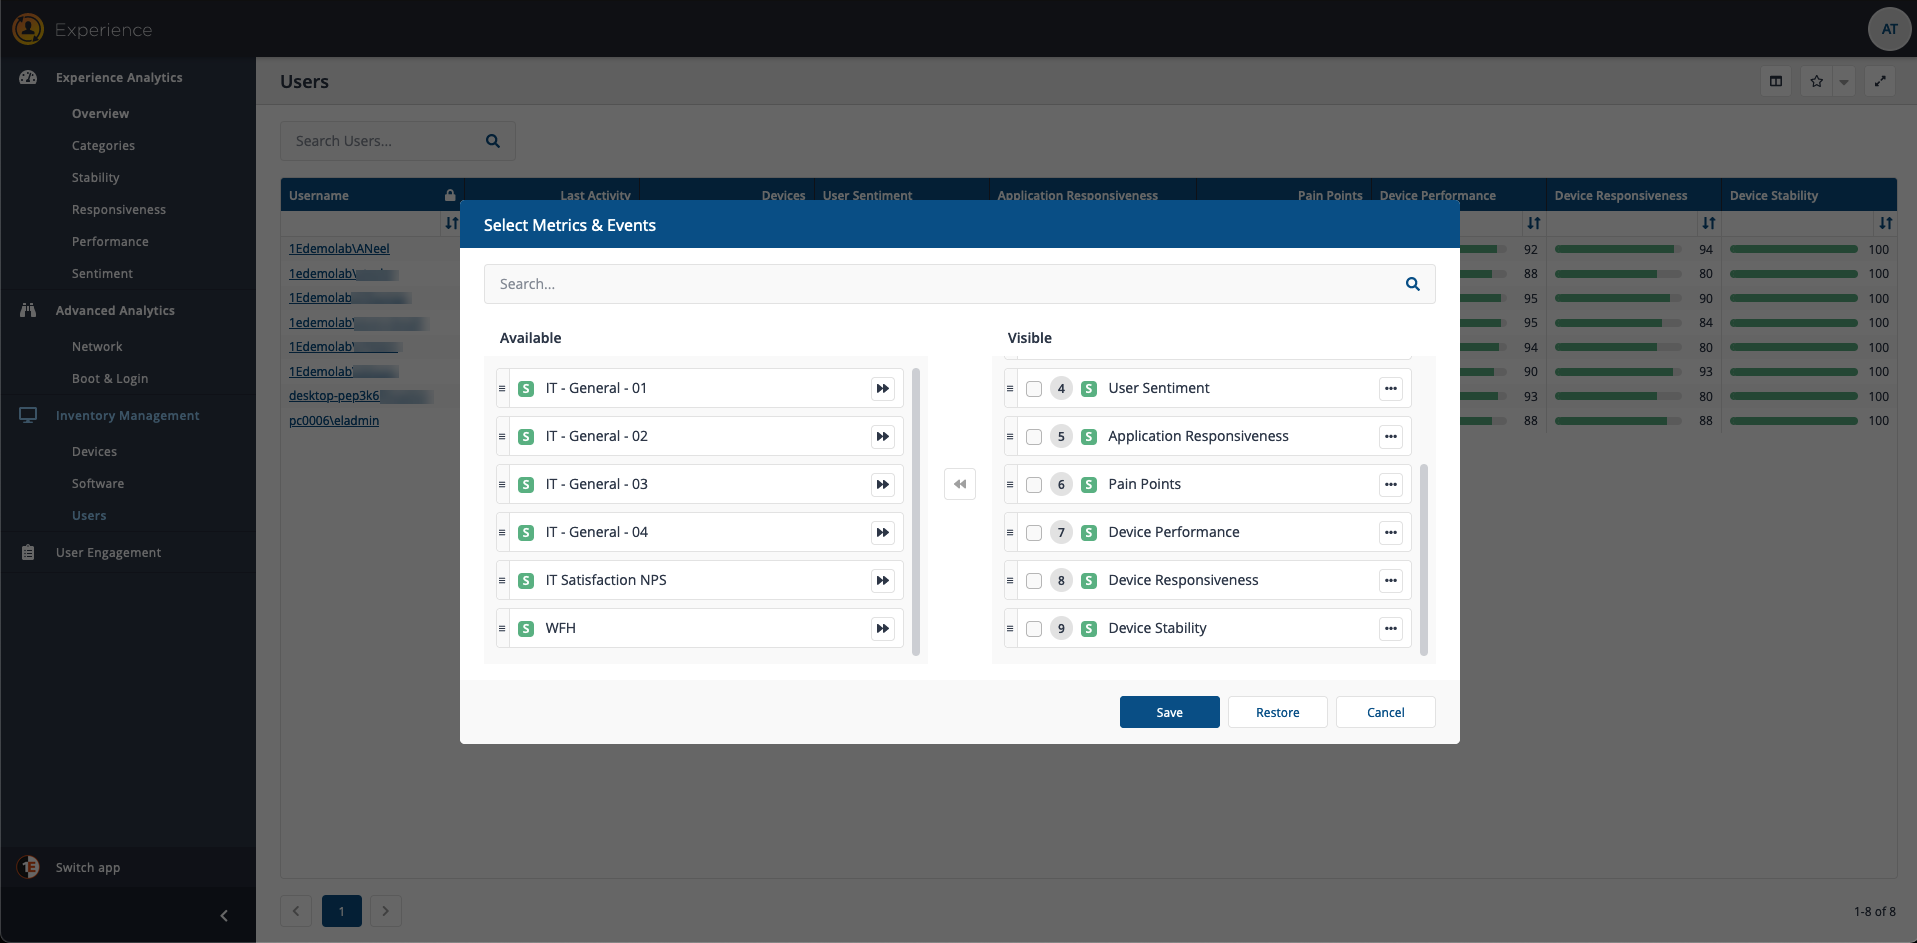
You can also control the information that is displayed in the table using the Select Metrics button in the page header, which displays the Select Metrics popup, allowing you to determine which columns get displayed and in which order.
The Users page - Overview tab
This page is displayed when you click on a username on the Users page and shows all of the details that have been gathered or derived for that user. There are two main tabs on the page: Overview, as shown in the picture opposite, and Sentiment, which displays a list of the user's survey responses.
The Overview tab displays the following information:
User details - a panel that displays information for the user that is held in AD and the aggregated scores for that user, as derived by the Experience application from all of the devices the user is associated with and their User Sentiment Survey responses.
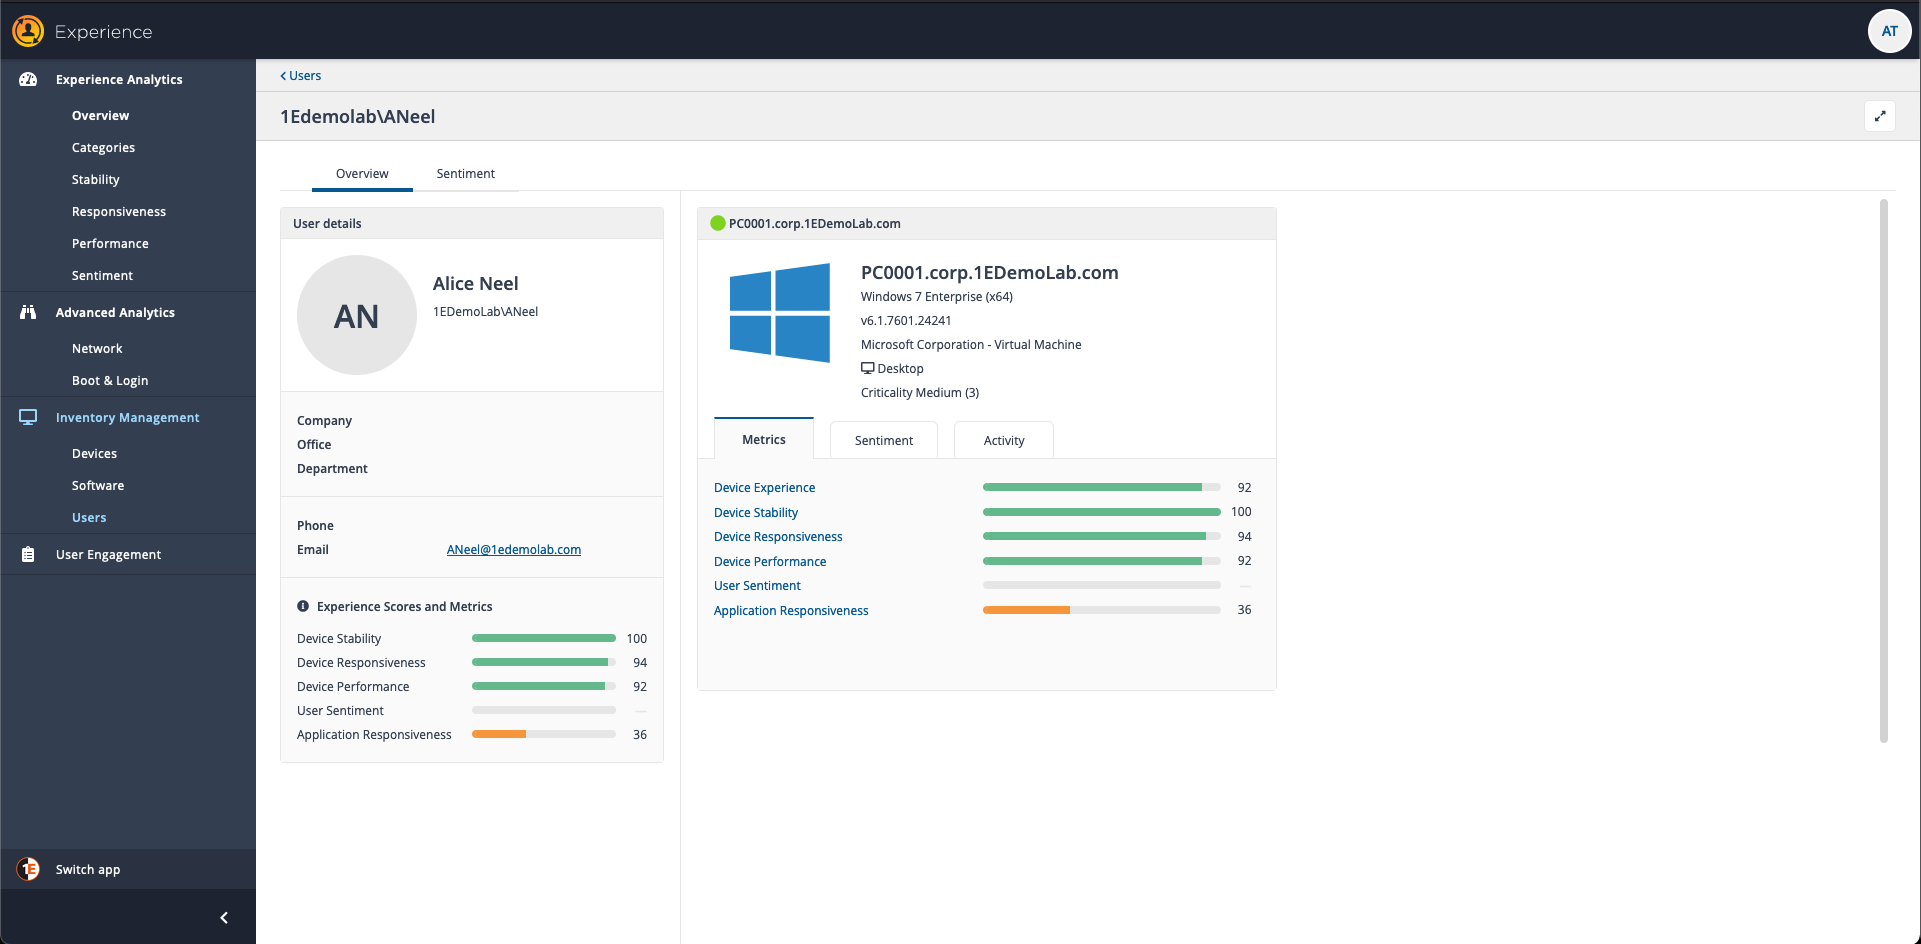
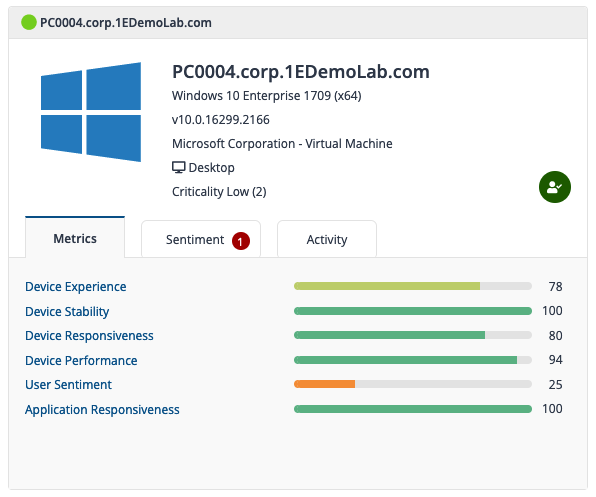
The Device Panel Metrics tab
To the right of the User details panel are device panels for all of the devices the user is associated with. The device panel displays some basic information about the device, as gathered by Tachyon, and three tabs: Metrics, Sentiment and Activity.
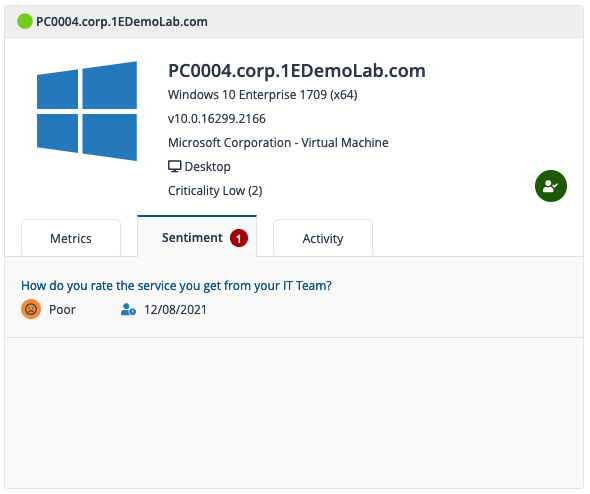
The Device Panel Sentiment tab
The picture opposite shows the Device Panel Sentiment tab for ACME-WIN1002.acme.local. This displays the last responses to User Sentiment Surveys made by the user on that device, clicking on the question link displays the user page Sentiment tab filtered to show just the responses to that question on that device.
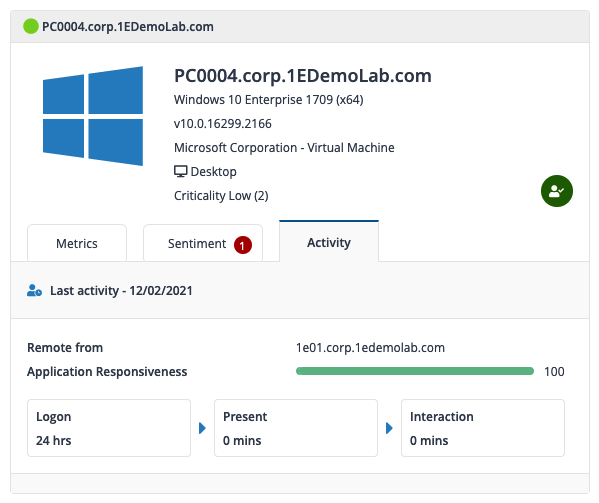
The Device Panel Activity tab
The Activity tab shows when the user was last logged on to the device, where they accessed it from, how well their session is performing in terms of how reactive it is.
There is also an indication of how long they have been logged on, how long they've been present at the device and how long their current interaction with the device has been.
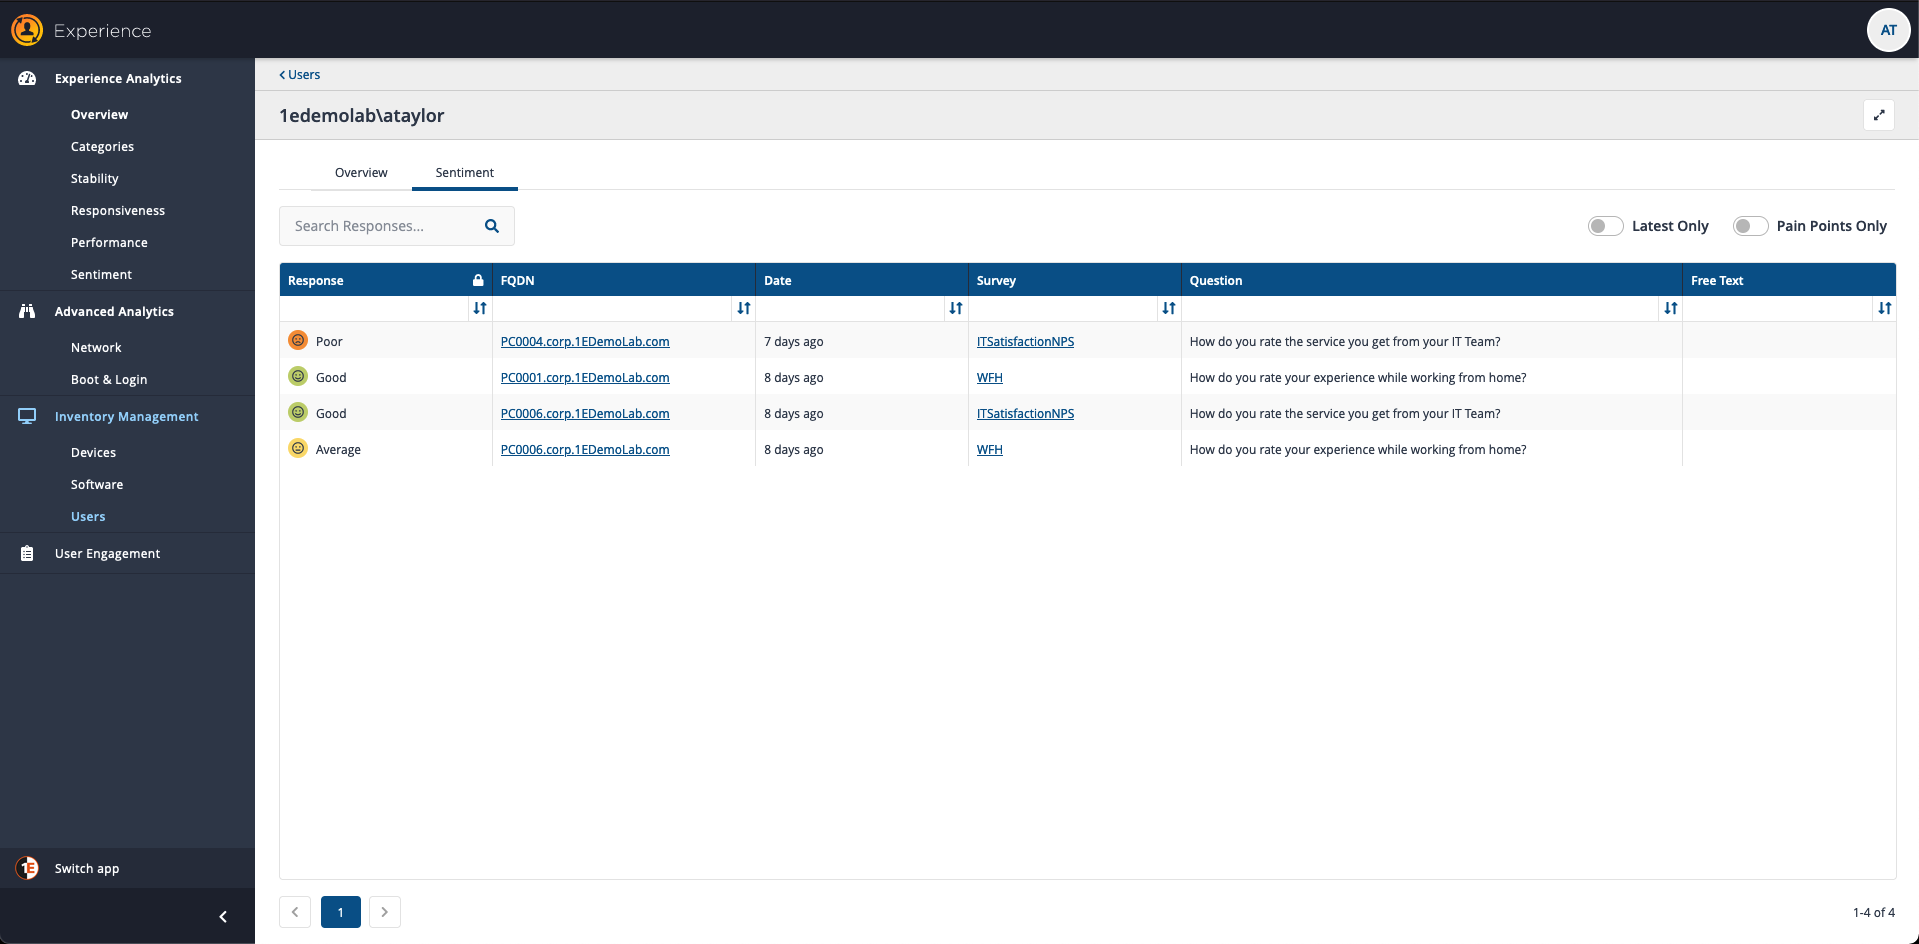
The User page - Sentiment tab
Here you can see all of the responses made by a user to any User Sentiment Surveys they have received. The main part of this page is a searchable Responses table:
Column | Description |
|---|---|
Response | The response they made to a User Sentiment Survey. |
FQDN | The FQDN for the device where they made the response. This is a link to the Devices page for the device, where you can view all of the device metrics. |
Date | How long ago they made the response. |
Survey | The User Sentiment Survey name. This is a link to the Survey page for the survey, where you can view all the Survey responses. |
Question | The question for the User Sentiment Survey. |
Free text | Any free text they entered when responding. |
You also have the option for viewing the latest responses to the survey by switching the Latest Only toggle to on. You can also select to display only the responses that are ratedPoororVery Poorby switching thePain Points Onlytoggle to on.