Investigating Boot and Login Performance
In this scenario, the EUC manager uses the Advanced Analytics→Boot & Login page of Experience to monitor and examine experience related to the boot and login performance for devices.
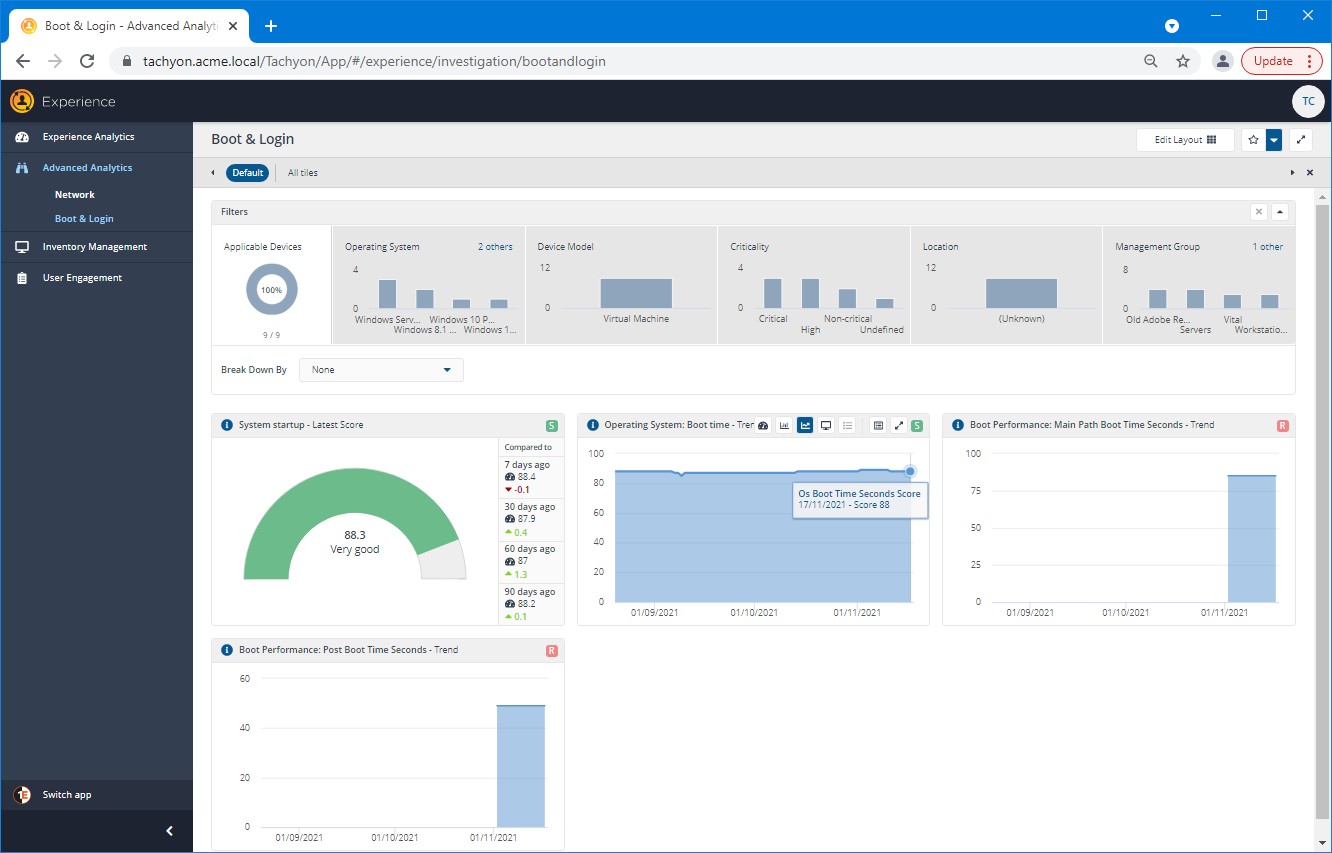
Taking a look at the Boot & Login page
The Advanced Analytics→Boot & Login page provides a dashboard where boot and login performance data can be examined. By default, there are two score related tiles: System startup - Latest Score and Operating System: Boot time - Trend. The rest of the tiles show averages of the raw, unprocessed data being measured across all the devices.
The EUC manager navigates to the Advanced Analytics→Boot & Login page, sees that the System startup - Latest Score is 88.3 Very good, but also sees that there's been a very slight downward trend for both the System startup score over the past 7 days and for the Operating System: Boot time.

Focusing on the Boot time
Looking at the trend on the Operating System: Boot time - Trend tile, they click on one of the data points in the chart, which navigates to the Operating System: Boot time page.
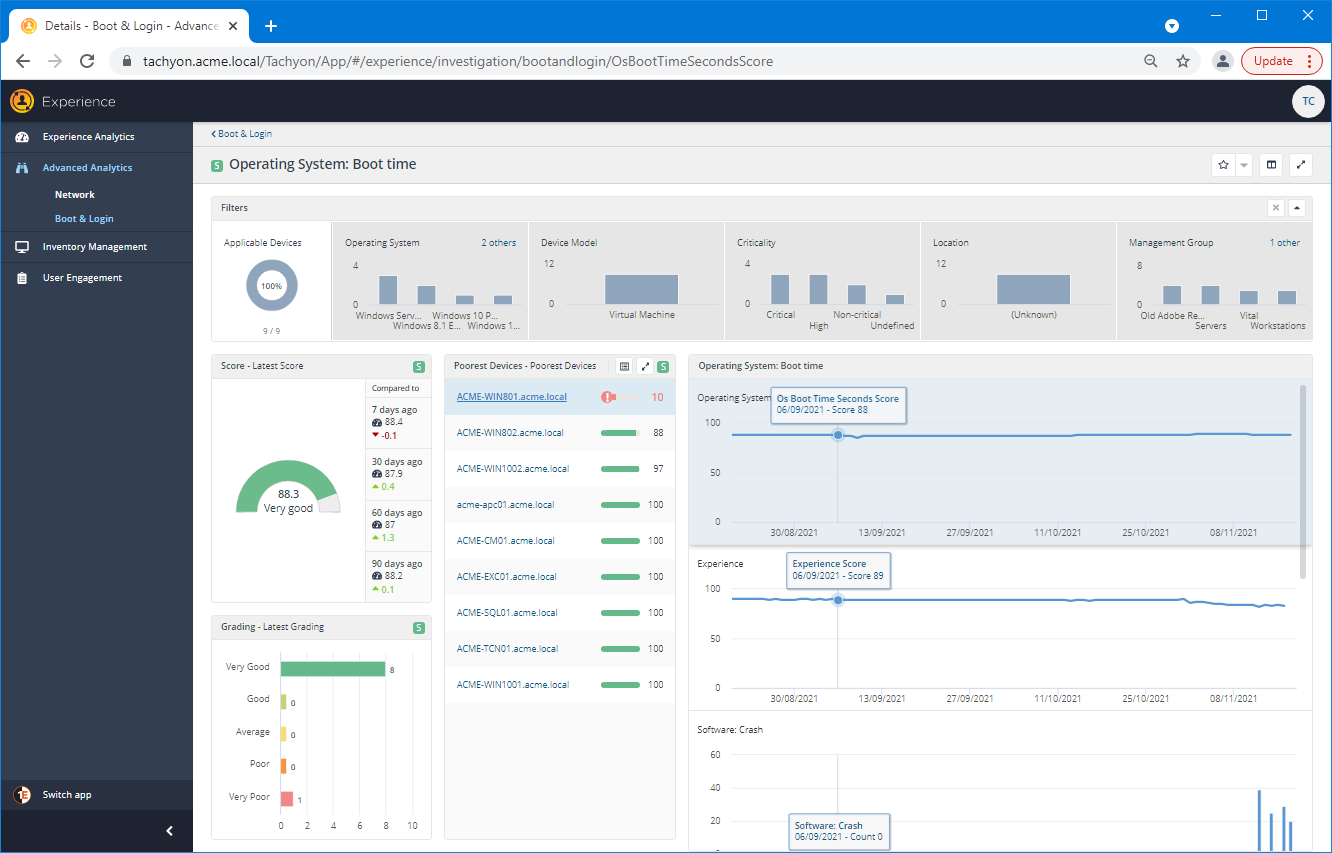
The Operating System: Boot time page
Here, the EUC manager can see in the Poorest Devices tile that one device isn't performing particularly well on its boot time score. Selecting the device FQDN link displays its device details.
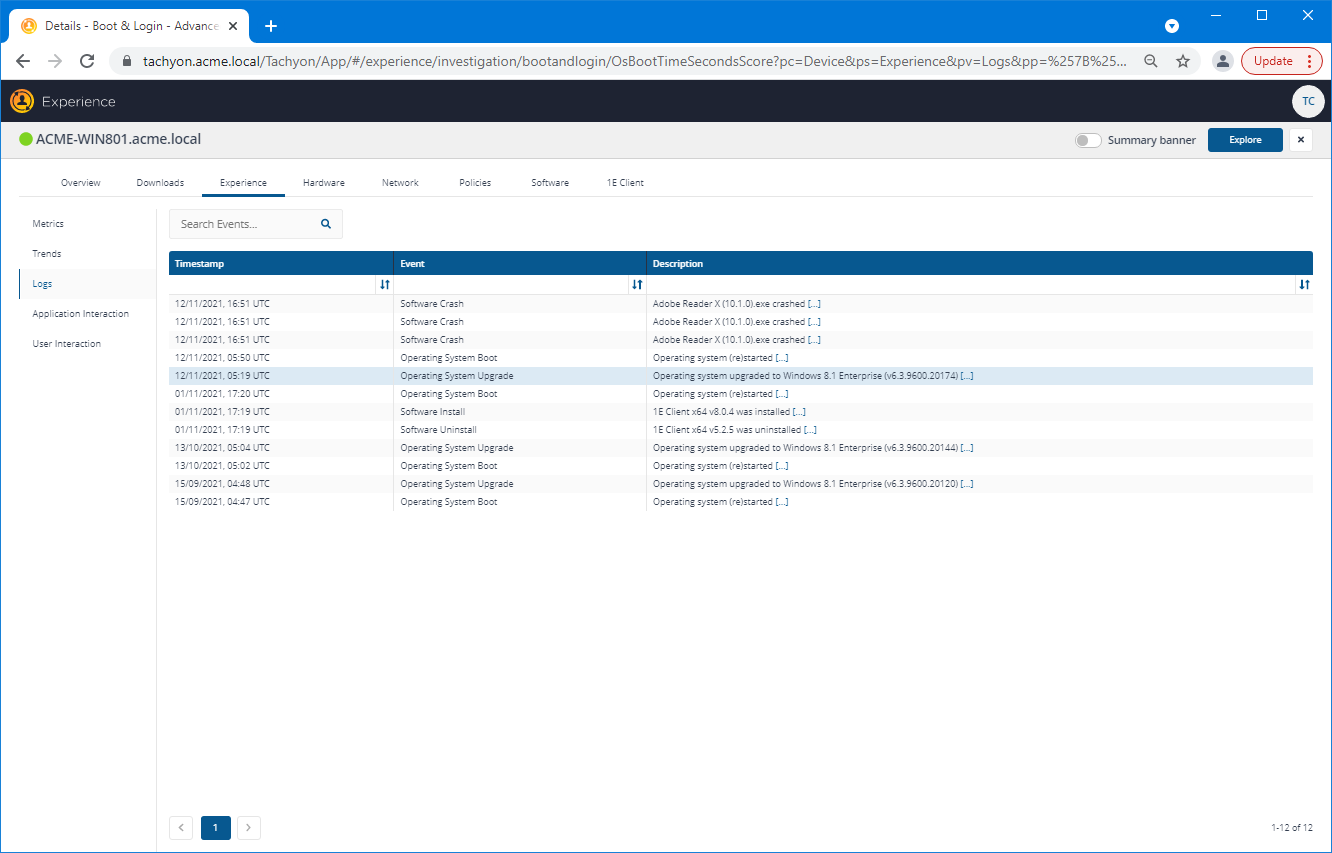
A possibly significant sequence of events
From this link, the device details opens on the Experience tab with the Logs panel displayed, which shows the system events for the device. Here, the EUC manager sees that the most recent Operating System Boot event for this device has occured just after an Operating System Upgrade.
They conclude that this may be a contributing factor to the poor startup time and that they can safely overlook the issue for the time being. However, they make a note of the device name just in case there is actually an ongoing issue that stems from another cause.