Creating your own dashboard
Experience allows you to customize and save your own dashboards for viewing later, the saved dashboards are called Presets. This tutorial shows you how to create and use them.
The ability to customize dashboard views is common to the following Experience pages.
Experience page | Pages with customizable dashboard views |
|---|---|
Experience Analytics |
|
Advanced Analytics |
|
Inventory Management |
|
At the top of pages where you can customize the dashboard you'll see the controls highlighted in the picture.
Note
Before saving the dashboard you may want to choose which metrics to show in your custom Preset view. The way you choose metrics differs depending on the page you're customizing:
Stability, Responsiveness, Performance, Sentiment, Network and Boot & Login pages use Edit Layout
Devices, Software, and Users pages use Select Metrics.
For a detailed walkthrough of how to choose and save the metrics for your new Preset, please refer to Adding metrics to a dashboard.
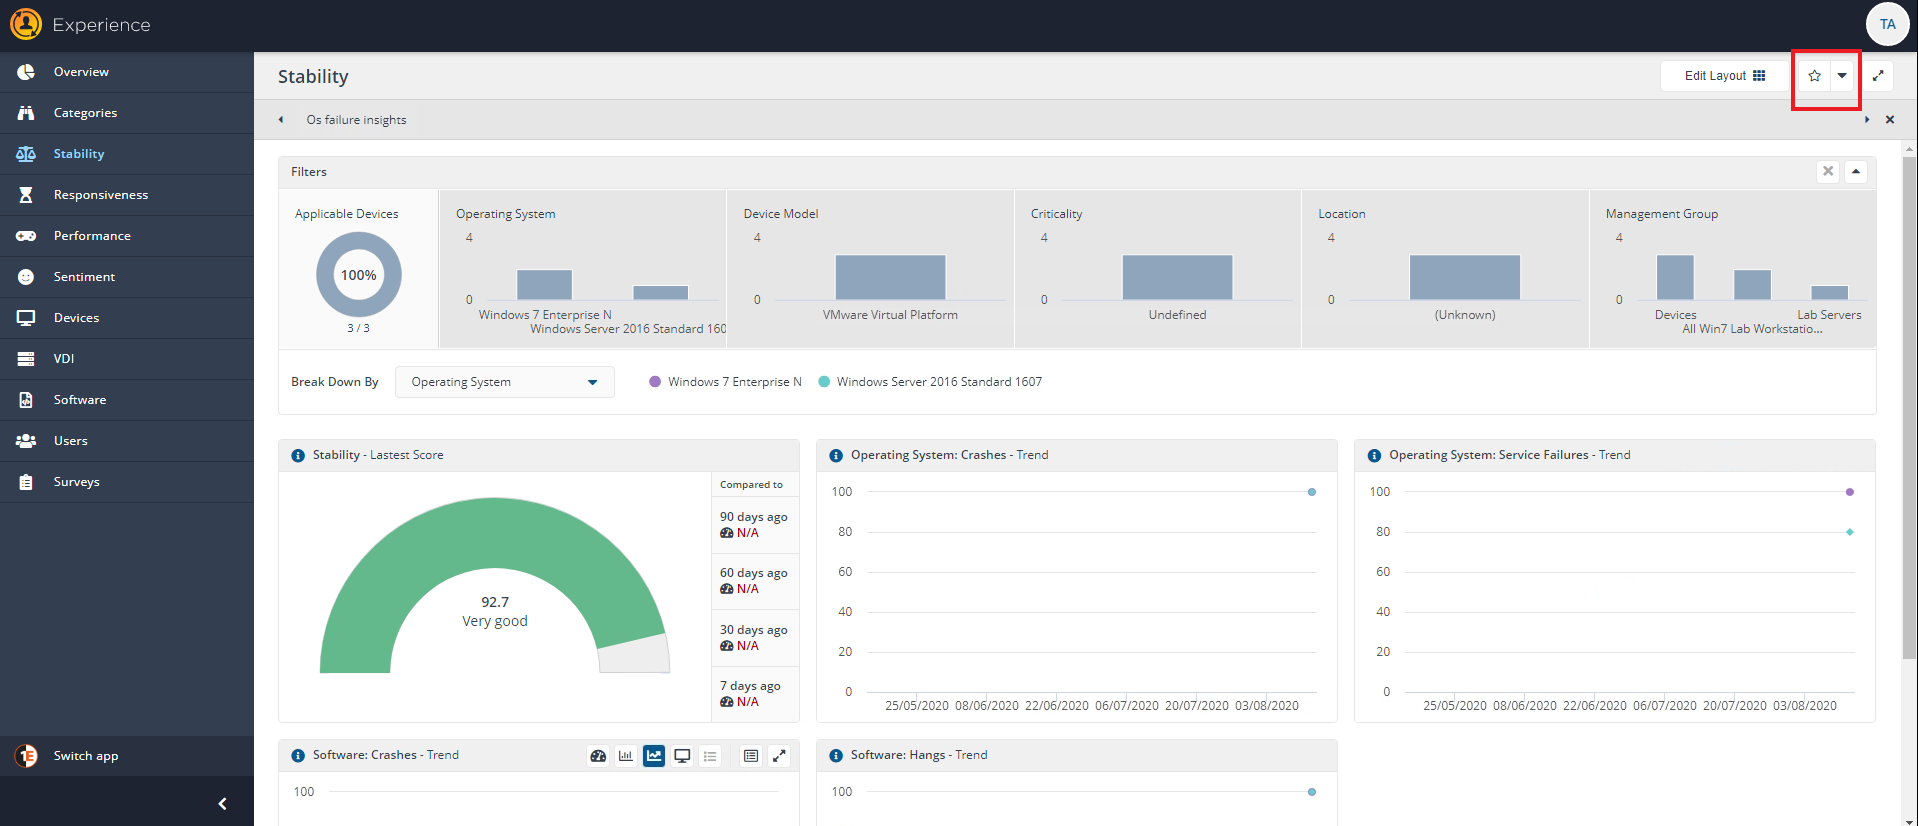
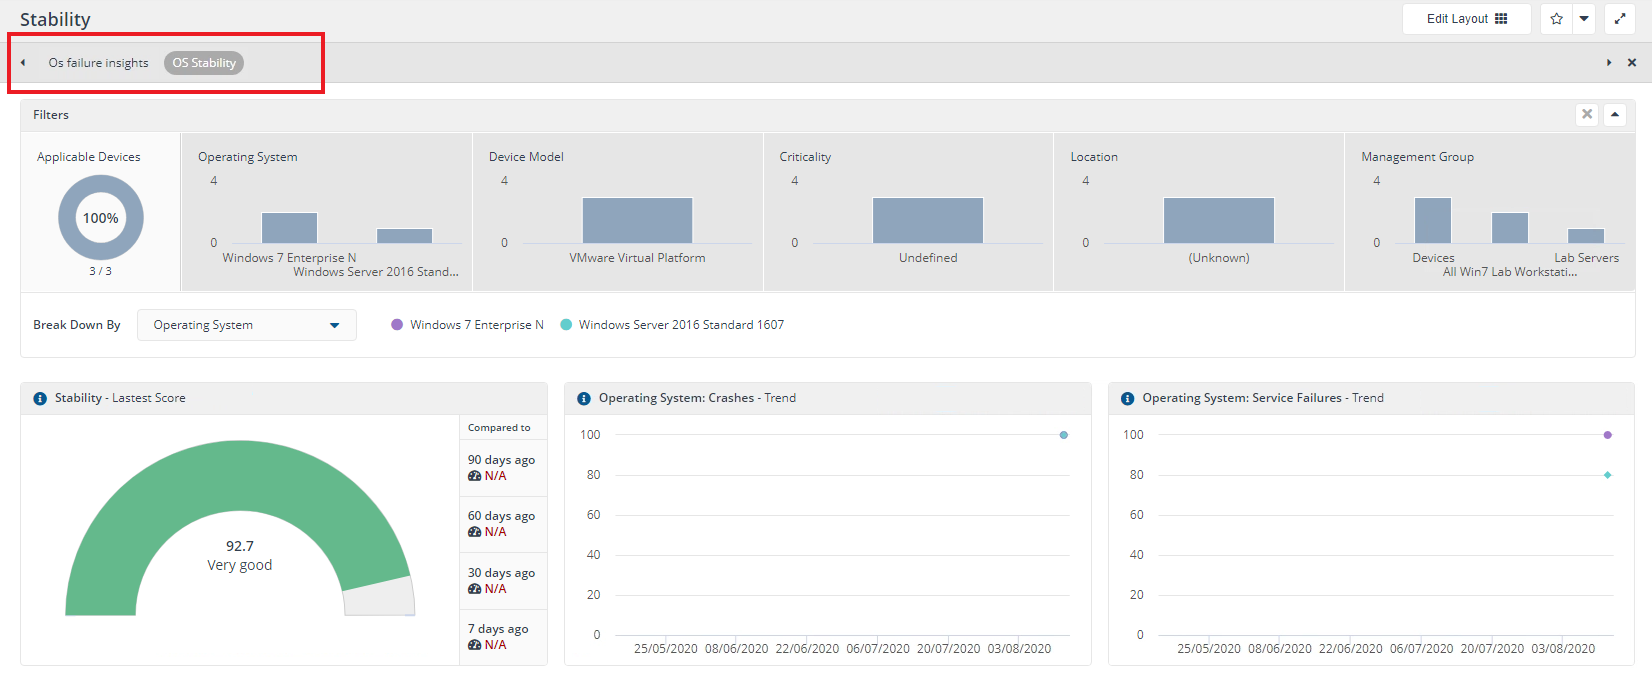
Our example shows theStabilitypage where the tiles displayed have been edited to focus on the following metrics:
Stability - Latest Score
Operating System: Crashes - Trend
Operating System: Service Failures - Trend.
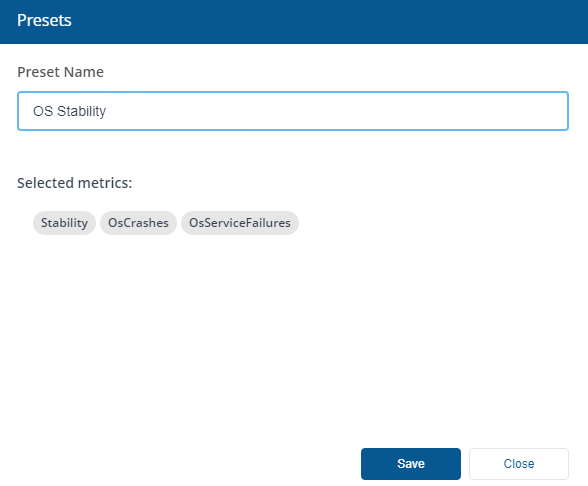
To save the preset we click the star button on the top right of the page, called Save the configuration as preset. This opens the Presets popup where we can set the Preset Name and save the Preset view for our selected metrics:
Stability
OsCrashes
OsServiceFailures.
Your selected metrics and filters will show on this screen.
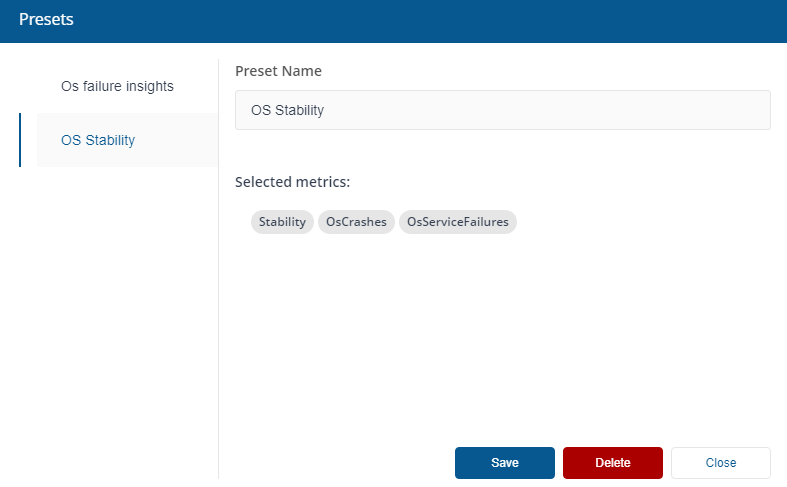
We'll set the Preset Name as OS Stability and click Save to return to the Stability dashboard page.
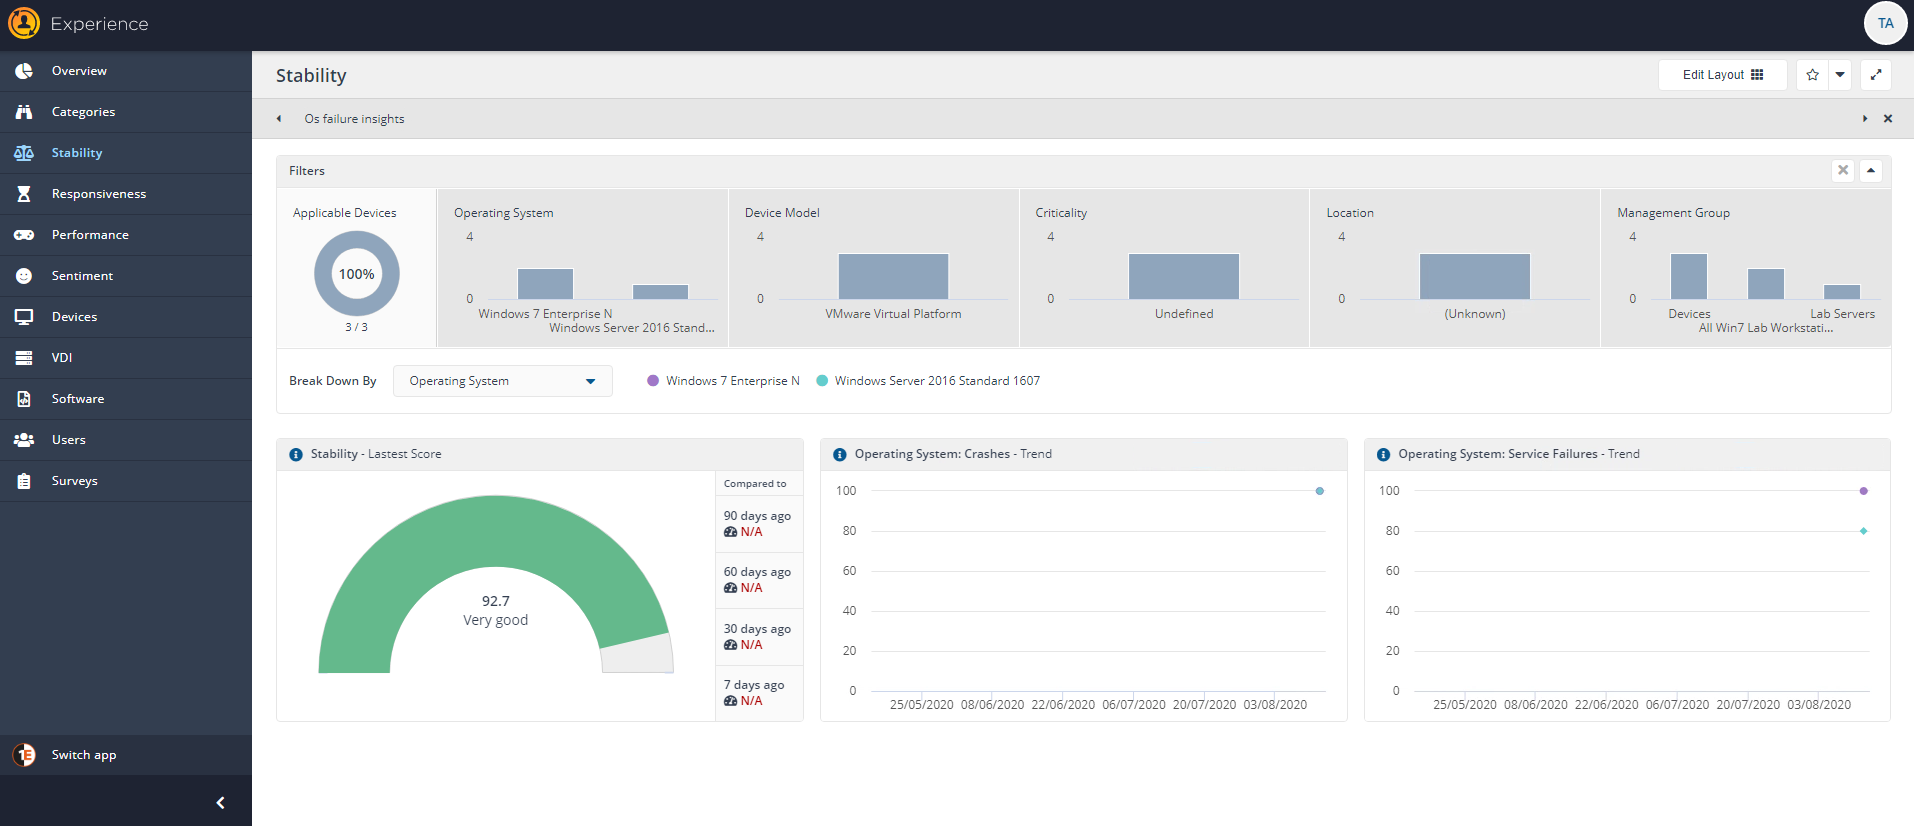
Now, on the Stability page our Presets are shown at the top of the page on the preset view bar. When you have multiple Presets on the presets bar, you can view that preset dashboard by selecting one of them.
Note
The preset bar can be closed using the X icon on the right side of the bar. You can reopen the preset bar by using the down arrow next to the star icon and selecting the eye icon.
The preset bar is also reopened when current page is manually reloaded, or when you navigate to another page the preset bar will be open when you return.
To view (eye icon) or manage (gear icon) a Preset, click the down arrow next to the star button.
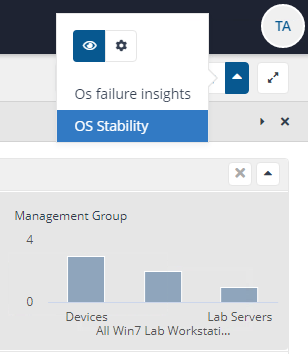
When you click the gear icon you can do either of the following:
Changethe name used for the selected Preset by editing the Preset Name field then clicking Save.
Delete the selected Preset by clicking the Delete button.