Focusing on specific device experience
In this scenario we show how a level 1 helpdesk analyst would use Experience and Explorer together as part of their daily routine. A level 1 helpdesk analyst usually focuses on a specific device at any particular time. Here the user of a device is on the phone with the analyst describing the symptoms. Experience will enable the analyst to troubleshoot primary causes, and Explorer will let them interact directly with the device to further investigate and resolve the issue.
A case for the level 1 helpdesk analyst
An end-user, Gary Hayes, calls the IT helpline, gets put through to the level 1 helpdesk analyst, and reports that their device is running slowly.
Tracking down the issues in real-time
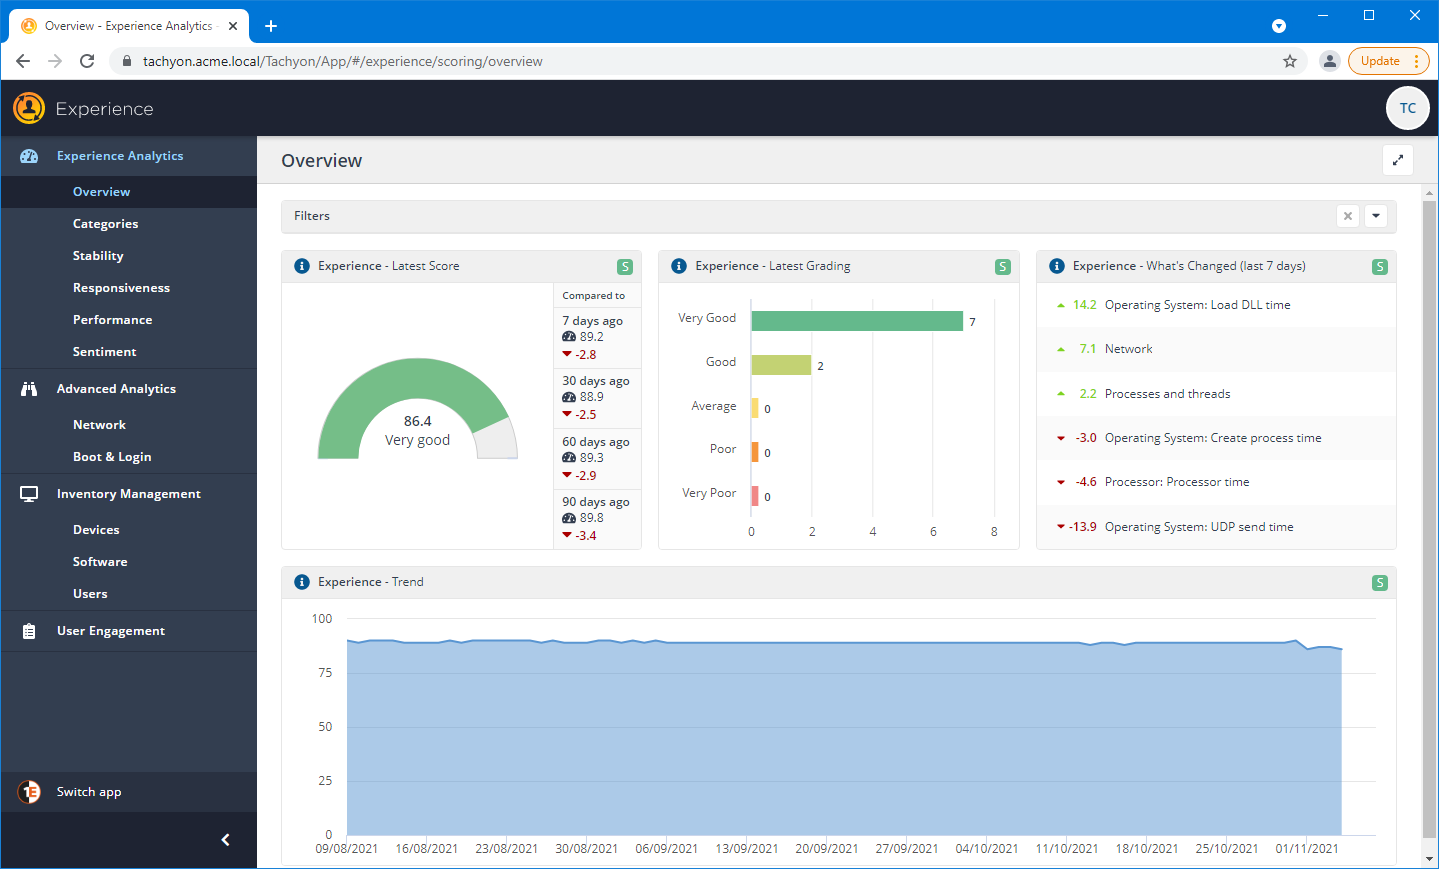
While the user is on the phone, the Level 1 helpdesk analyst checks the Experience tab they have open in their browser.
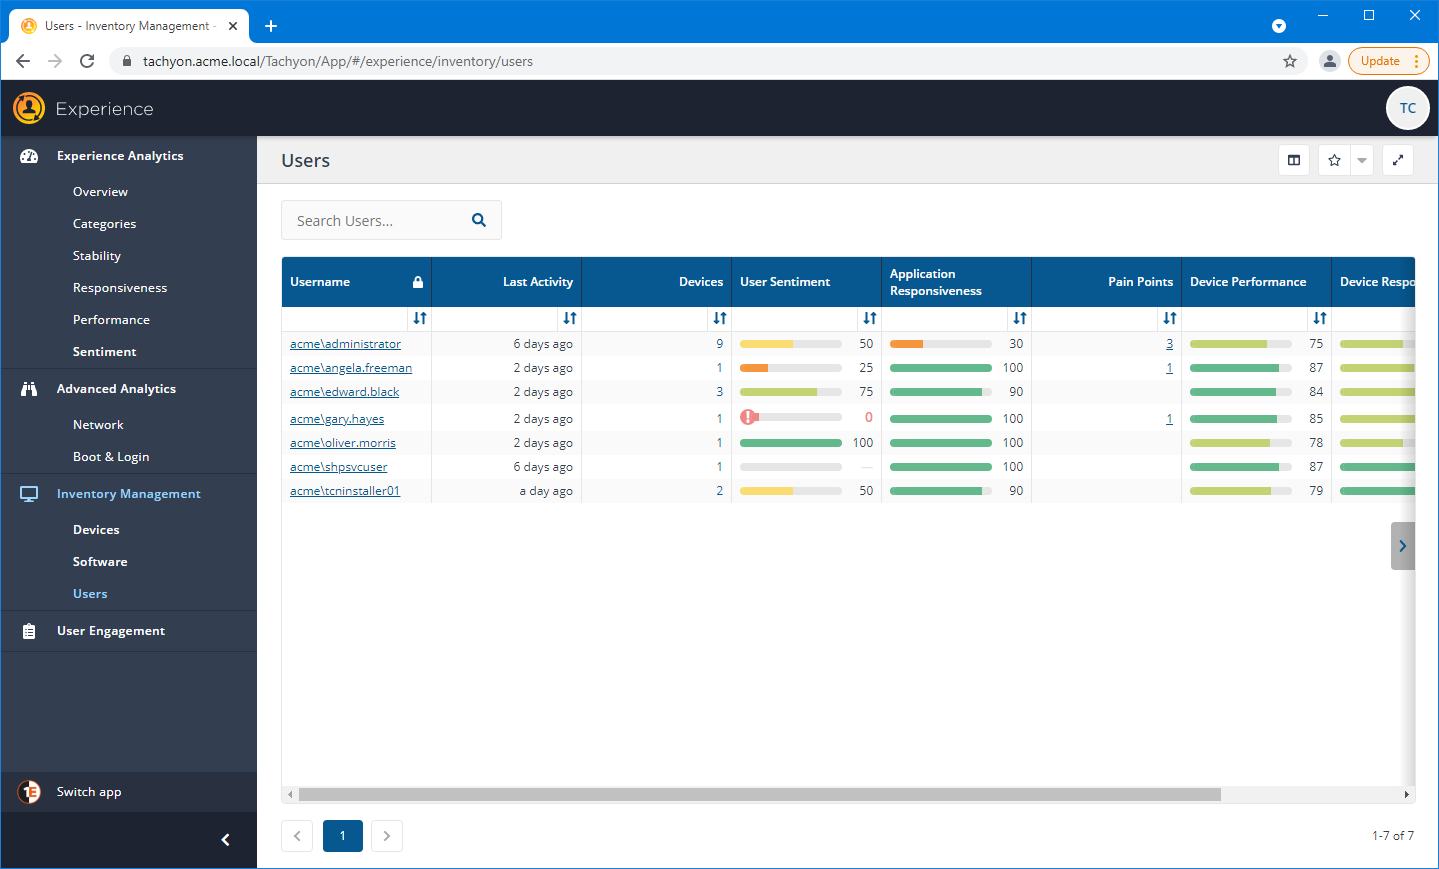
Getting information via the Users page
They navigate to the Experience→Inventory Management→Users page, which provides an overview of all the users currently known to Tachyon. To check the device the user is working on, they click on their link in the Username column.
Information on the devices associated with the user
The user's page shows all the devices known to be associated with the user by Tachyon. In this example it shows that Gary Hayes is associated with the device ACME-WIN1002.acme.local. The analyst can also see that this user has given some negative User Sentiment feedback on this device.
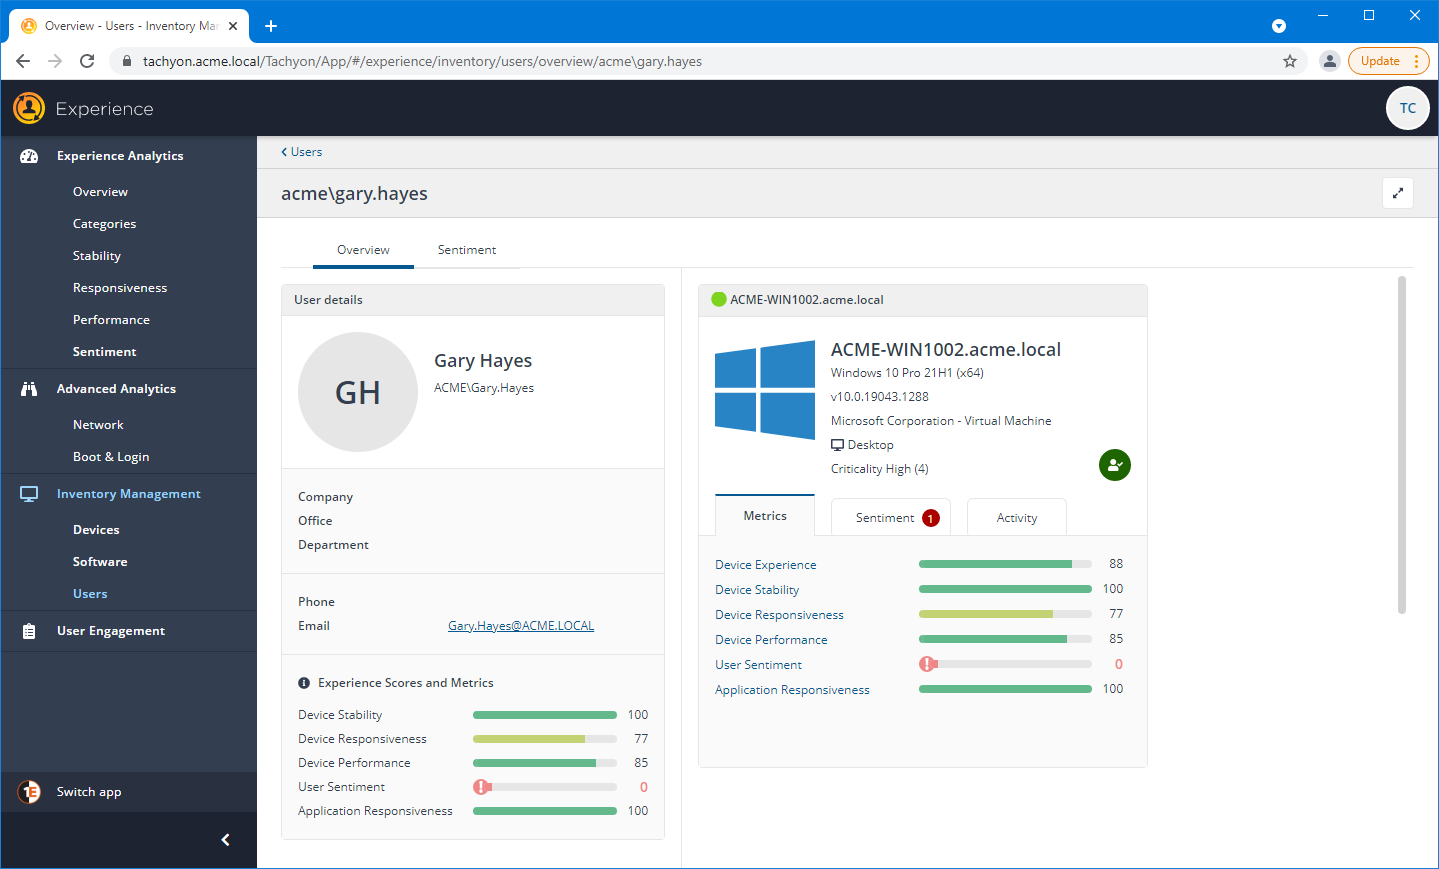
Investigating the device
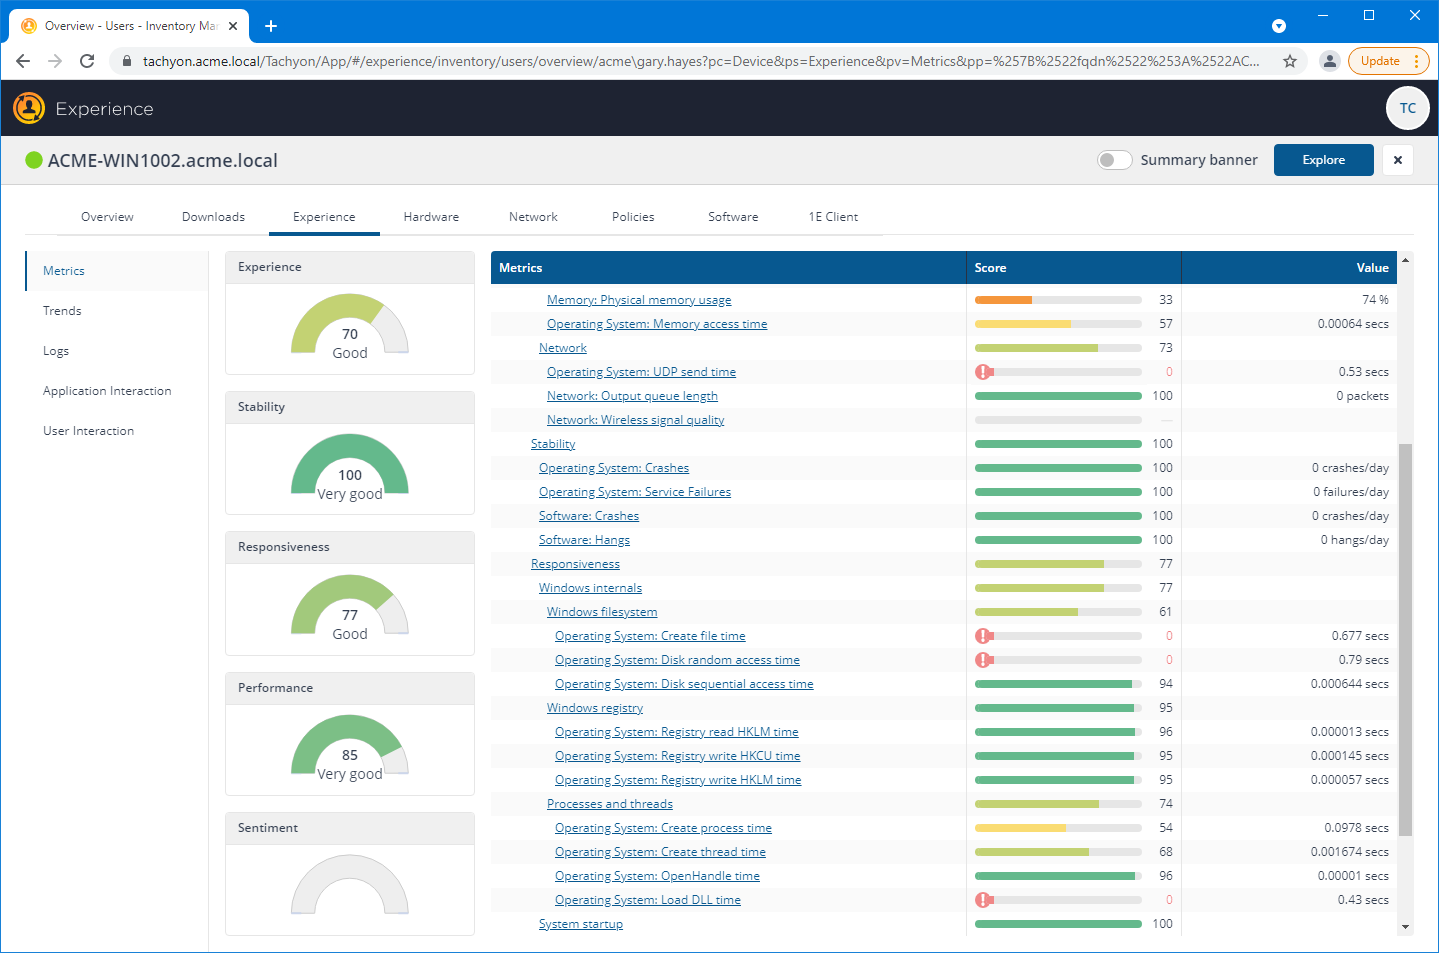
Clicking on the panel for the device shows its Device View. Here on the left of the pane you can see the summaries for the device's overall Experience, Stability, Responsiveness, Performance and Sentiment scores. On the right, you can see the Metrics that have been captured for the device.
Scrolling down through the metrics the analyst can see critical values for the Operating System: UDP send time, Operating System: Create file time, Operating System: Disk random access time, and Operating System: Load DLL time metrics. The Memory: Physical memory usagemetric also has a low score, perhaps there's a memory related issue that is causing the other issues and slowing the device down.
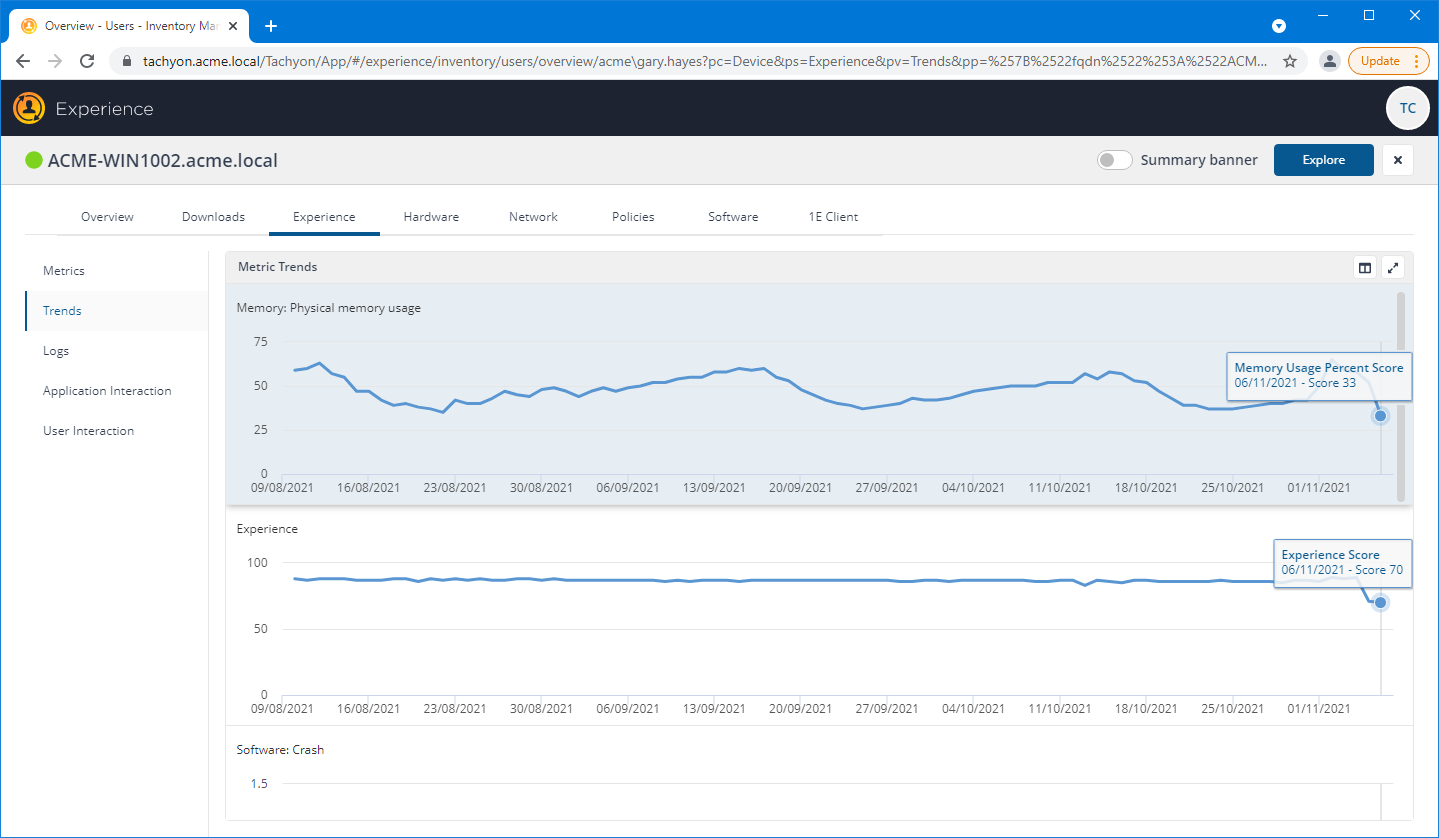
Memory usage trends, a possible cause?
Clicking on the link for the metric drills down show to show the Trends for that parameter. Here, the analyst can see that the general trend (even though the measurement has only been taken for just a few days) is headed downwards. So could be worth investigating more, the analyst makes a note and continues investigating.
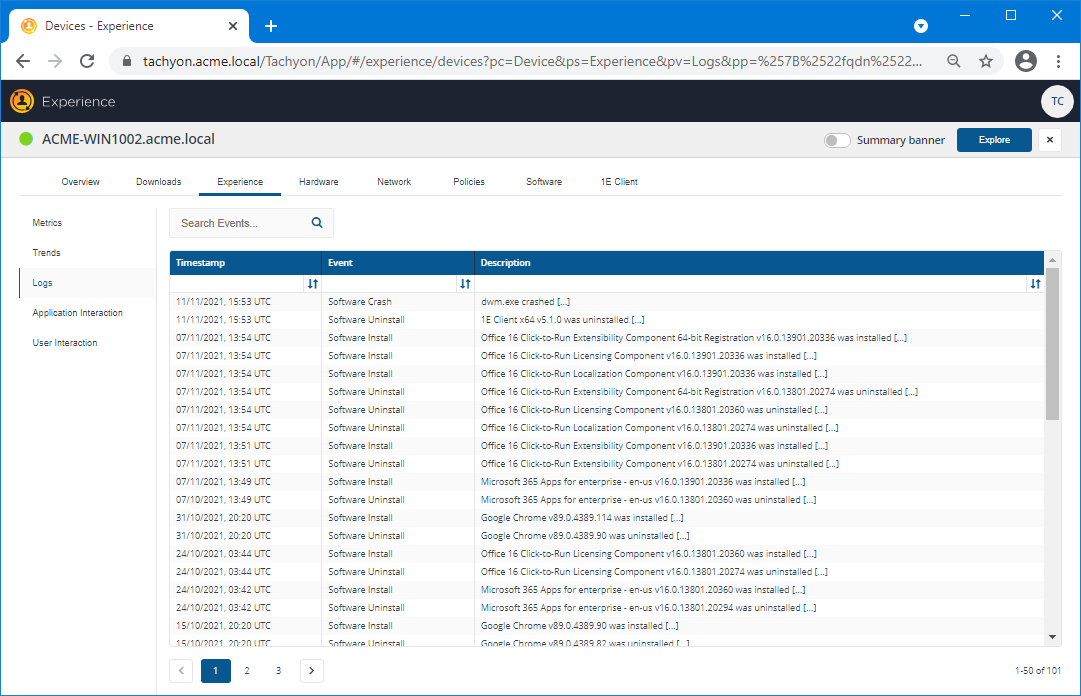
Checking the Event log
Clicking on the Logs tab displays any significant events that have been stored in the Event log on the device. In this example, the analyst can see that there's been one crash - which might or might not be significant, but worth noticing at least.
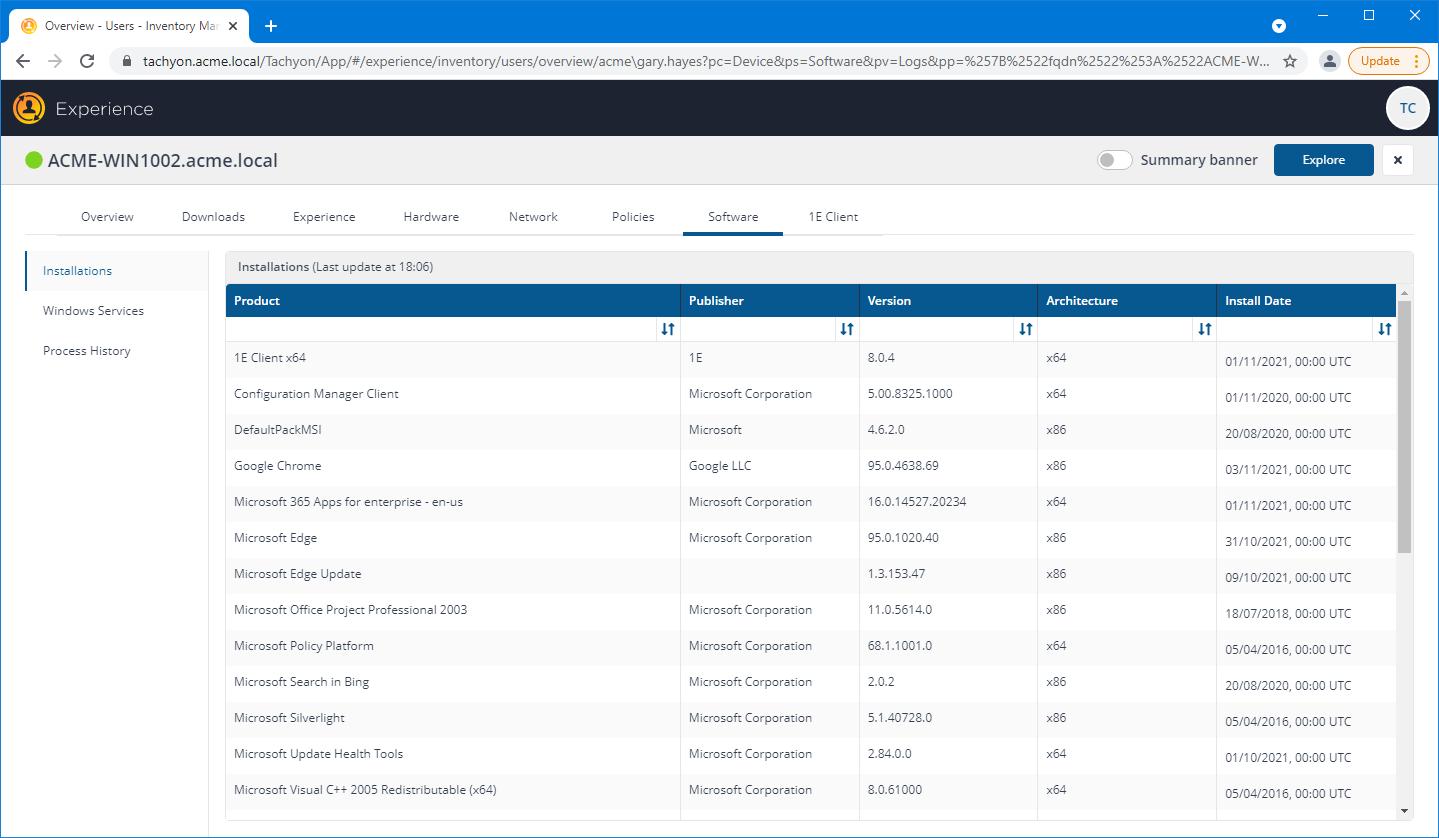
Checking the Software installed on the device
Clicking on the Software tab displays all the software reported as being installed on the device. This may be useful information in general, but doesn't show anything out of the ordinary as far as the analyst can tell.
Further investigating the device using Explorer
Having reviewed all the information retrieved for the device by the 1E Client, a reasonable next step for the analyst is to query the device directly to get some extra info that's not captured by default. They have an idea that memory issues might be causing the slowdown and something they would like to check is what processes are running on the device.
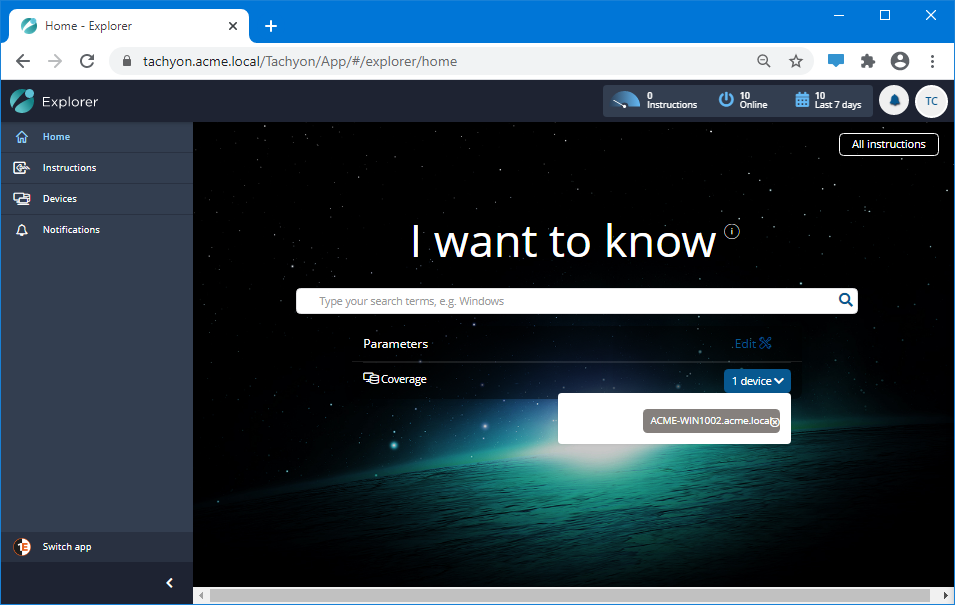
Clicking on the Explore button in the Device View navigates to the Explorer application, assuming that the analyst has the required Questioner and Actioner permissions. In the Explorer application the analyst can confirm that the Coverage for the question is constrained to the ACME-WIN1002 device. This means that the instruction they select will be run on that target device.
Finding out what processes are running on the device
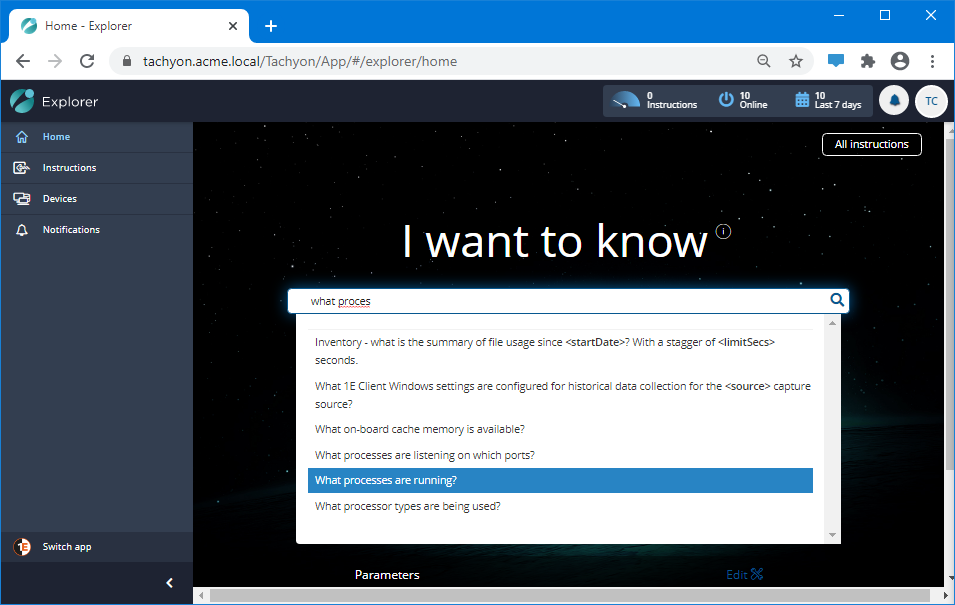
The analyst starts typing What proces into the search field, as they know that's involved in the instruction text. They could have typed process or processes if they were less sure and just wanted to find all the instructions related to processes.
When the list of suggested matches comes back the analyst selects: What processes are running?
There is also a useful product pack on the Tachyon Exchange called: Windows Process Management which includes instructions to give a verbose listing of all running processes (List running process details) and another is List resource consumption details to identify what is impacting the end-user experience.
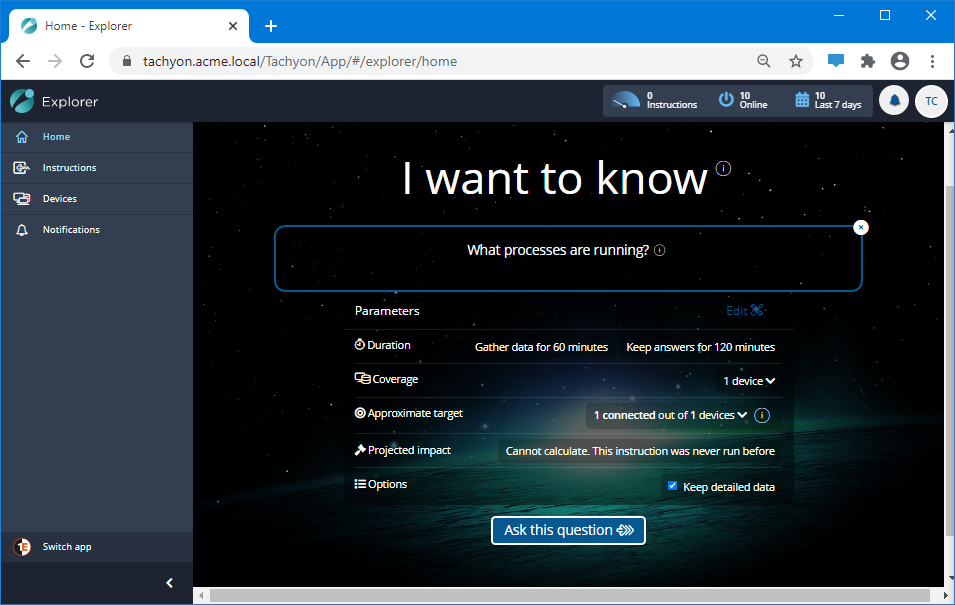
The instruction is loaded into the Explorer home. All the analyst needs to do is click Ask this question to fire it off to the selected device.
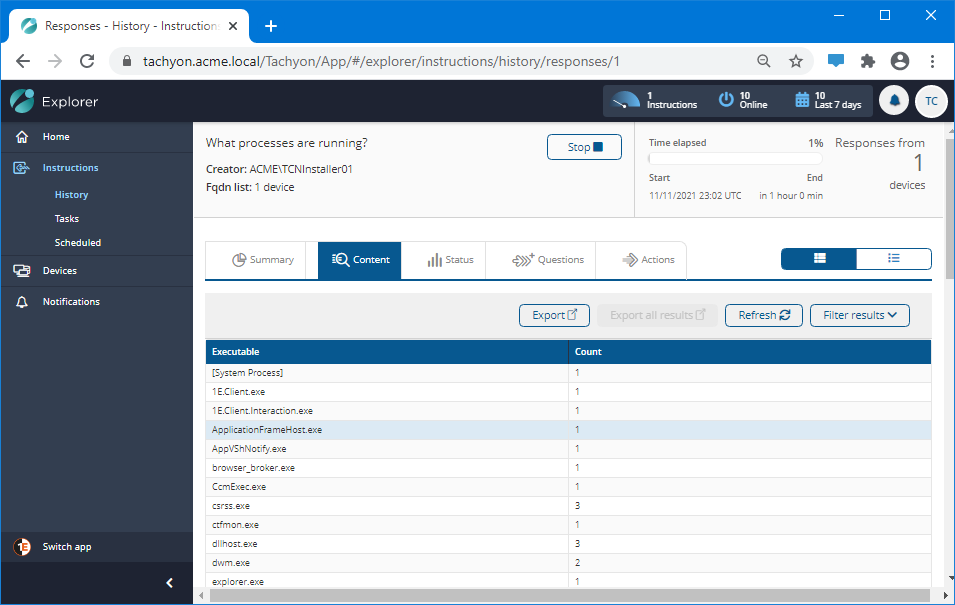
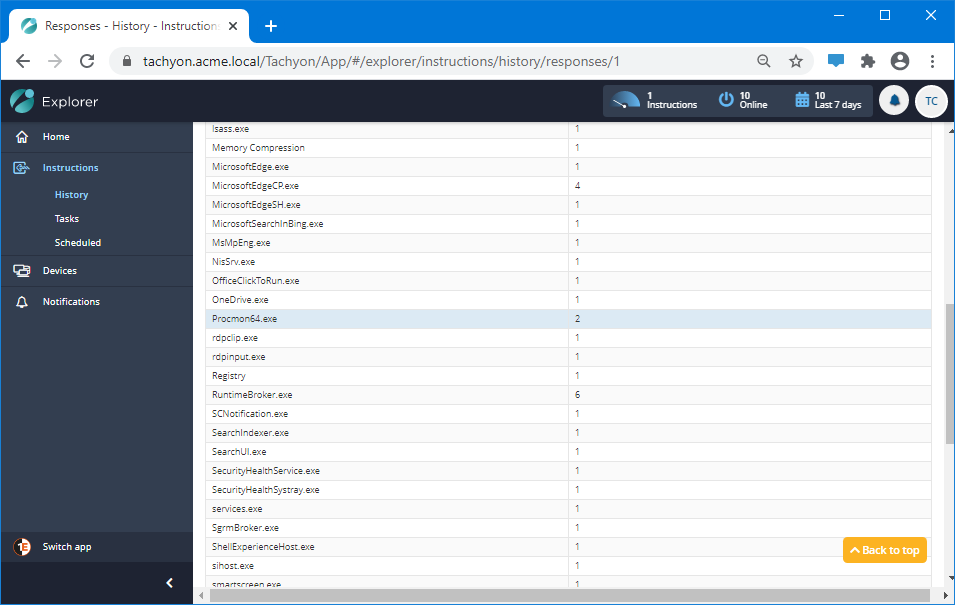
The list of running processes comes back almost immediately.
A possible culprit process?
The analyst scrolls down through the list until they find one that might be a cause of the issue. Procmon64.exe is a good candidate as it can use up large amounts of memory and may still be running even if the front-end is not being displayed. In this instance the effect could be exaggerated by the fact that there are two copies of this process running.
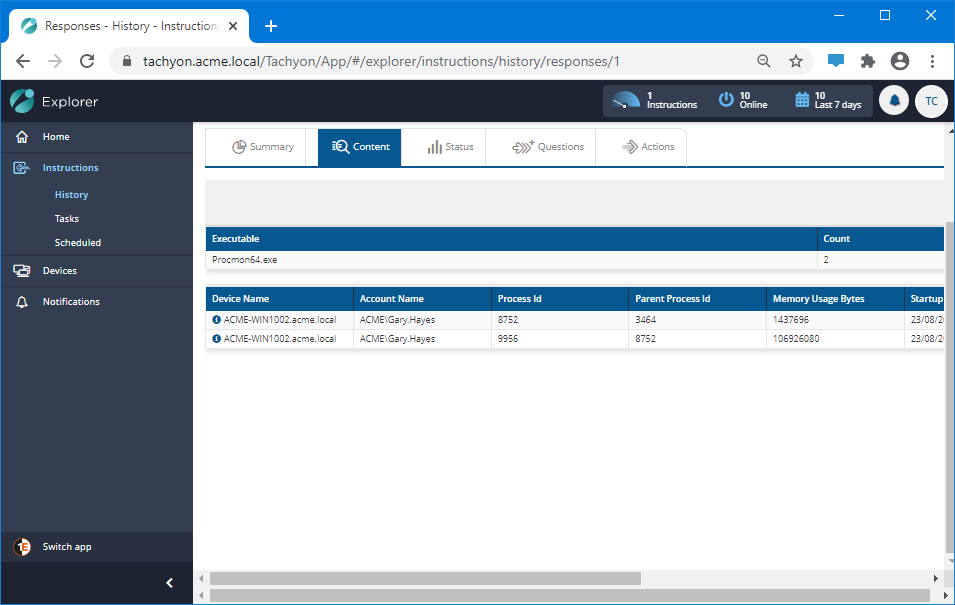
Details reveal that the process is using large amounts of memory
Clicking on the number link in the Procmon64.exe row in the results table, displays details for those results. Here the analyst can see that the pair of processes running are consuming a lot of memory. If the user is sufficiently skilled we can check over the phone whether the Procmon interface is visible and therefore these are just background processes that are consuming resources. Now it's time to kill the processes and hopefully return the device to its proper state.
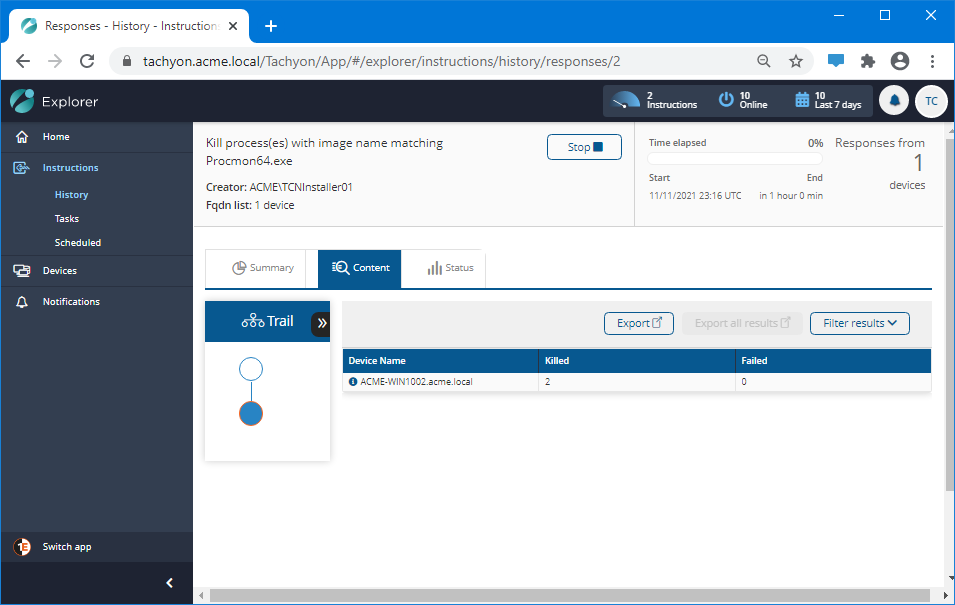
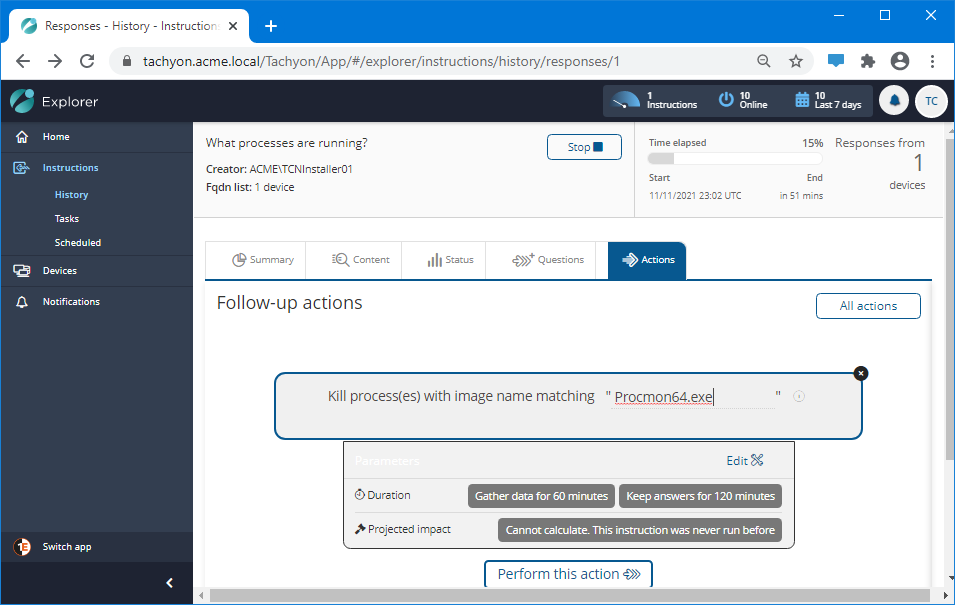
Resolving the issue
You can kill a running process from Tachyon using the Kill process(es) with image name matching... action. The analyst selects to run a Follow-up action, by clicking on the Actions tab on the results page, searching for the kill action and then filling out the image name parameter with the text Procmon64.exe.
They run the action this way because the scope has already been set to the right device.
After clicking Perform this action Tachyon puts them through the authentication and approval process. First they have to confirm their credentials.
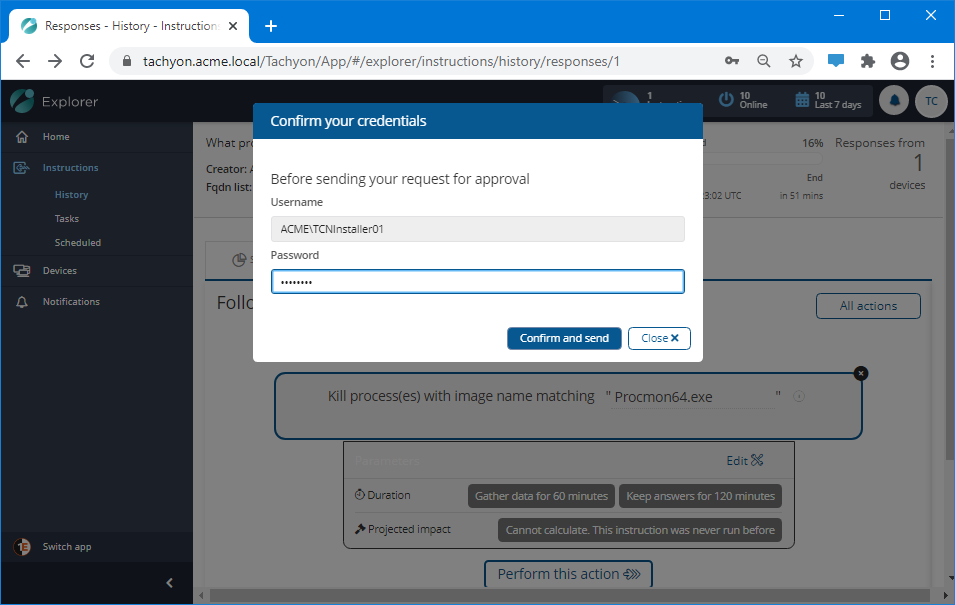
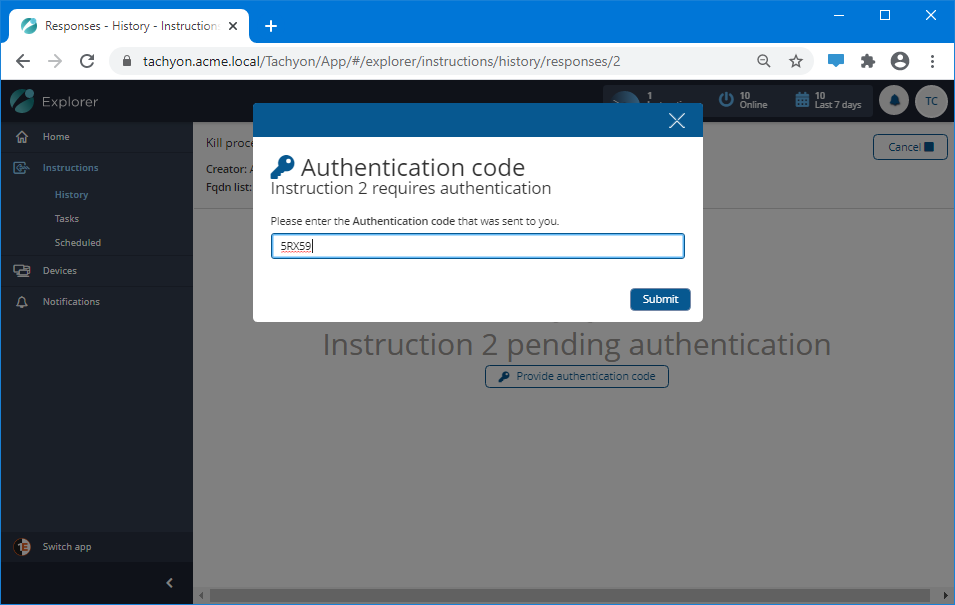
Then they have to supply the Authentication code that has been emailed to them.
The action must then be approved by another user with Approver permissions. When all this is done, the action runs and the Procmon64.exe processes are killed on that device. Hopefully that was the cause of the problem, the analyst goes back to the user on the phone and gets them to confirm that things have improved.
In conclusion
This is a simple scenario that shows how Experience can be used to detect a problem and Explorer can be used to investigate and resolve the problem. It shows how the two applications working together can be used as part of the analyst's process for solving end-user device issues reported to the IT helpline.