Glossary
A glossary of Tachyon Experience terminology.
Experience alphabetical glossary
Term | Definition | ||||||||||||||||||
|---|---|---|---|---|---|---|---|---|---|---|---|---|---|---|---|---|---|---|---|
Algorithms | Tachyon Experience uses the following algorithms to derive a score for that metric.
| ||||||||||||||||||
Categories | Experience uses four categories to calculate the overall Experience Score.
| ||||||||||||||||||
Categories page | The Categories page shows a dashboard of the scores from each of the four categories: | ||||||||||||||||||
Daily Digest | Some metrics for Experience are collected as daily summaries. These are sent to the Tachyon Switch each night at midnight. If the 1E Client cannot contact the server at midnight the daily digest data is saved at the device and is sent to the server the next time the server can be contacted. In this version, there is not the ability to force the 1E Client to send the information outside of the nightly cycle. The data that is collected in the daily digest is:
| ||||||||||||||||||
Device Criticality | Using Device Criticality Assigning Criticality to devices according to their importance within your organization. | ||||||||||||||||||
Devices page | The Devices page provides a list of all devices visible to Tachyon Experience. You can see all of their Experience, Stability, Performance and Responsiveness statistics and sort them accordingly. | ||||||||||||||||||
Experience Score | The Experience Score is an overall number that represents the user experience of a given device. It is a total of weighted scores in the four categories - Performance, Stability, Responsiveness, and User Sentiment. The total possible score overall or in any given category is 100. | ||||||||||||||||||
Filters bar | The Filters bar appears at the top of most of the pages in Experience. Each section in the Filters bar allows a user to quickly and easily filter based on different categories. When a filter is set it applies to all the tiles on the page. On the Stability, Responsiveness, Performance and Sentiment pages there is also a Break Down By selector that reconfigures the charts to show the data divided up into the selected category. On the Overview, Categories, Devices, and Software pages there is no option for Break Down By. On the Users and Surveys pages the Filters bar is not available. | ||||||||||||||||||
Grading | Experience scores are divided into one of five gradings.
| ||||||||||||||||||
Location | Tachyon Explorer allows you to use Location when defining coverage for an instruction. For example, you can choose to target an instruction to be sent only to devices whose location has been set. | ||||||||||||||||||
Metrics | Metrics are the datasets that are collected by the 1E Client and sent up the Tachyon server daily. Metrics are either Raw or Aggregate. Raw metrics have a scoring algorithm applied to them to derive a score. | ||||||||||||||||||
Management Groups | Management Groups page Management Groups are containers used to group devices and the software installed on those devices. Management Groups are defined using configurable rules that look at various properties of the devices and their installed software, these are then evaluated to determine the group membership. This means that Management Group membership adapts to changes to the devices and software in your environment. 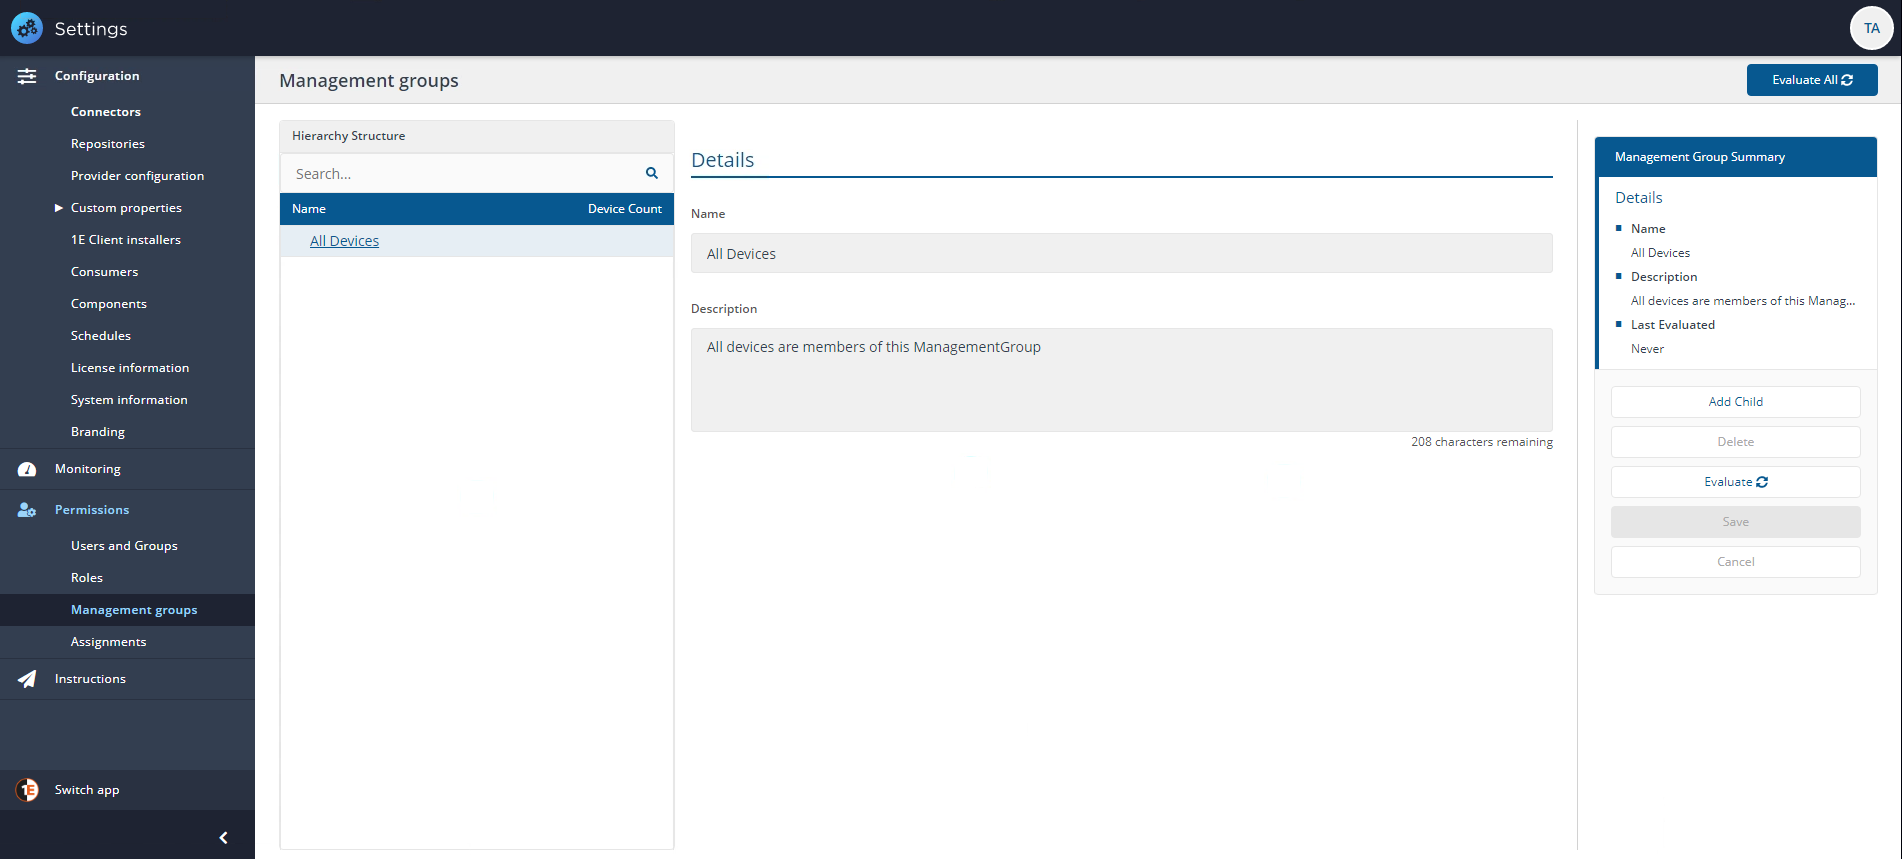 | ||||||||||||||||||
Overview page | The Overview page is the starting place for any Tachyon Experience journey. Here you can get immediate answers to how your enterprise is performing from an end-user perspective and you can drill-down to get details on specific problem areas and find routes to immediate resolutions. Your key indicator is the Experience - Latest Score chart, which gives your enterprise a score out of 100 based on a combination of measured events and user surveys. The closer you are to 100 the better the IT experience your end-users are having. The Experience - Latest Grading chart provides a breakdown of the experience score showing how many devices and users fall into each of the five experience grades - ranging from Very Good to Very Poor. This helps interpret the experience score and see how it maps onto end-user experiences. The Experience - What's Changed (last 7 days) chart provides an overview of the significant changes, good or bad, that have occurred during the past week. Finally you can use the Experience - Trend chart to check how well your enterprise is performing over time in terms of how your end-users see it. You could use this chart to help gauge progress on any improvement programs you might have put in place or act as an advanced warning that there are underlying issues that are affecting your end-users and need resolving. | ||||||||||||||||||
Performance page | The performance score is derived by measuring the performance of the device using the Windows Performance Counters. These counters measure many data points on the device including CPU usage, disk usage, memory usage, and processes. The page allows you to drill into the Latest Score tile to see the different metrics that are collected. For information on the makeup of the score see Performance Score | ||||||||||||||||||
Performance Score | The Performance score is derived from the scores of disk performance, CPU performance, and memory performance. | ||||||||||||||||||
Responsiveness page | The responsiveness score is derived by measuring how well Windows application perform during our "Synthetic micro-transactions". The successful and timely operation of Windows and Windows applications is key to a positive user experience on that device. The page allows you to drill into the Latest Score tile to see the different metrics that are collected. For information on the makeup of the score see Responsiveness Score | ||||||||||||||||||
Responsiveness Score | The Responsiveness score is derived from the scores of Windows internals, system startup, and Windows UI. | ||||||||||||||||||
Scores | The Experience Score is an overall number that represents the user experience of a given device. It is a total of weighted scores in the four categories - Performance, Stability, Responsiveness, and User Sentiment. The total possible score overall or in any given category is 100. | ||||||||||||||||||
Software page | The Software page provides a tabular listing of all the Software products that are installed in the environment (including executable, version, architecture). The second set of columns in the list provide additional metrics or event details associated with the Software products. | ||||||||||||||||||
Stability page | The stability score is derived by measuring the "crashiness" of applications and the operating system of a device. The different types of crashes have a differing impact on the score, based on the amount of impact on the end-user. An application crash is annoying but the crash of the entire operating system could cause data loss so has more weight on the score. The page allows you to drill into the tiles to see the different metrics that are collected. For information on the makeup of the score see Stability Score | ||||||||||||||||||
Stability Score | The Stability score is derived from four scores based on the number of crashes and hangs for software and for the Operating System itself. | ||||||||||||||||||
Tile buttons | The Stability, Responsiveness, Performance, and User Experience pages all have a set of tiles that allow navigation or a change of view. |