Investigating Devices
Investigating devices that have connected to Tachyon using the 1E Client.
Overview
You can use the Devices section to browse a predetermined set of information for all the devices that are known to Tachyon, that is the devices that are currently connected to Tachyon or have connected in the past. This is in addition to the ability to explore devices using instructions to get back a range of information that is only limited by the instructions you have available to you.
The Devices section can be viewed by users assigned to any role that has permissions on any instruction set. This includes custom roles and the following system roles:
All Instructions Actioner
Full Administrator
All Instructions Approver
All Instructions Questioner
Viewer
There are two options for directly investigating the devices known to Tachyon: The Devices Table and The Devices Dashboard.
The Devices Table
Explorer lets you view details for devices on your network, including real-time visibility of which devices are currently connected (online) and can therefore be interacted with directly.
Device details are stored in the TachyonMaster database and not in the inventory repositories. They are updated each time a client connects to a Switch.
Please refer to Introducing Inventory for details of inventory repositories.
Tip
1E Explorer TachyonAgent product pack contains Instructions that help with device connectivity and configuration.
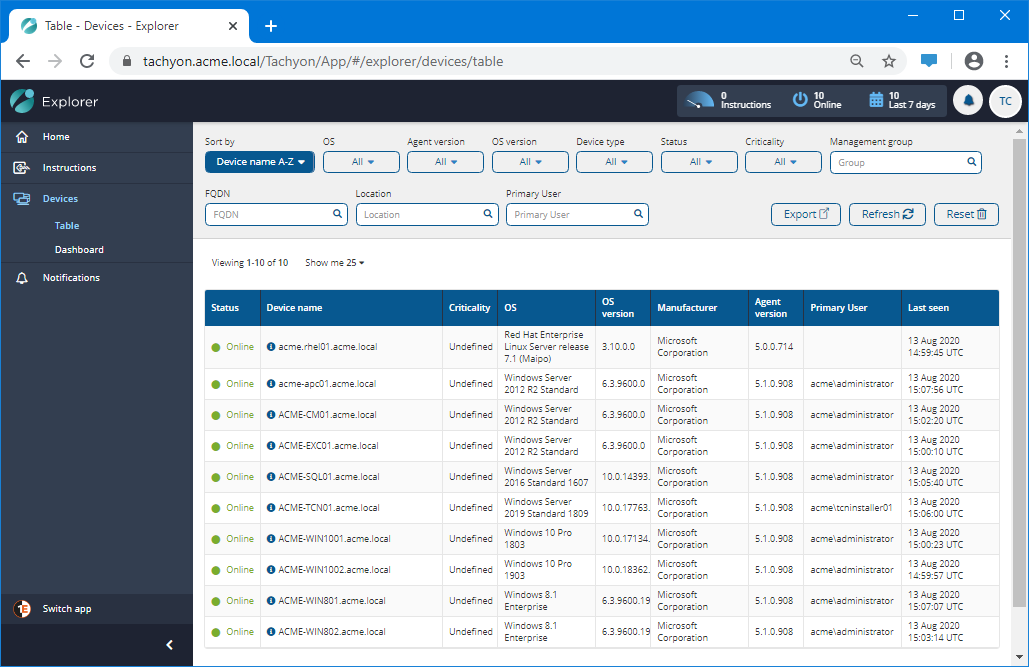
The Devices table
The picture shows the devices that have connected to our example Tachyon system. They are all shown as currently online.
Each time you view or change the page, the table is refreshed. You can also click the Refresh button while viewing the table.
The Devices table
Property | Description |
|---|---|
Status | Indicates the status of the device:
|
Device name | The Fully Qualified Domain Name (FQDN) of the device, as presented by the device to the Switch. If the FQDN of a device changes then it will be updated in the TachyonMaster database, it does not create a duplicate entry. Each device is uniquely identified by a GUID which is not visible in any screens. You can view additional properties for a device by clicking on the information |
Criticality | The criticality of the device as determined by your organization. Please refer to Using Device Criticality. |
OS | The Operating System name. |
OS version | The Operating System version. |
Manufacturer | The manufacturer of the device as it appears in the device BIOS. The name is not normalized. |
Agent version | The version of the Tachyonagent. |
Primary User | The Primary User that the Tachyon agent has determined is most clearly related to the device. |
Last seen | The date and time when the device last reported a Keep Alive to the Switch, which is at least every 15 minutes by default, as defined in 1E Client - ConnectionKeepaliveTimeInSecondsMax. |
Sorting the table
Click on the Sort by button and select one of the following properties, to sort the Devices table.
Property | Description | |||||||
|---|---|---|---|---|---|---|---|---|
Device name | Sorts on the device name in A-Z or Z-A order. | |||||||
OS | Sorts on the OS name in A-Z or Z-A order. | |||||||
Agent version | Sorts by the version number of the Tachyon client in ascending or descending order. | |||||||
OS version | Sorts on the OS version number in ascending or descending order. | |||||||
Criticality | Sorts on the device Criticality, ascending or descending according to the following order:
|
Filtering the table
You can filter rows of the table using the following properties. A button turns blue if it is being used. You can click on the Reset button to delete all the filters.
Property | Description | |||||||
|---|---|---|---|---|---|---|---|---|
OS | A drop-down list let's you filter on one of the following:
| |||||||
Agent version | This drop-down lets you filter on the version number of the Tachyon client using a numeric condition, as described under the heading Numeric conditions. | |||||||
OS version | This drop-down lets you filter on the OS version number using a numeric condition, as described under the heading Numeric conditions. | |||||||
Device type | This drop-down lets you filter on one of the following device types:
| |||||||
Status | This drop-down lets you filter according to whether the device is currently Online or Offline. | |||||||
Criticality | This drop-down lets you filter according to the Criticality set for the device. For more detail about this feature, please refer to Using Device Criticality.
| |||||||
Management group | This entry field lets you filter according to a Management group that devices belong to. A list of Management groups is displayed when you click in the entry field, or you can type a name to filter the list as you type. | |||||||
FQDN | This entry field lets you enter all or part of the Fully Qualified Domain Name for devices, and dynamically refreshes the table as you type. | |||||||
Location | This entry field lets you filter on the location set for the devices, and dynamically refreshes the table as you type. | |||||||
Primary User | This entry field lets you filter on the Primary User that the 1E Client has determined is most clearly related to the device, and dynamically refreshes the table as you type. |
Numeric conditions
Condition | Description |
|---|---|
Equals | Checks if the property is equal to the value you supply. |
Greater | Checks if the property is greater than the value you supply. |
Less | Checks if the property is less than the value you supply. |
Range | Checks if the property lies between the upper and lower bounds you supply. |
Exporting the table
You can export the devices data to a .csv file, as described in Exporting data from Explorer.
The Device View Overview tab
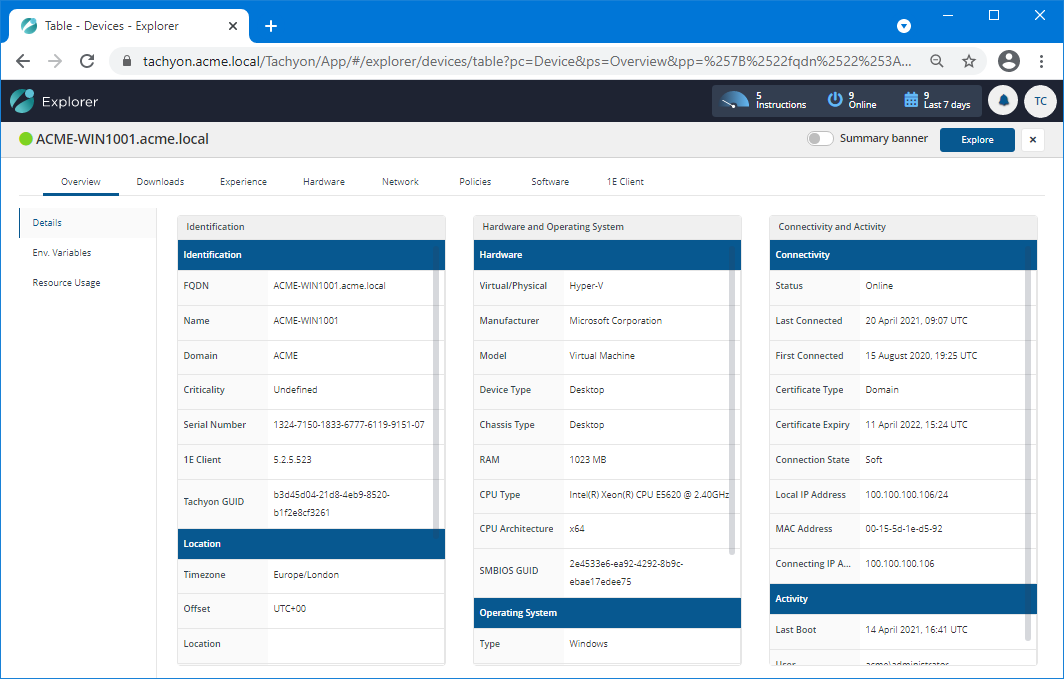
Clicking on the information  icon next to the device name in the Device Name column of the Devices Table page displays the Device view for the selected device. The aim of the Device view is to provide a combined overview of all the information known about a device, along with the ability to retrieve information about the device in real-time. When displaying the Device view from the Explorer Devices Table page, the view defaults to the Overview tab. This tab contains the following panels.
The Details panel
This panel displays the basic details for the device. This is contained in a number of tiles, as described in the following table.
Note
If you upgrade macOS to a new major version (For example, 11 to 12) then the O/S install date will change. However, if the upgrade is a minor version, such as 12.2 to 12.3 then the install date remains the same as the original major upgrade.
Tile | Description | ||||||||||||||||||||||||||||||||||
|---|---|---|---|---|---|---|---|---|---|---|---|---|---|---|---|---|---|---|---|---|---|---|---|---|---|---|---|---|---|---|---|---|---|---|---|
This table provides information on how the device has been tagged and grouped from a Tachyonperspective.
| |||||||||||||||||||||||||||||||||||
Hardware and Operating System | This table provides information on the device's hardware.
This table provides information on the device's Operating System.
| ||||||||||||||||||||||||||||||||||
Connectivity and Activity | This table provides information on the device's current connection status with Tachyon.
This table provides information on the device's current activity status.
|
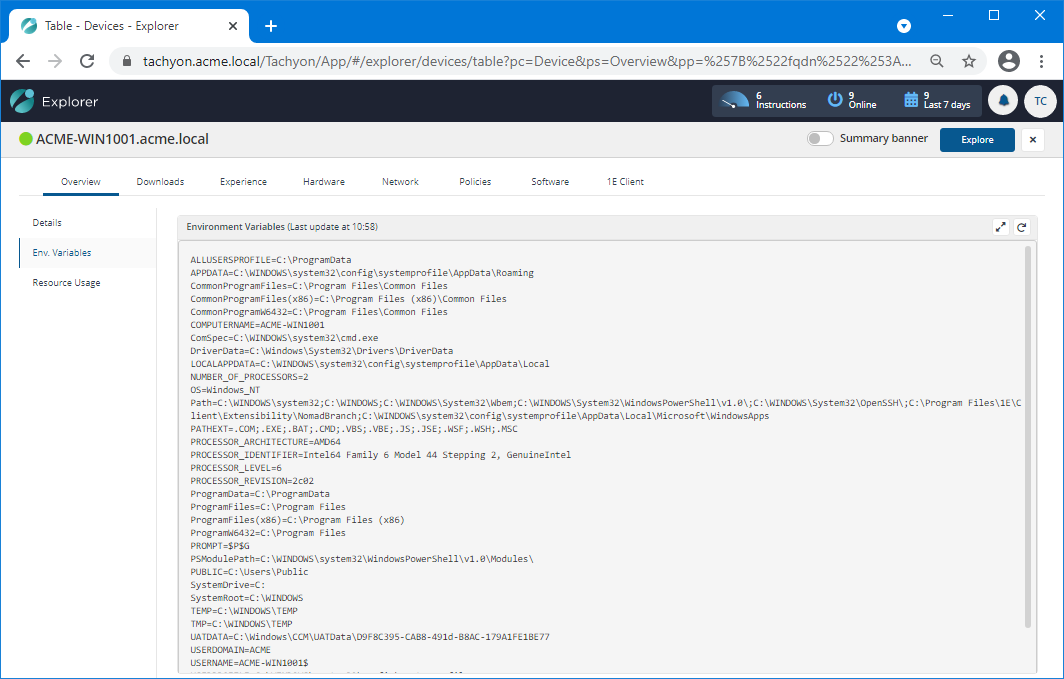
The Env. Variables panel
Displays the list of environment variables set on the device. This information is updated each time the page is refreshed.
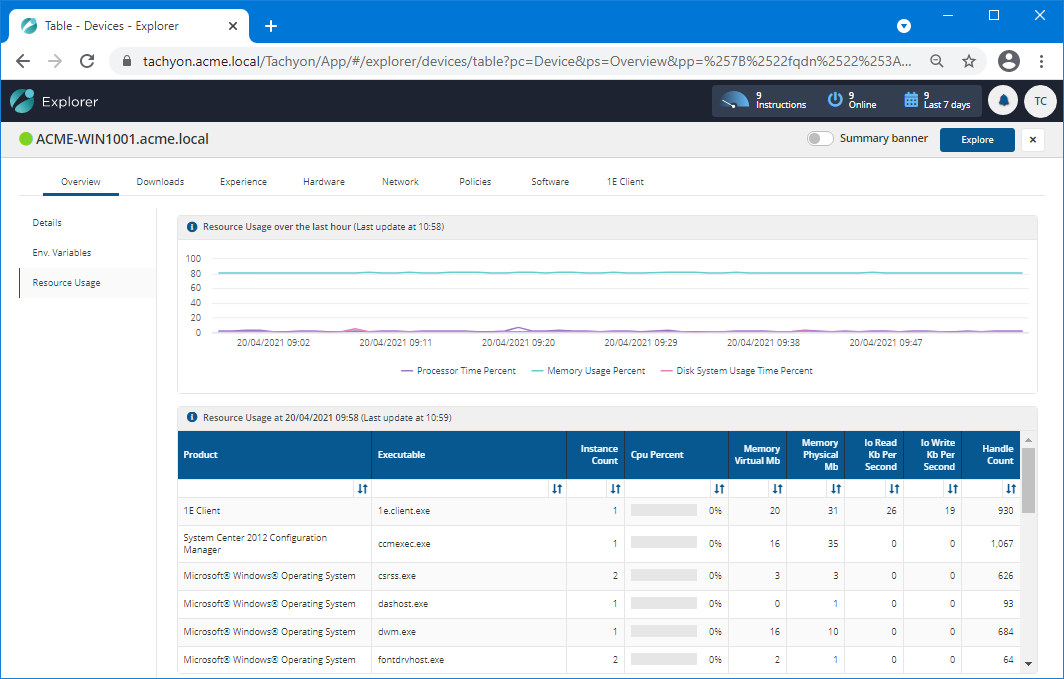
The Resource Usage panel
This panel displays the recent resource usage for the device.
Tile | Description | ||||||||||||||||||||
|---|---|---|---|---|---|---|---|---|---|---|---|---|---|---|---|---|---|---|---|---|---|
This tile displays a line graph showing the percentage of resource usage over time during the last hour. Selecting a point on the graph selects the data displayed in the Resource Usage at date and time tile. This can be useful if there is an outlying data point where you want to investigate the breakdown according to the products on the device. The three lines displayed show the Processor Time Percent, the Memory Usage Percent and the Disk System Usage Time Percent. You can toggle the display of these lines by clicking on the legend name at the bottom of the graph. | |||||||||||||||||||||
This tile displays the product resource usage. Click on a point on the Resource Usage over the last hour tile to show the product resource usage at that particular time. The table shows the following data:
|
The Device View Summary banner
The Summary banner displays a quick summary of the information provided in the various tabs displayed in the Device View. It can be viewed by toggling the Summary banner switch to on.
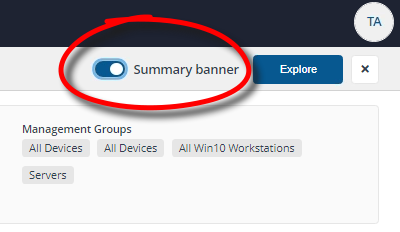
The following image shows the Summary banner displayed for a particular device.

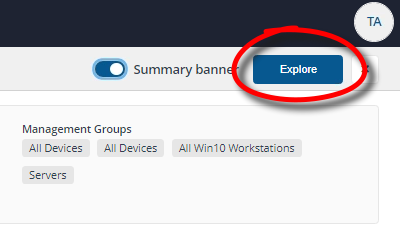
Launching the Explorer from the Device View
You can click on the Explore button in the Device View to launch Explorer with the current device set as the scope.
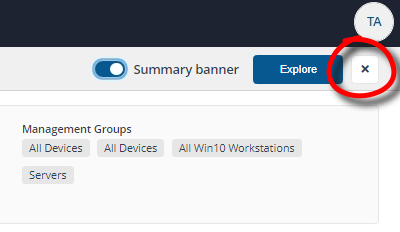
Closing the Device View
The Device View is a popup that is displayed when clicking on the name of a device on a page where devices are displayed. To return to the page you came from you need to click the x button.
Additional Device View tabs
In addition to the Overview tab, there are a number of other tabs, each corresponding to an app, feature or data set implemented in Introducing Tachyon:
The Overview and 1E Client tabs are always present in the Device View. Other tabs are visible if an app has been installed and is licensed.
Each tab has one or more panels with tiles populated with data from various sources, some by instructions that are run instantly, with results cached for 3 minutes. An appropriate error message is displayed instead of a tile in the following circumstances:
If the device is offline, as indicated by the color of the icon in the top left
The user does not have at least Viewer permission to view use the license the tab or panel
The user does not have questioner permission to run the instruction
An instruction has not been uploaded.
The Device View tabs and panels page lists the names of tabs and their panels, and a description of each tile indicating how the tile is populated.
The Device View tabs and panels
Tab | Panel | Description | Data source | |||||||||||||||||||||||||||||||
|---|---|---|---|---|---|---|---|---|---|---|---|---|---|---|---|---|---|---|---|---|---|---|---|---|---|---|---|---|---|---|---|---|---|---|
Displays a number of tiles sorted into Identification, Hardware and Operating System and Connectivity and Activity columns that show information for the selected device retrieved from the online status information stored in the TachyonMaster database. The columns and tiles are shown in the following table:
| Data from Tachyon Master (the latest online status message) | |||||||||||||||||||||||||||||||||
Shows a list of the environment variables set on the device. | ||||||||||||||||||||||||||||||||||
Two panels:
| ||||||||||||||||||||||||||||||||||
Download activity and status for the device. Whenever you click on an FQDN on any of the Nomad pages then the Device View will be displayed with the Downloads tab selected. | Data from Nomad. | |||||||||||||||||||||||||||||||||
Content Titles on the selected device, the default view is from All Sources, All Types and All Status. NoteYou may see a difference in the number of items in a device’s Nomad cache versus that displayed in the Nomad app Device View. This is because if downloaded content has been deleted from Configuration Manager, the content titles cannot be resolved in the Nomad app and are not displayed. This is under consideration for re-design and may be revised in future versions of Nomad. | Data from Nomad. | |||||||||||||||||||||||||||||||||
1E Nomad Branch Settings . | ||||||||||||||||||||||||||||||||||
Metrics are the data points that are collected by the 1E Client and sent to the Tachyon server. They are collected at different intervals depending on the type of data that is being collected. | Data from Experience metrics | |||||||||||||||||||||||||||||||||
The Trends tab shows the changes in the scores over time. Hovering over any of the bars shows the details for that time and event. If the user viewing the device details also has the ability to at least ask a question in Explorer the Explore button will be visible. | Data from Experience metrics | |||||||||||||||||||||||||||||||||
The Event Logs tab gives you a listing of the Windows Event log entries for that device. This brings that data to this view and is very useful when determining the root cause of an issue that has been reported on the device. | Data from Experience metrics | |||||||||||||||||||||||||||||||||
Shows user interaction times and ratios across applications measured over the last 30 days | ||||||||||||||||||||||||||||||||||
Shows user interactive sessions with activity over last 30 days. | ||||||||||||||||||||||||||||||||||
Shows disk drives, including hardware and usage information.
| ||||||||||||||||||||||||||||||||||
Shows the list of plug and play hardware devices (Windows only).
| ||||||||||||||||||||||||||||||||||
Shows network throughput on all adapters for the last hour, represented by the following tiles:
| ||||||||||||||||||||||||||||||||||
Returns the output from the native network interface configuration command (e.g. ipconfig or ifconfig). | ||||||||||||||||||||||||||||||||||
Shows the Cache and Host file tiles:
| ||||||||||||||||||||||||||||||||||
Returns a list of established TCP connections.
| ||||||||||||||||||||||||||||||||||
Returns a list of processes which are listening for network connections.
| ||||||||||||||||||||||||||||||||||
Returns a list of processes which are listening for network connections and also shows routing tables. | ||||||||||||||||||||||||||||||||||
Shows a list of visible wifi networks, including basic network properties.
| ||||||||||||||||||||||||||||||||||
| Data from Guaranteed State | |||||||||||||||||||||||||||||||||
Shows (per-device) installed software.
| ||||||||||||||||||||||||||||||||||
Shows list of installed Windows services and their current state.
| ||||||||||||||||||||||||||||||||||
Shows operating system environment variables. | ||||||||||||||||||||||||||||||||||
Shows detailed information about all running processes.
| ||||||||||||||||||||||||||||||||||
Shows a list of the binary files in the executable folder of the 1E Client.
| ||||||||||||||||||||||||||||||||||
Shows the full content of the 1E Client configuration file, including:
| ||||||||||||||||||||||||||||||||||
Shows extensibility objects (modules and providers) loaded by the 1E Client.
| ||||||||||||||||||||||||||||||||||
Shows Data Files and Client Inventory Database Use tiles that display the list of:
|
The Devices Dashboard
Explorer lets you view details for devices on your network including real-time visibility of which devices are currently connected (online) and can therefore be interacted with directly.
Device details are stored in the TachyonMaster database and not in the inventory repositories. They are updated each time a client connects to a Switch.
Please refer to Introducing Inventory for details of inventory repositories.
Tip
1E Explorer TachyonAgent product pack contains Instructions that help with device connectivity and configuration.
The Devices dashboard
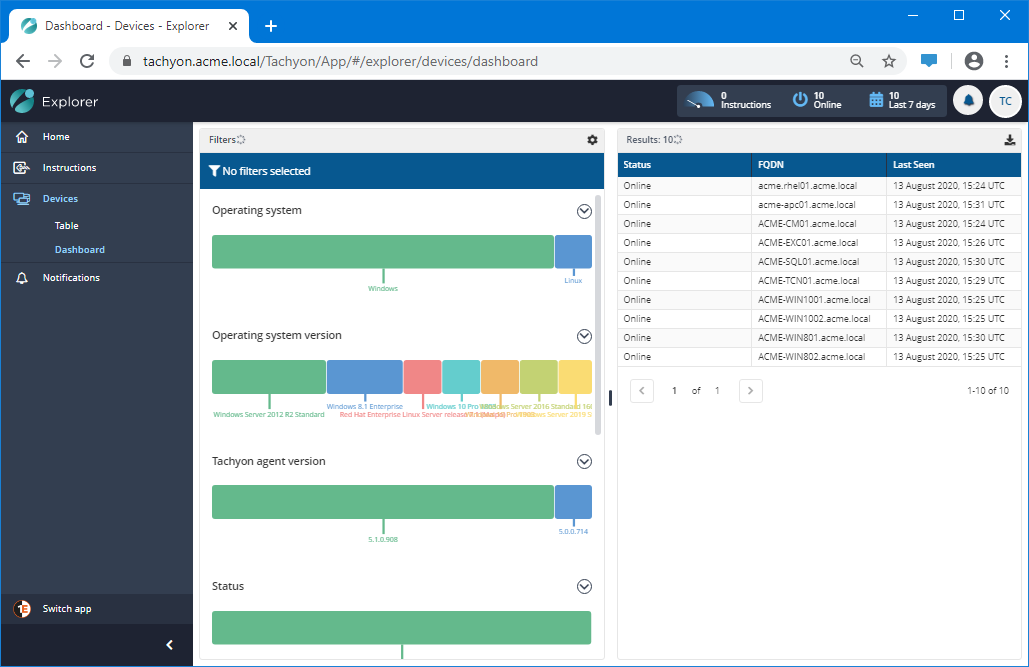
The devices dashboard provides a view of the devices that have contacted Tachyon.
There are two panes in the dashboard:
The left-hand pane displays a list of filters that appear as charts
The right-hand pane displays a list of devices that correspond to the currently selected filter, you can click on a row in the table to see the Device View for the device.
For more information on using the Devices dashboard please see Using the Devices dashboard - Tutorial.
The available filters are:
Filter | Description |
|---|---|
Operating system | Partitions the 1E Client devices according to the OS running on the devices. |
Operating system version | Partitions the 1E Client devices according to the OS version running on the devices. |
Tachyon agent version | Partitions the 1E Client devices according to the version of the 1E Client running on the devices. |
Status | Partitions the 1E Client devices according to the current connection status of the devices. |
Device type | Partitions the 1E Client devices according to the type of the devices. |
Timezone | Partitions the 1E Client devices according to the time zone the devices are configured with. |
Location | Partitions the 1E Client devices according to their location. |
The available charts are:
Chart | Description |
|---|---|
SmartBar | Displays a single horizontal bar where the distinct values in the data are represented by different colors. The individual colored blocks can be clicked on to select the corresponding devices that have that value. |
Pie | Displays a pie chart where the distinct values in the data are represented by different colors. The wedges can be clicked on to select the corresponding devices that have that value. |
Column | Displays a column for each distinct value in the data. Each column can be clicked on to select the corresponding devices that have that value. |
Bar | Displays a horizontal bar for each distinct value in the data. Each bar can be clicked on to select the corresponding devices that have that value. |