Monitoring Nomad
The Nomad app provides visibility of content distribution activity and cache status for content distributed by both Nomad and Delivery Optimization. This includes Configuration Manager content distributed with Nomad and Software Updates content distributed with either Nomad or Delivery Optimization.
Explaining content versions
In Configuration Manager (CM), the content associated with a Package or Application Deployment Type may be updated by an administrator. In the case of Packages, CM increases the Package Version property, and for Application Deployment Types, CM generates a new Content ID for the Deployment Type.
The Nomad Overview page displays summarized distribution data for a selected period. The displayed data shows all downloads and download activity for all versions of content for that period. For example, if a device downloaded Package A version 1 a month ago and later downloaded version 2 of the same Package, the Overview page would reflect both downloads.
In this version it has not been possible to reflect previous versions in the Content Titles summary in the top status bar, or in the Content Titles Count by Content Type and Download Volume by Content Type tiles. These will only represent download activity for the latest version of content. This may result in apparent 'loss' of data (e.g. a reduction in the number of content titles or download volume) when content for an existing Package or Application is updated in CM, as these metrics will only include download activity for the latest version. This will be addressed in a later version of Nomad.
Note
Other pages in the app, such as the Content page, only show the latest version of any given Content Title. Those pages concern the current state of things (e.g. where content is available) because only the latest version is usable by CM deployments. As a result, showing older versions would be misleading for users.
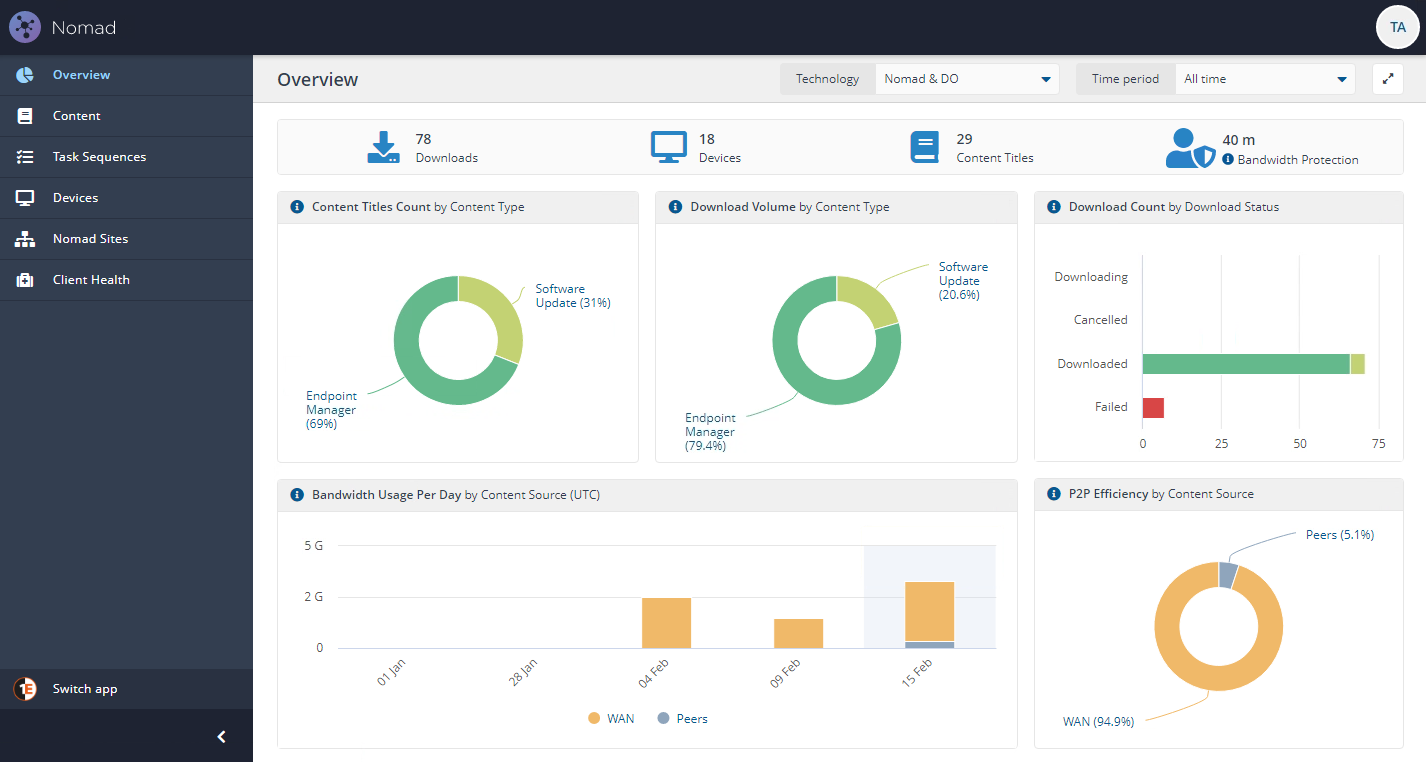
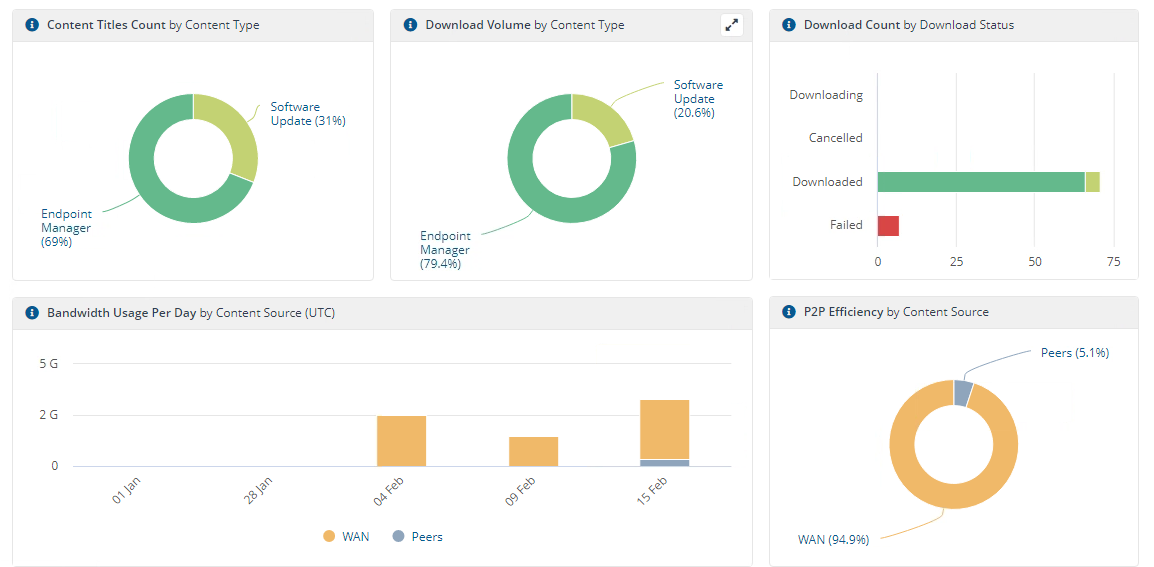
The Overview page gives a brief snapshot of download activity. The page has multiple tiles showing:
Content Titles by Content type
Download Volume by Content Type
Download Count by Download Status
Bandwidth Usage Per Day by Content Source (UTC)
P2P Efficiency by Content Source (Peer to Peer - P2P).
The results can further be narrowed down by using the Technology and Time period filters on the page.
Navigation and Filtering
By default, the view shows activity and status for all time and will show activity and status for both Nomad and Delivery Optimization. These defaults can be modified using the Technology filter and the Time period filter.
Note
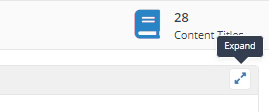
Each content tile can be expanded using the Expand button on the top right-hand corner of each tile.
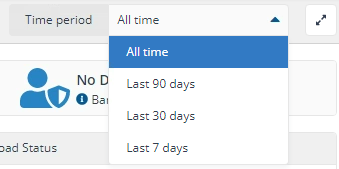
Time period filter
Using the Time periodfilter at the top of the page, you can narrow down the results by date. You can choose from the following options:
Last 90 days
Last 30 days (Default)
Last 7 days.
Note
If these filters are applied to any app page, it is reflected on all other pages in the Nomad App.
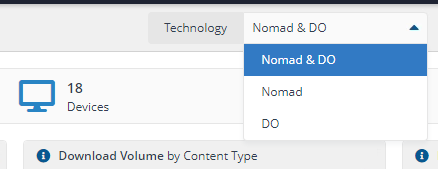
Technology filter
You can use the Technology filter to differentiate between downloads through Nomad or Delivery Optimization (DO).
The following options are available:
Nomad & DO (Default)
Nomad
DO.
Note
If this filter is applied to any app page, it is reflected on all other pages in the Nomad App.
Top status bar
The status bar along the top of the page shows high-level statistics for the currently selected Technology (Nomad or DO) and Time period. The bar is shown on the Overview page and includes four icons, Downloads, Devices, Content Titles and Bandwidth Protection.

Item | Description | Icon |
|---|---|---|
Downloads | Downloads reflect the total number of content downloads. This includes both Delivery Optimization (DO) and Nomad downloads. The results can be filtered on the Time period and Technology filters and display the total number of downloads of any version of content that occurred in the selected period. A download counts as any download activity for a given Content Title on a given device. For example, if there are 10 content titles downloaded by 50 devices, the total count of download instances would be 500. For CM Applications, each Application Deployment Type counts as a separate Content Title. Clicking on this icon navigates to the Content page filtered to show Content Titles reporting download activity within the selected Time period. |  |
Devices | Displays the total number of devices that have reported download activity for any content version in the selected Time period, including:
Clicking this icon navigates to the Devices view, filtered to show devices where download activity was reported within the selected Time period. |  |
Content Titles | Displays the total number of unique Content Titles where download activity of the latest version of the content titleis reportedin the selectedTime period. For CM content, aContent Titleis a single Application or Package. Clicking on this icon navigates to the Content view filtered to show the Content Titles that have reported download activity within the selectedTime period. NoteApplications in CM may have many Deployment Types. This summary counts an Application as a single Content Title.When viewing the Content view, Content Titles for CM Applications are further identified with the Deployment Type thatwas downloaded. So, the total number of Content Titles identified on the top status bar may be lower than the corresponding list of Content Titles on the Content page. This is because the Content page reports download activity for individual Deployment Types of CM Applications. |  |
Bandwidth Protection | Displays the total time that Nomad backed off when downloading content to protect end-user bandwidth. Bandwidth Protection allows Nomad to adjust the speed of ongoing downloads to save bandwidth for other business use. Bandwidth Protection ensures Nomad doesn't consume excess bandwidth and hinder other business activity.It does that by tracking the download time of data packets. If the time increases, it slows itself down (backing off) by sleeping for a few moments before downloading another packet. |  |
Content tiles
Content tiles display statistics for content download activity in the following panes:
Content Titles Count by Content Type
Download Volume by Content Type
Download Count by Download Status
P2P Efficiency by Content Source
Bandwidth Usage Per Day by Content Source UTC.
Note
Each content tile can be expanded using the Expand button on the top right-hand corner of each tile.
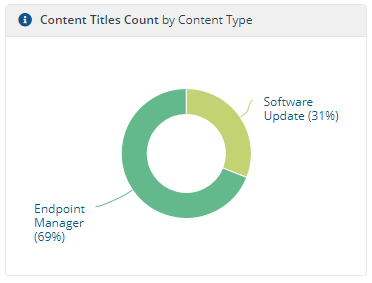
Content Titles Count by Content Type
The Content Title Count by Content Type tile shows the total number of unique Content Titles for where there is download activity reported for the latest version of the content within the selected Time period.
The data is grouped by Content Type and displayed as a donut chart. The app currently reports on two Content Types:
Endpoint Manager - CM applications and packages that are not delivered by DO
Software Update - includes any Microsoft Software Updates deployed through CM or Windows Update.
Note
Applications in CM may have multiple Deployment Types. This tile counts an Application as a single Content Title. When viewing the Content view, Content Titles for CM Applications are further identified with the Deployment Type that was downloaded.
As a result, the total number of Content Titles identified on the top status bar may be lower than the corresponding list of Content Titles on the Content page (which reports download activity for individual Deployment Types of CM Applications).
Hovering over a Content Type segment of the chart displays the count of Content Titles of that type, also represented as a percentage of all Content Titles.
Clicking on a Content Type segment of the chart will navigate to the Content view, filtered to show related Content Titles.
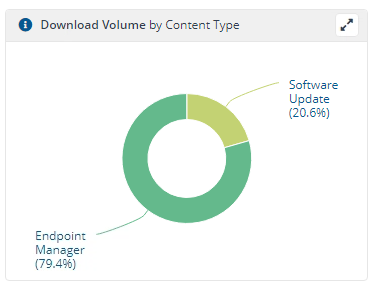
Download Volume by Content Type
The Download Volume by Content Type tile shows the cumulative volume of content of the latest version of content downloaded by all devices within the selected Time period. The data is grouped by Content Type and displayed as a donut chart.
The chart enables you to see the effect that different types of content have on your network, in terms of the volume of data associated with them. It shows the percentage of packages and software updates by volume for:
Endpoint Manager - CM applications and packages that are not delivered by DO
Software Update - content that can be delivered by Nomad, or DO if you're using Windows Update directly.
For example, if a single content title is 100MB and it is downloaded by 100 devices, the cumulative Download Volume reported for that particular Content Title would be 10,000MB. The chart shows the cumulative volume for all Content Titles on all devices, grouped by Content Type.
Hovering over a Content Type segment of the chart displays the total volume of downloaded content of that type. This is also shown as a percentage of total volume of downloaded content.
Clicking on a Content Type segment of the chart navigates to the Content view, filtered to show Content Titles of the selected segment.
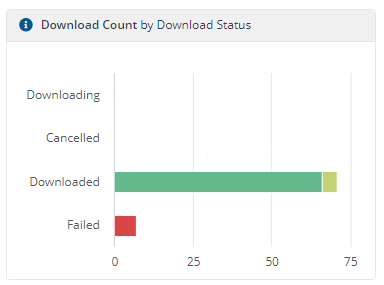
Download Count by Download Status
The Download Count by Download Status tile shows the status of download activity within the selected Time period, displayed as a bar chart by:
Status | Description |
|---|---|
Downloading | Number of downloads currently in progress, where a download has been reported as started but has not yet reported complete, failed or cancelled. |
Cancelled | Number of downloads whose last reported status was Cancelled, downloads may be cancelled by the user, or by the system, for example if the system is shut down or higher priority downloads are queued. |
Downloaded | Number of successful downloads, if the downloaded content is still cached on a given device, it’s represented by the dark green part of the Downloaded bar labelled (Downloaded (Cached) when you hover over it. If the downloaded content was subsequently deleted from the cache on a given device, it’s represented in the light green part of the Downloaded bar labelled (Downloaded (Deleted) when you hover over it. |
Failed | Number of downloads whose last reported status was Failed. |
Hovering over any of the bars displays the number of downloads in the selected download state.
Clicking on any of the bars navigates to the Content view, filtered to include Content Titles where one or more devices is in the selected download state.
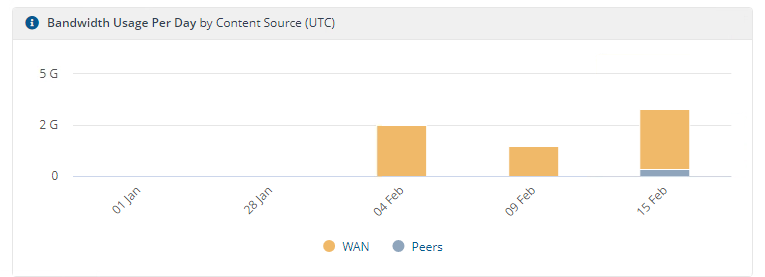
Bandwidth Usage Per Day by Content Source (UTC)
The Bandwidth Usage Per Day by Content Source (UTC) tile represents daily download activity throughout the entire network during the selected Time period.
A column is displayed for each day when there was download activity. Each column indicates the volume of content downloaded over the WAN (in orange) or from peers (in grey). Hovering over a segment of the column will display the volume of content downloaded on that day.
This view demonstrates the value that Nomad and Delivery Optimization are providing through reduced WAN traffic. If the majority of content is being downloaded over the WAN, it could indicate that peers are simply not available (e.g. users working from home) or it could be an indication that Nomad or Delivery Optimization are not correctly configured to optimize content from peers.
The columns on this chart are not clickable, they are for data visualization only and do not navigate to another view of the data.
Tip
On the Overview page, when you select the All Time filter, the Bandwidth Usage Per Day by Content Source (UTC) graph displays a maximum 365 days of data.
Note
This chart only displays content that was downloaded over the network either from a peer or from the source (e.g. a CM Distribution Point), if a device:
Requests content that is already in its cache, it will not be represented in this chart
Only has some content in its cache and downloads the remainder of the content from peers or the source, the content that was downloaded will be shown.
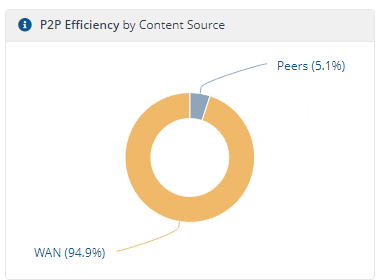
P2P Efficiency by Content Source
The P2P Efficiency by Content Source tile represents the overall peer-to-peer efficiency across the entire network during the selected Time period.
The data is grouped by source (Peers and WAN) and displayed as a donut chart showing the volume of content downloaded from peers (in grey) and from the source over the WAN (in orange). This gives an indication of the overall value of Nomad and Delivery Optimization across your organization.
Ideally, more content will be downloaded from peers than from the source over the WAN, which saves network bandwidth. Where this is not the case, it could be due to many users working remotely without any local peers, or it could be due to configuration settings on the client that are not optimized for peer-to-peer caching and availability.
This chart is not clickable, it is summary data visualization only and does not navigate to another view of the data.
Note
In this chart, the volume of content downloaded from peers includes any content requested by a device during the selected Time period and was already in the cache at the time (i.e. 'already cached' is represented as content obtained from a peer). If the content was downloaded from a peer or over the WAN during the selected Time period, it will be represented accordingly.