Patch Success Overview page
The overview page shows a dashboard with three charts and a pivot table, that are dynamically recalculated based on applied filters.
Without filters the dashboard shows the status of all devices in the selected inventory repository and all patches affecting them. When filters are added, the dashboard is recalculated according to the applied filtered. For an explanation of filters, please refer to Title and filter bars.
The totals on the title bar are not affected by filters. For more details about the title bar please refer to Title and filter bars.
Dashboard charts
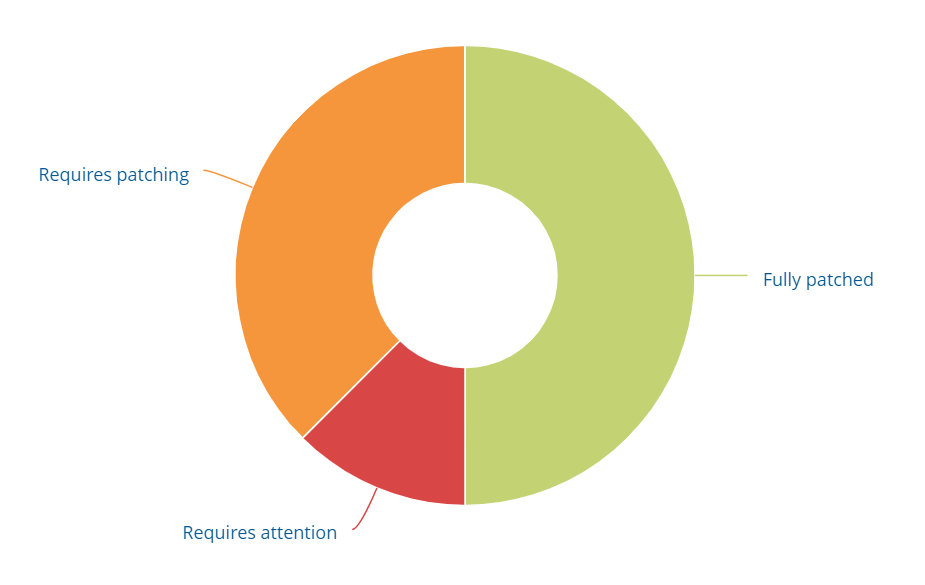
Patch status per device
Shows the overall patch status, after applying filters, by organizing devices into the following states ordered by priority:
Requires attention: some required patches failed to install
Requires patching: some required patches are missing
Requires rebooting: some applied patches are pending a reboot
Fully patched: all required patches have been applied successfully
Selecting a chart slice or label will apply a Patch status filter to the whole dashboard, but not to the title bar. For details of this and other filter types please refer to Title and filter bars: Filter types.
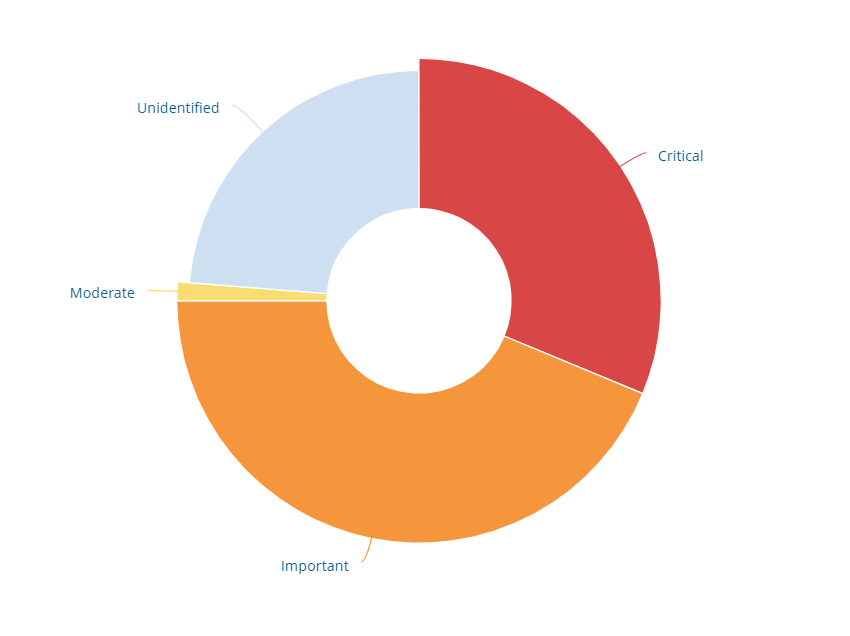
Security updates by severity level
Shows the security update spread, after applying filters, by organizing the security updates into their Microsoft security bulletin severities:
Critical
Important
Moderate
Low
Unidentified: no assigned severity.
Selecting a chart slice or label will apply a Severity filter to the whole dashboard, but not to the title bar. For details of this and other filter types please refer to Title and filter bars: Filter types.
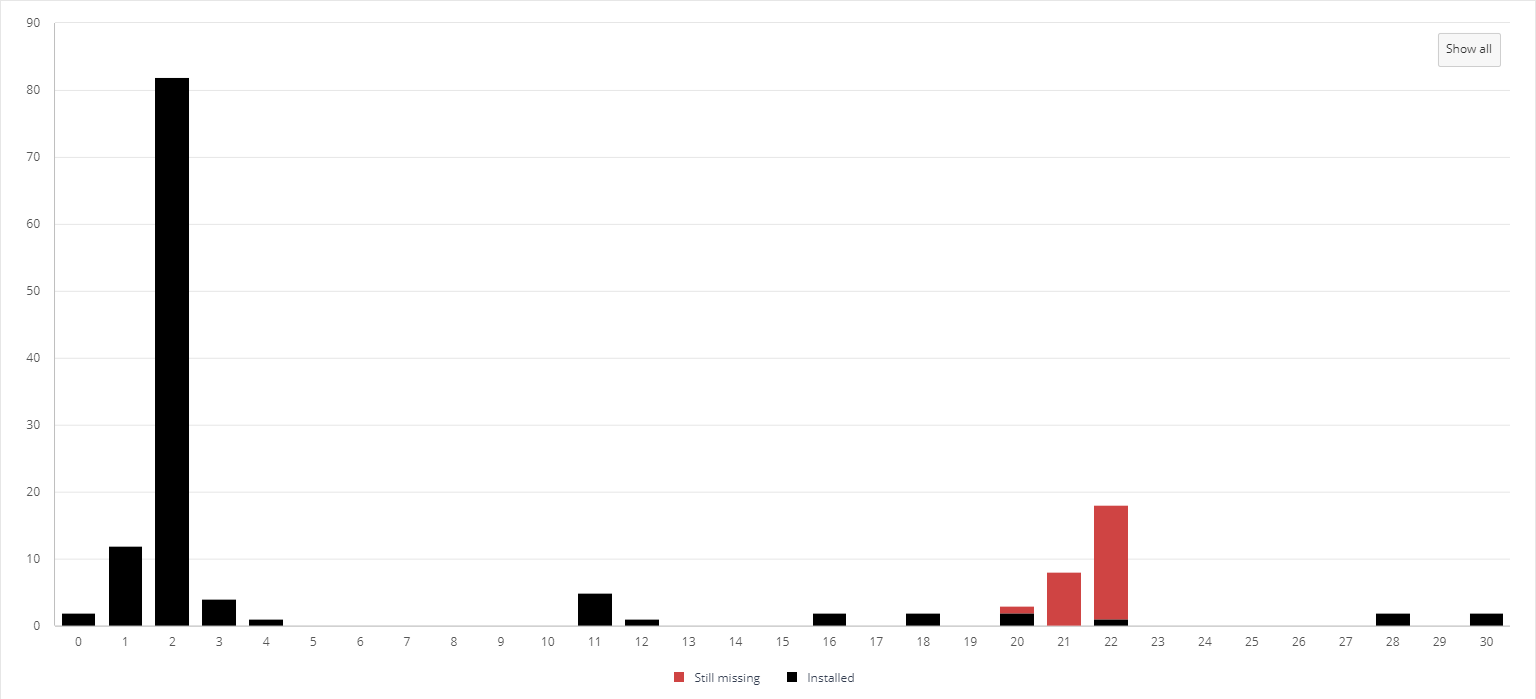
Patch performance
Shows the number of updates installed per day. The black column shows the days elapsed between the patch installation date and the publish date or the device’s OS installation date (whichever is more recent). It also shows, as a red column, the required number of patches that are missing.
You can zoom in and out to highlight details of patches across time.
Selecting a chart bar or label will apply a Time taken to install range filter to the whole dashboard, but not to the title bar. For details of this and other filter types please refer to Title and filter bars: Filter types.
Interacting with the charts
You can click on chart slices and labels to add filters. Clicking on a slice or label once adds its filter, and clicking on it again removes its filter. Clicking with the CTRL key down allows you to add and remove multiple filters. For range charts clicking with the SHIFT key down allows you to select a range of filters.
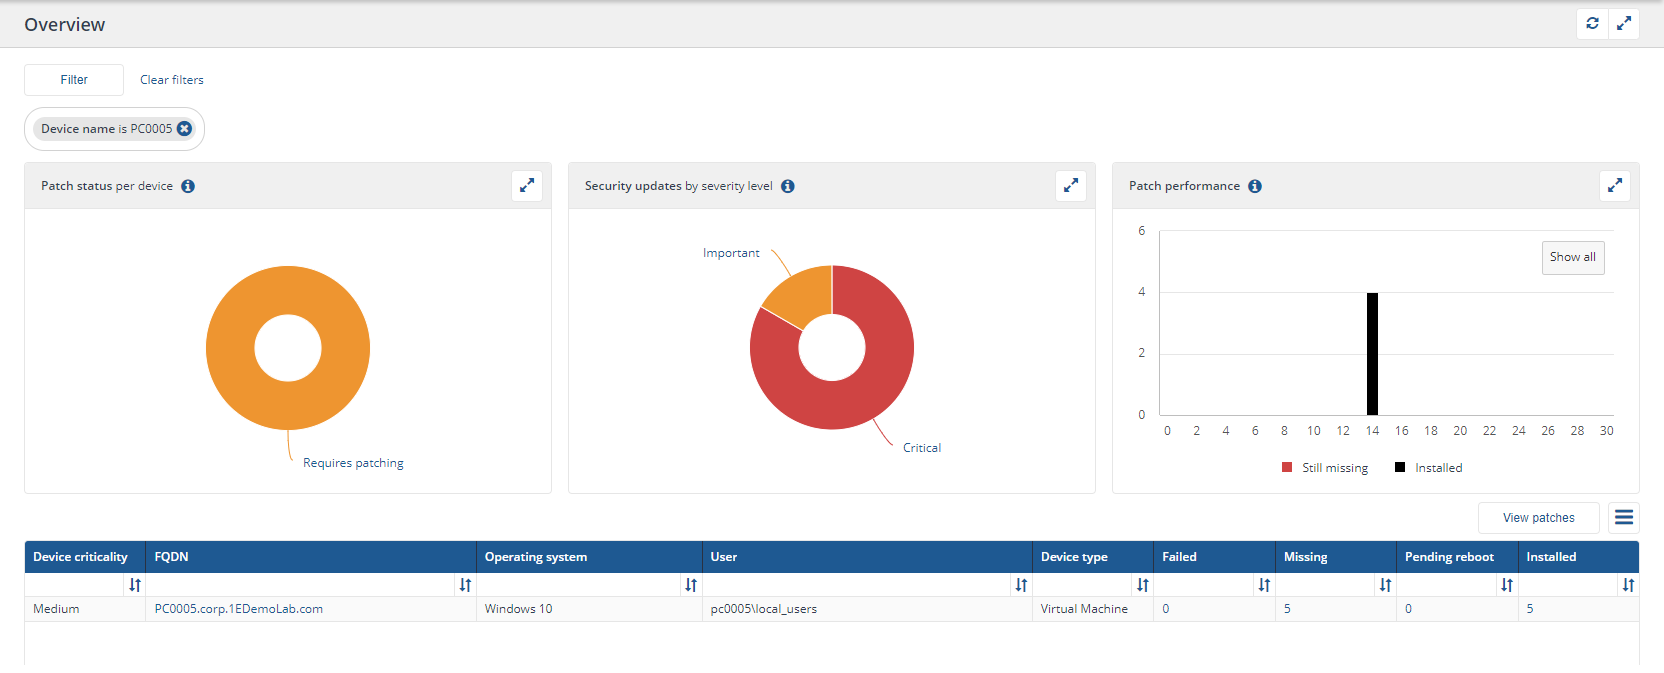
The example picture opposite shows the dashboard with a filter for a single device. It has 10 patches, 5 are Missing and 5 are Installed.
As the device has 5 missing patches the device patch status is Requires patching.
When you hover a chart label you will see the number of devices and the percentage of the total for that label.
The device patch status chart shows:
Requires patching 100% (1 device)
The security updates by severity level chart shows:
Important 17% (1 updates)
Critical 83% (5 updates)
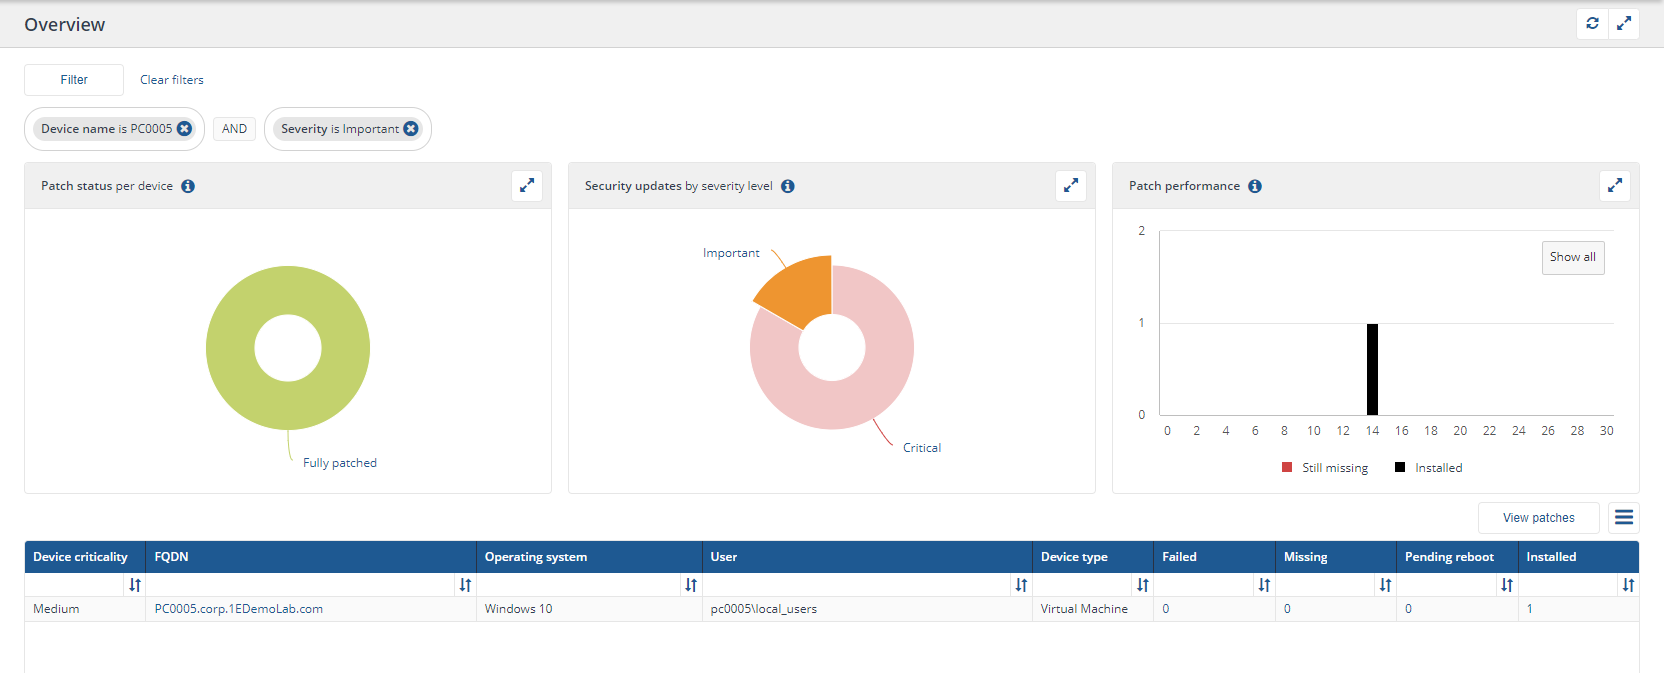
Note
Patches that are not security updates do not have a severity and therefore appear as Not applicable and do not affect the severity chart.
Adding a filter to show only Security Updates that are important causes the set of patches for this device to be reduced to 1 patch in total, with 1 patch showing as installed. The device patch status now shows Fully Patched.
Pivot table
Clicking on the View patches button causes the table to pivot from a list of devices to a list of patches and the button changes to View devices. Clicking on the button again pivots the table back to a list of devices.
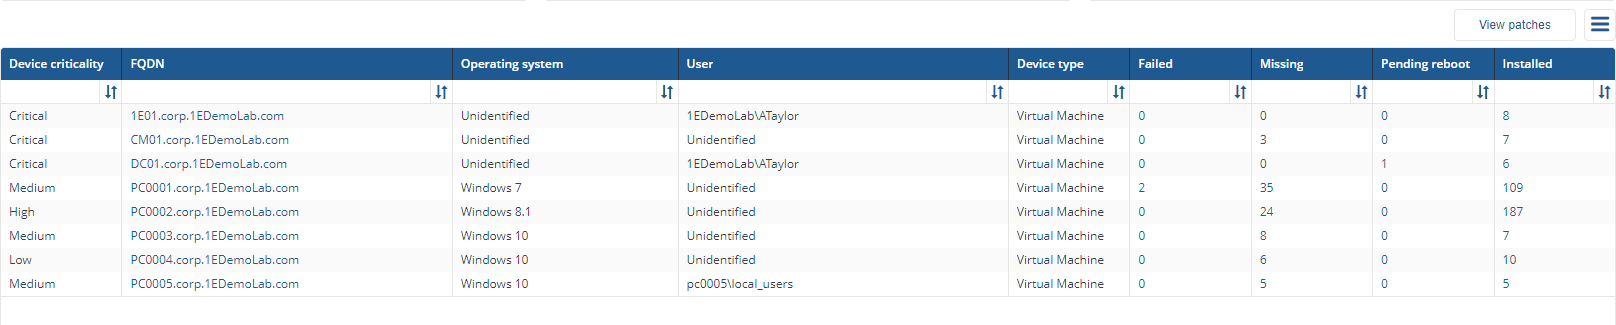
With the table in View devices mode, the list shows:
Device criticality
Device FQDN
Operating system
Primary user
Device type
Patch numbers according to their status:
Failed
Missing
Pending reboot
Installed
Clicking on a device FQDN takes you to the Device pages: Device View.
Clicking on one of the Patch numbers takes you to the Device patches page.
The example picture opposite shows a filtered view of devices in a specific management group.
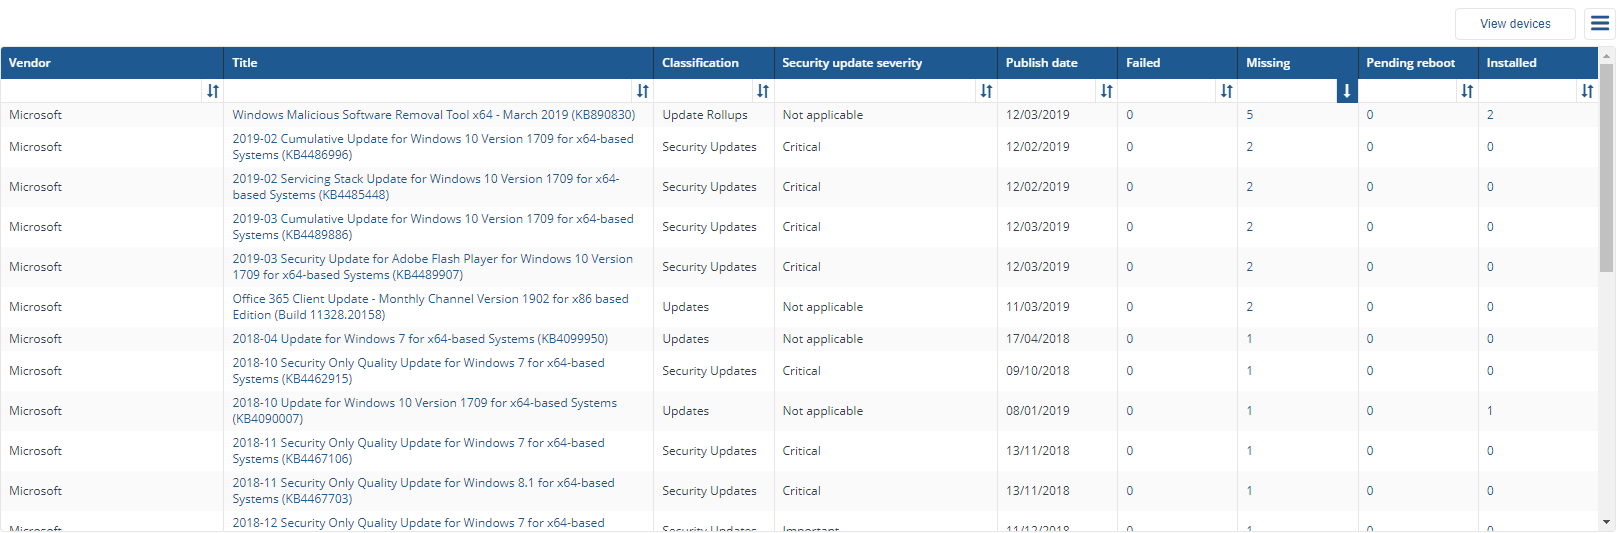
With the table in View patches mode, the list shows:
Vendor
Title
Classification
Security update severity
Publish date
Patch numbers according to their status:
Failed
Missing
Pending reboot
Installed
Clicking on a patch title will take you to the Patch details page.
Clicking on one of the Patch numbers takes you to the Patch installations page.
The example picture opposite shows the previously filtered device and its 6 patches.