Content Distribution overview
1E Content Distribution is a Tachyon Consumer, providing control and visibility on content deployments and delivery in an organization.
Content Distribution features
Content Distribution offers visibility for the following using the Nomad app:
The status of all deployments, including both delivery and execution of content
The effectiveness of Peer to Peer technologies like Delivery Optimization (DO), Nomad and BranchCache
Historical trends like Peer to Peer effectiveness
Where content is located or cached by a Peer to Peer technology.
In addition, to the reporting use-cases mentioned above, Content Distribution supports other content distribution uses-cases like:
Note
The above features were previously provided by ActiveEfficiency Server, which has been replaced by Content Distribution on Tachyon Platform 5.2.
Content Distribution components
Content Distribution consists of four main components, the Nomad app is the front end of Content Distribution and the other components form the back end.
Component | Description |
|---|---|
Shows content distribution stats and provides a UI to manage content distribution. | |
Content Distribution Consumer | REST API collects content distribution data from endpoints and provides it to the Nomad app for rendering. |
ContentDistribution database | A database that backs the REST API and stores its data. |
A component running locally on the endpoint captures content distribution data and posts it to the REST API. |
Nomad app
Content Distribution features are exposed to the user in the Nomad app. Each page in the Nomad app offers different tiles displaying various Peer to Peer metrics.
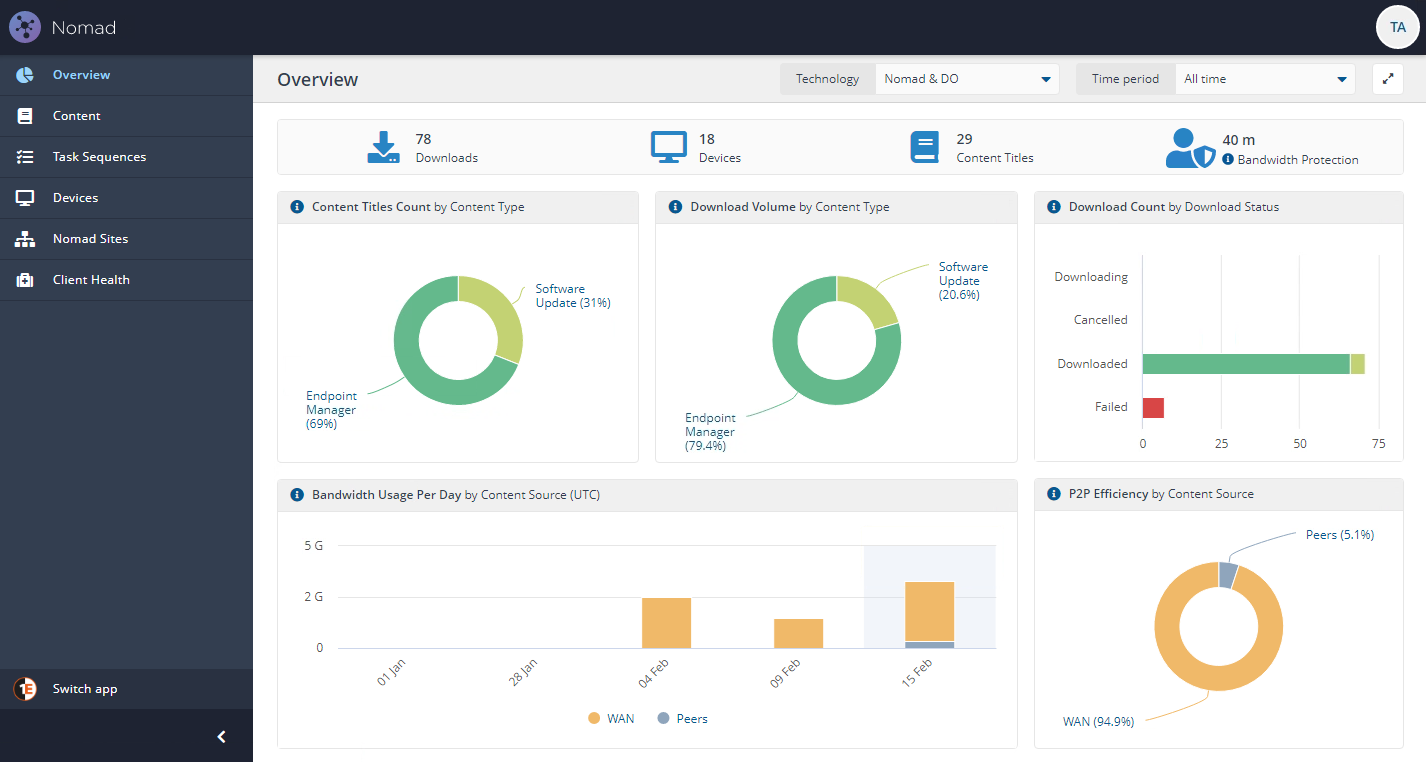
The Overview page gives a high level view of the current status of content throughout the entire network. By default, the view will show activity and status for both Nomad and Delivery Optimization. These defaults can be modified using the Technology filter (to show Nomad or DO activity only) and the Time period filter.
The Overview page gives a brief snapshot of download activity. The page has multiple tiles showing:
Content Titles by Content type
Download Volume by Content Type
Download Count by Download Status
Bandwidth Usage Per Day by Content Source (UTC)
P2P Efficiency by Content Source (Peer to Peer - P2P).
The results can further be narrowed down by using the Technology and Time period filters on the page.
Please refer to the Nomad app reference for more details.