Adding metrics to a dashboard
It is possible to change the displayed metrics for a dashboard in order to view different data in Experience.
Experience allows you to create custom dashboards and choose which metrics are displayed on them. The saved dashboards are called Presets. This tutorial shows you how to choose the metrics for these custom preset dashboards.
The ability to customize dashboard views and choose which metrics are shown on them is common to the following Experience pages:
Stability
Responsiveness
Performance
Sentiment
Devices
Software
Users.
At the top of each page where you can customize the dashboard, depending on the page you're viewing you'll see either an Edit Layout or a Select Metrics control:
Edit Layout- used on the Stability, Responsiveness, Performance and Sentiment pages
Select Metrics- used on the Devices, Software, and Users pages.
Note
For a detailed walkthrough of how to create custom dashboards for your chosen metrics, please refer to Creating your own dashboard.
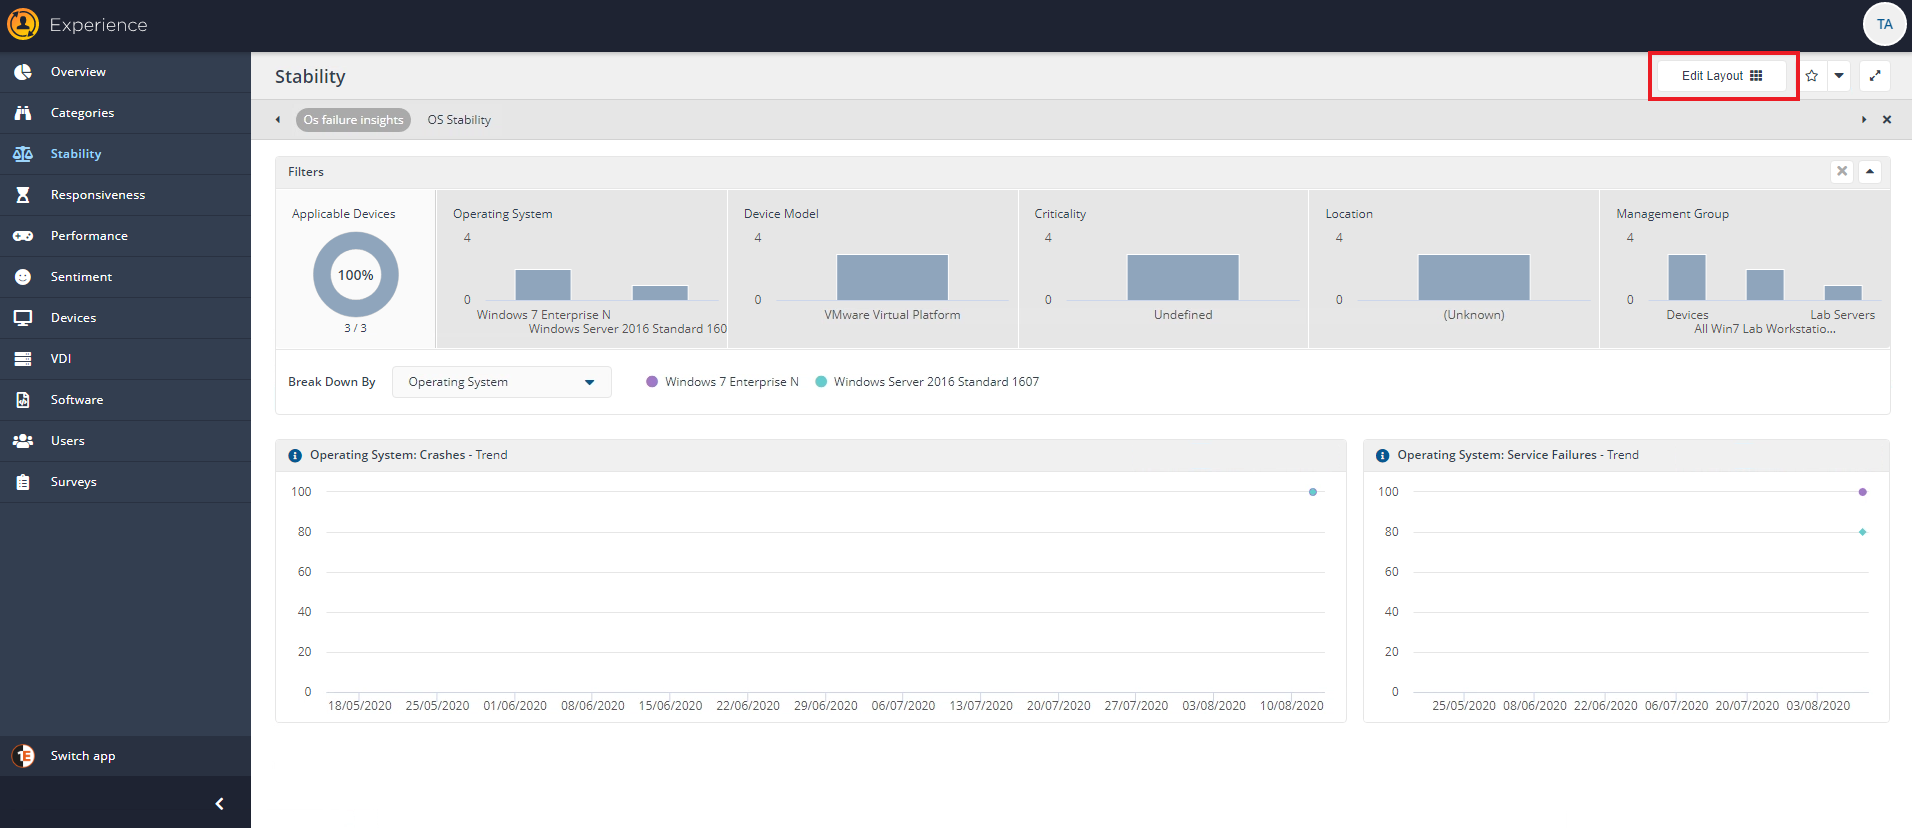
Edit Layout
The Edit Layout control only applies to the Stability, Responsiveness, Performance and Sentiment pages.
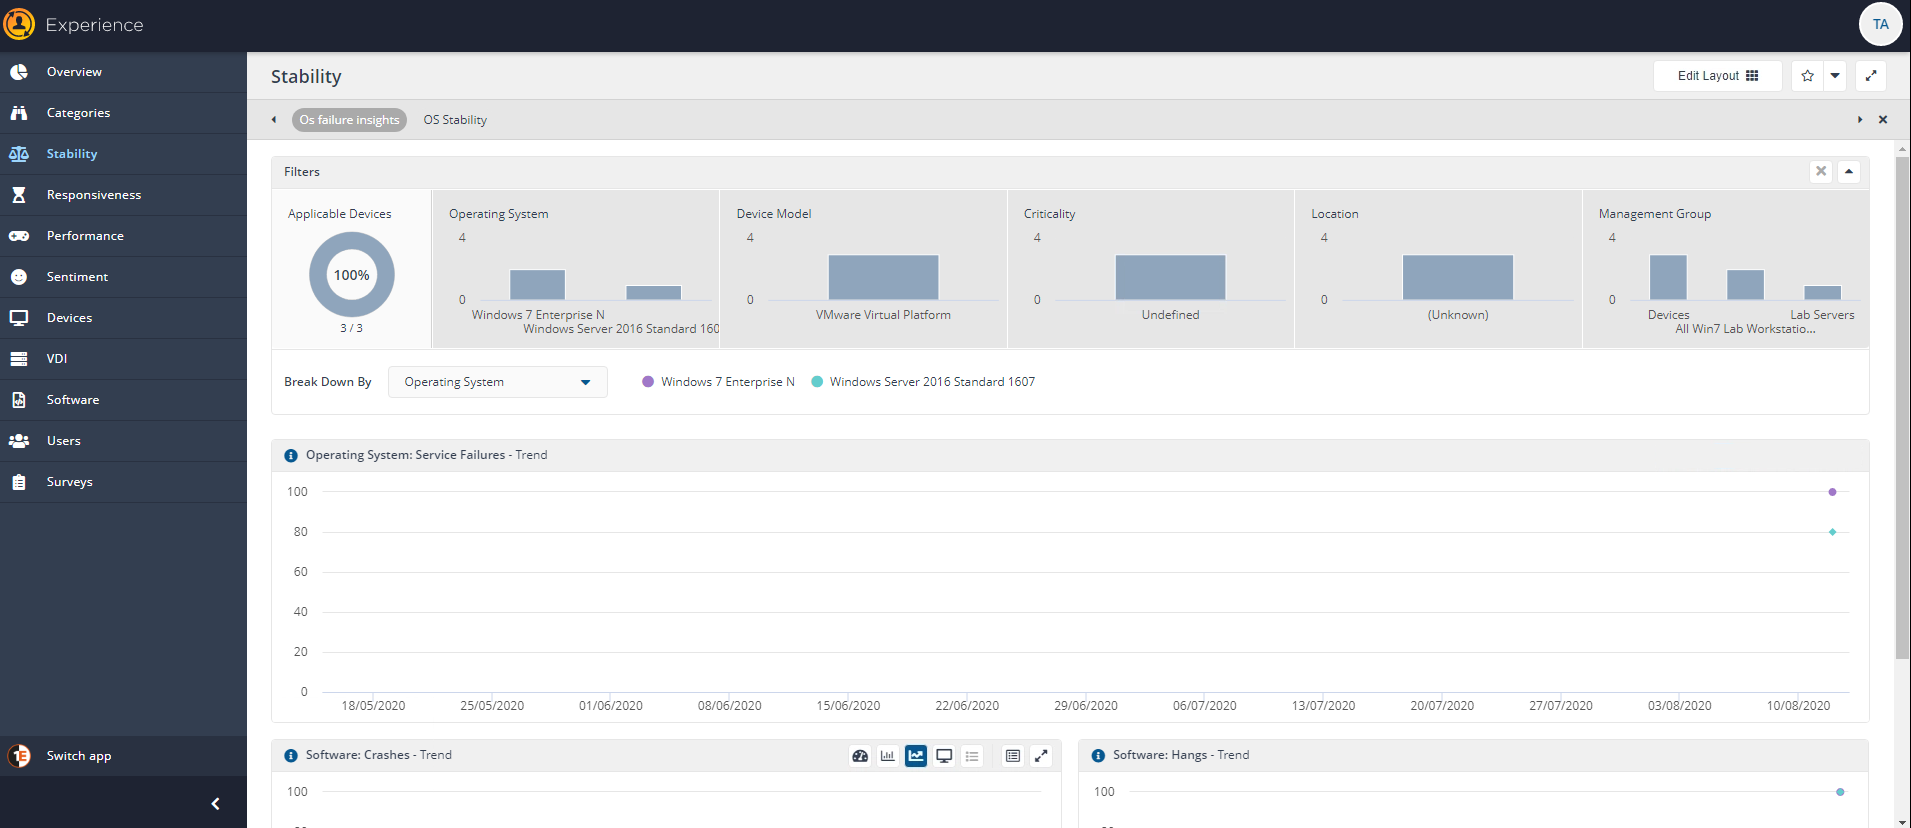
To choose the metrics to display on your dashboard, click the Edit Layout control as highlighted in the picture.
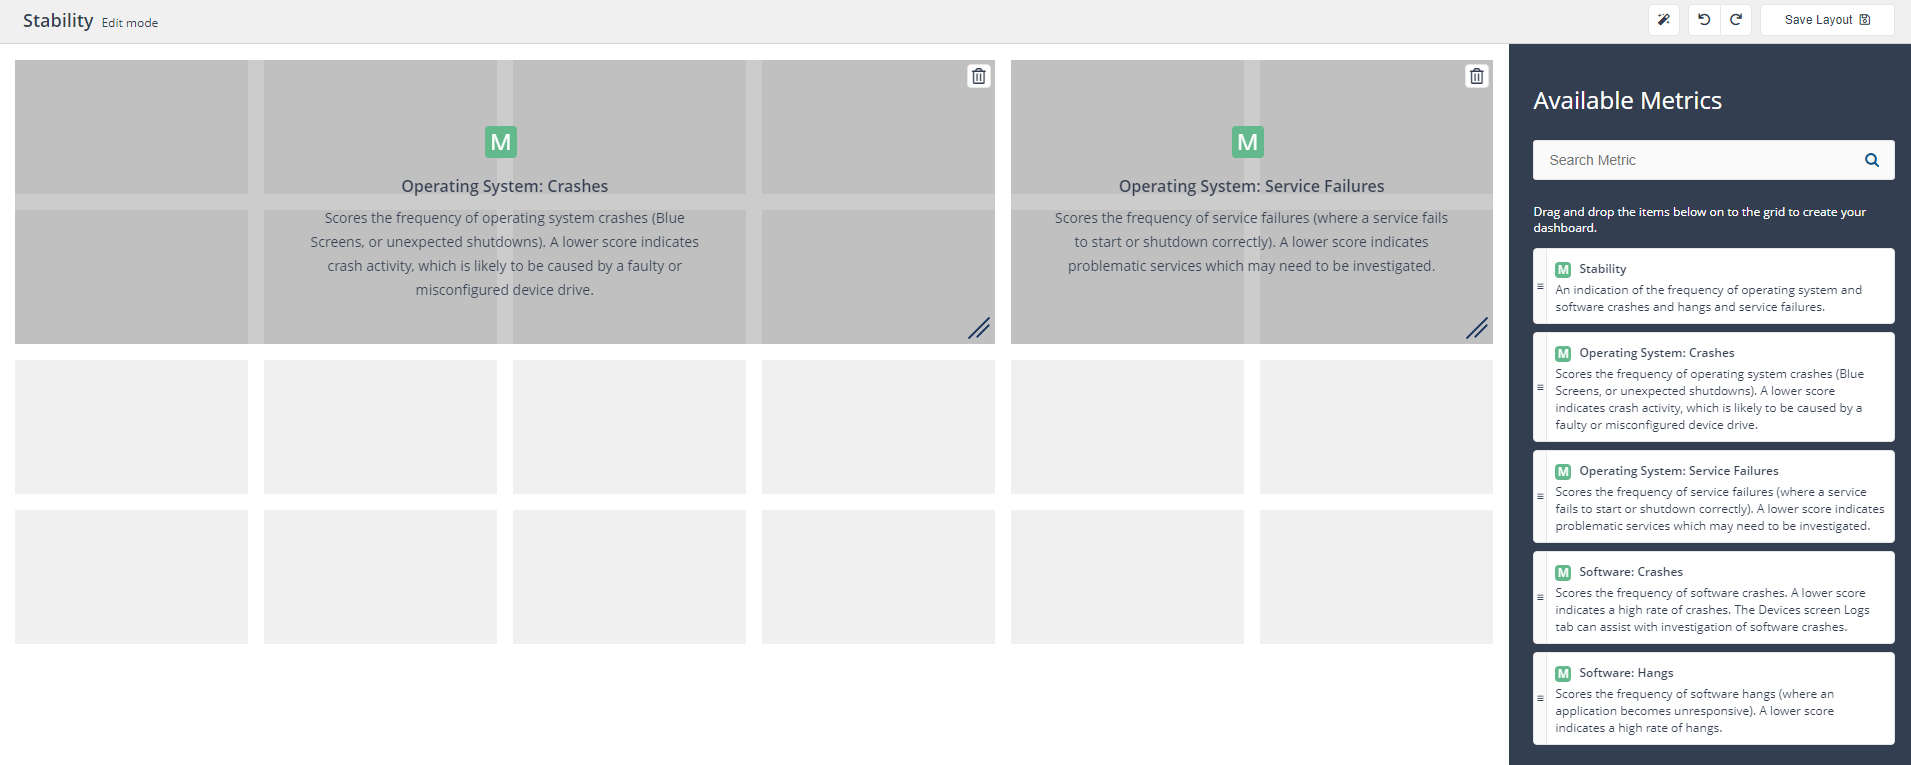
When you're in Edit mode you can choose which metrics are displayed on your dashboard. You can:
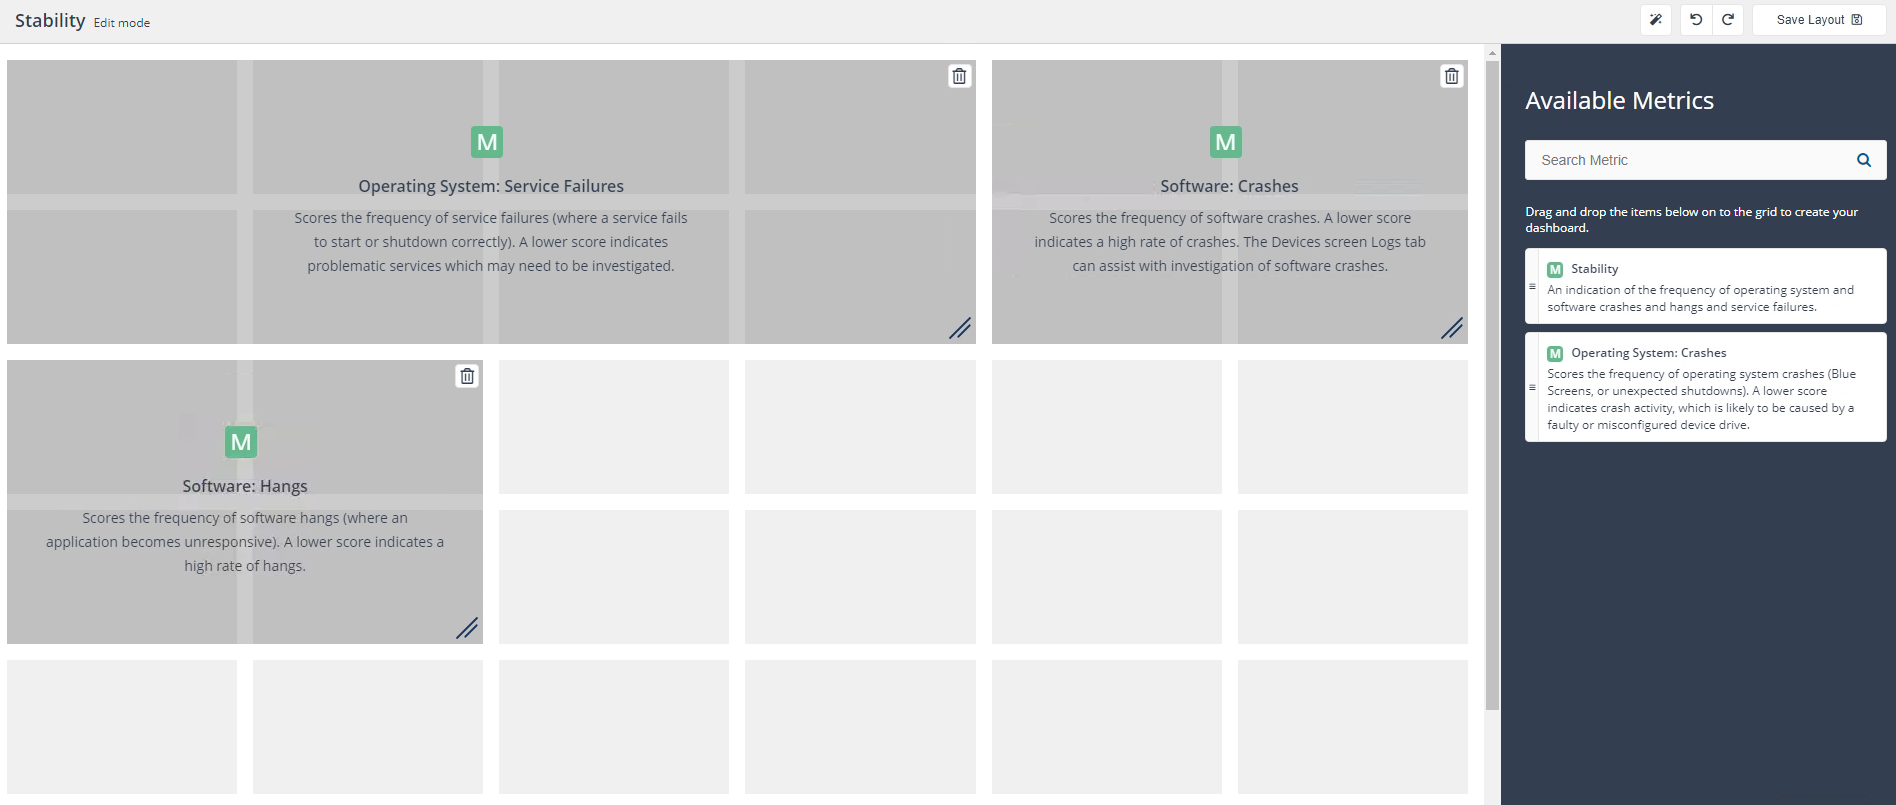
Add metrics from Available Metrics by using drag and drop on to the grid to create your dashboard
Remove metrics from your dashboard by clicking the trash can icon on metric panels in the left-hand pane
Resize how much of the dashboard an individual metric uses by dragging the bottom right-hand corner of a panel using the squared background as a guide.
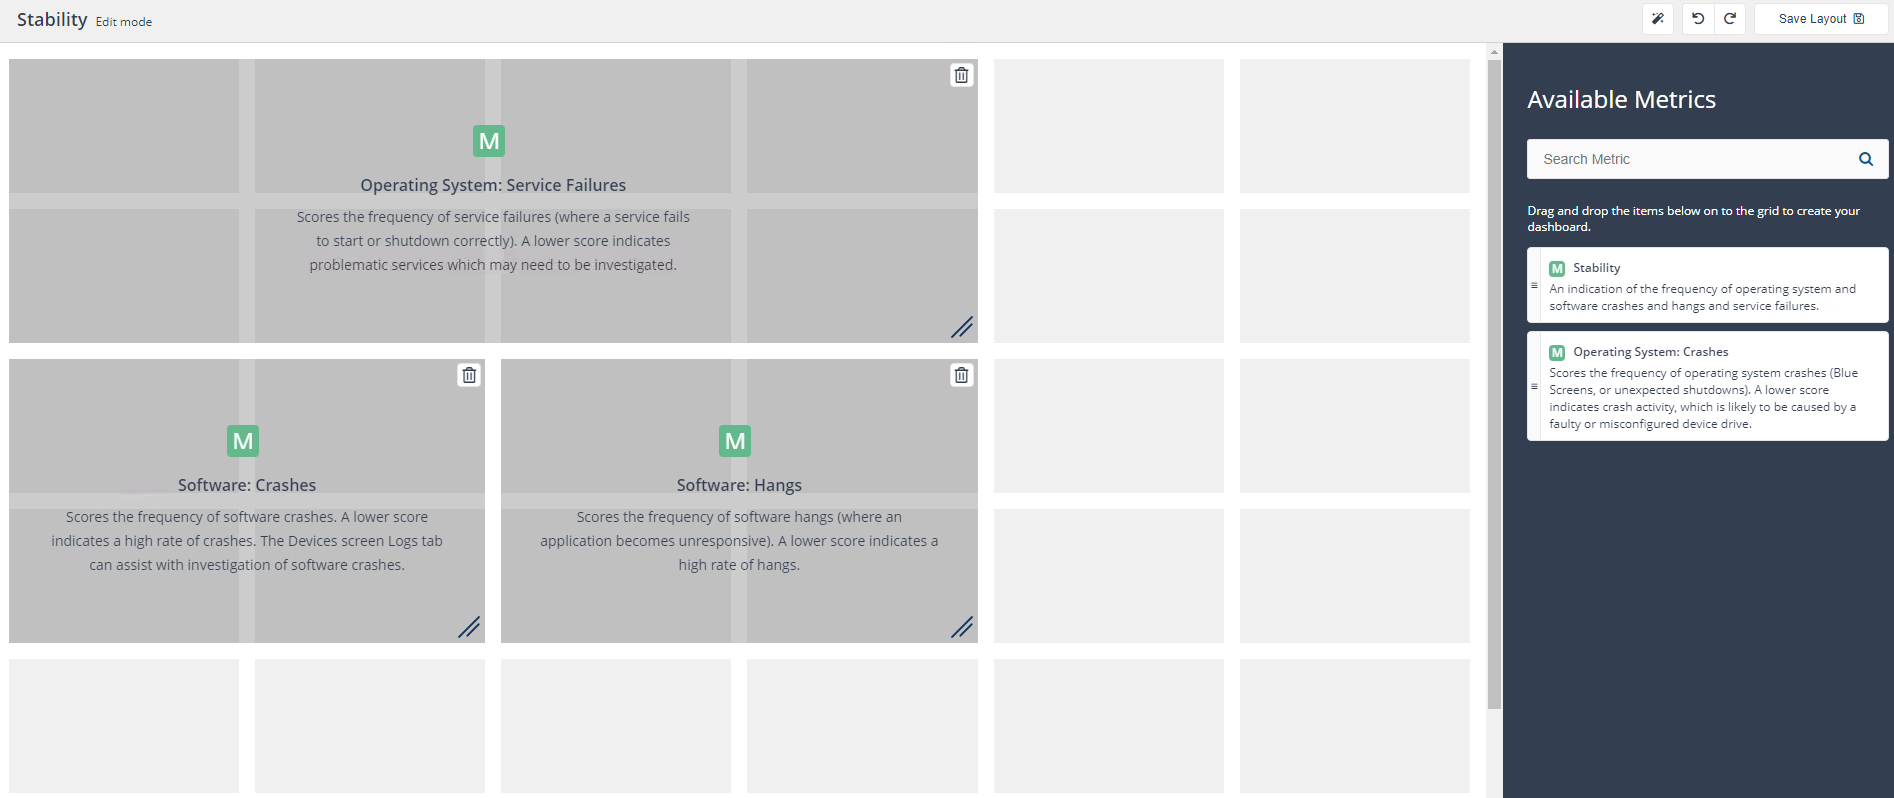
In our example we chose to add Software: Crashes and Software: Hangs and remove Operating System: Service Failures. We also want theOperating System: Service Failuresto have more visibility on the dashboard, so we have expanded this view.
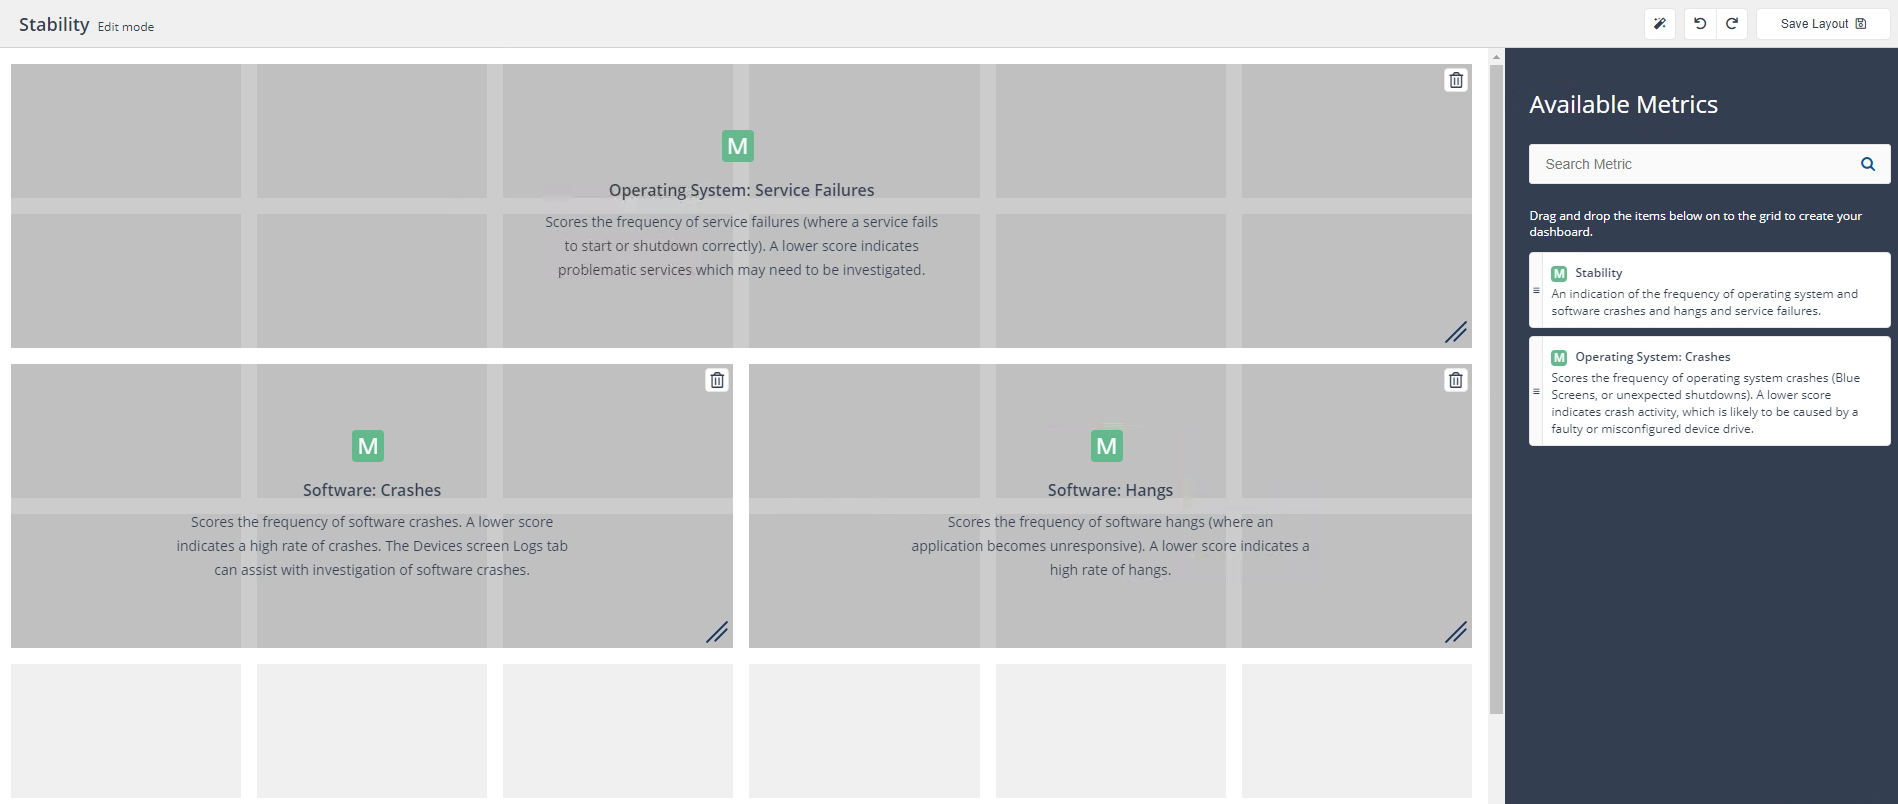
You can also use the optimise space icon (magic wand) on the top right-hand corner of the page, which automatically adjusts the view to remove any potential gaps on the dashboard. In our example clicking the optimise space icon gives us the result in the picture.
In our example we preferred to manually adjust the view so that Operating System: Service Failures covers the top of the dashboard with Software: Crashes and Software: Hangs underneath.
Using the undo icon on the top right-hand corner of the screen we undid the optimise space action and then manually expanded Operating System: Service Failures, Software: Crashes and Software: Hangs to fill the space.
We then clicked Save Layout on top right-hand corner of the screen, to save this layout and return to the dashboard view.
Note
To reverse your changes in edit mode, either use the undo button on the top right-hand corner of the screen. You can also reload the page to return to the selected dashboard without saving your changes or use the back button on your browser.
Now we have chosen the metrics to display on our dashboard we can add it to the list of Preset dashboards.
Clicking the star icon in the top right-hand corner of the screen will give you the option to save this view as a Preset dashboard you can return to a later date.
Note
For a detailed walkthrough of how to save Preset dashboards for your chosen metrics, please refer to Creating your own dashboard.
Select Metrics
The Select Metrics control only applies to the Devices, Software, and Users pages.
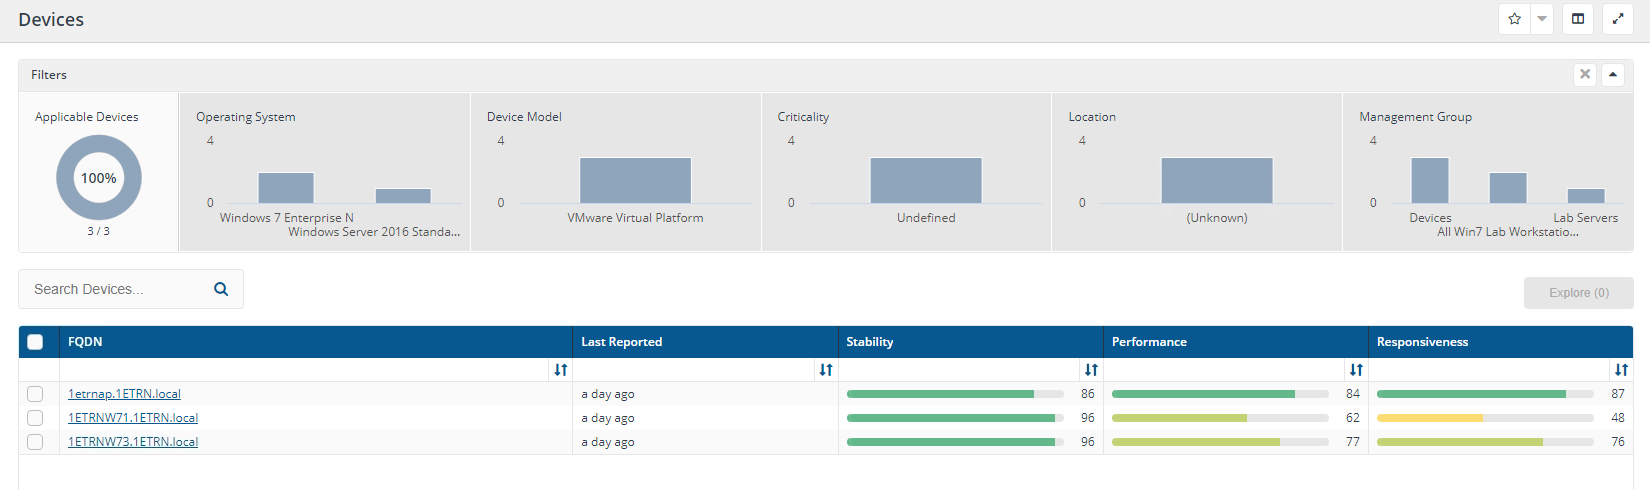
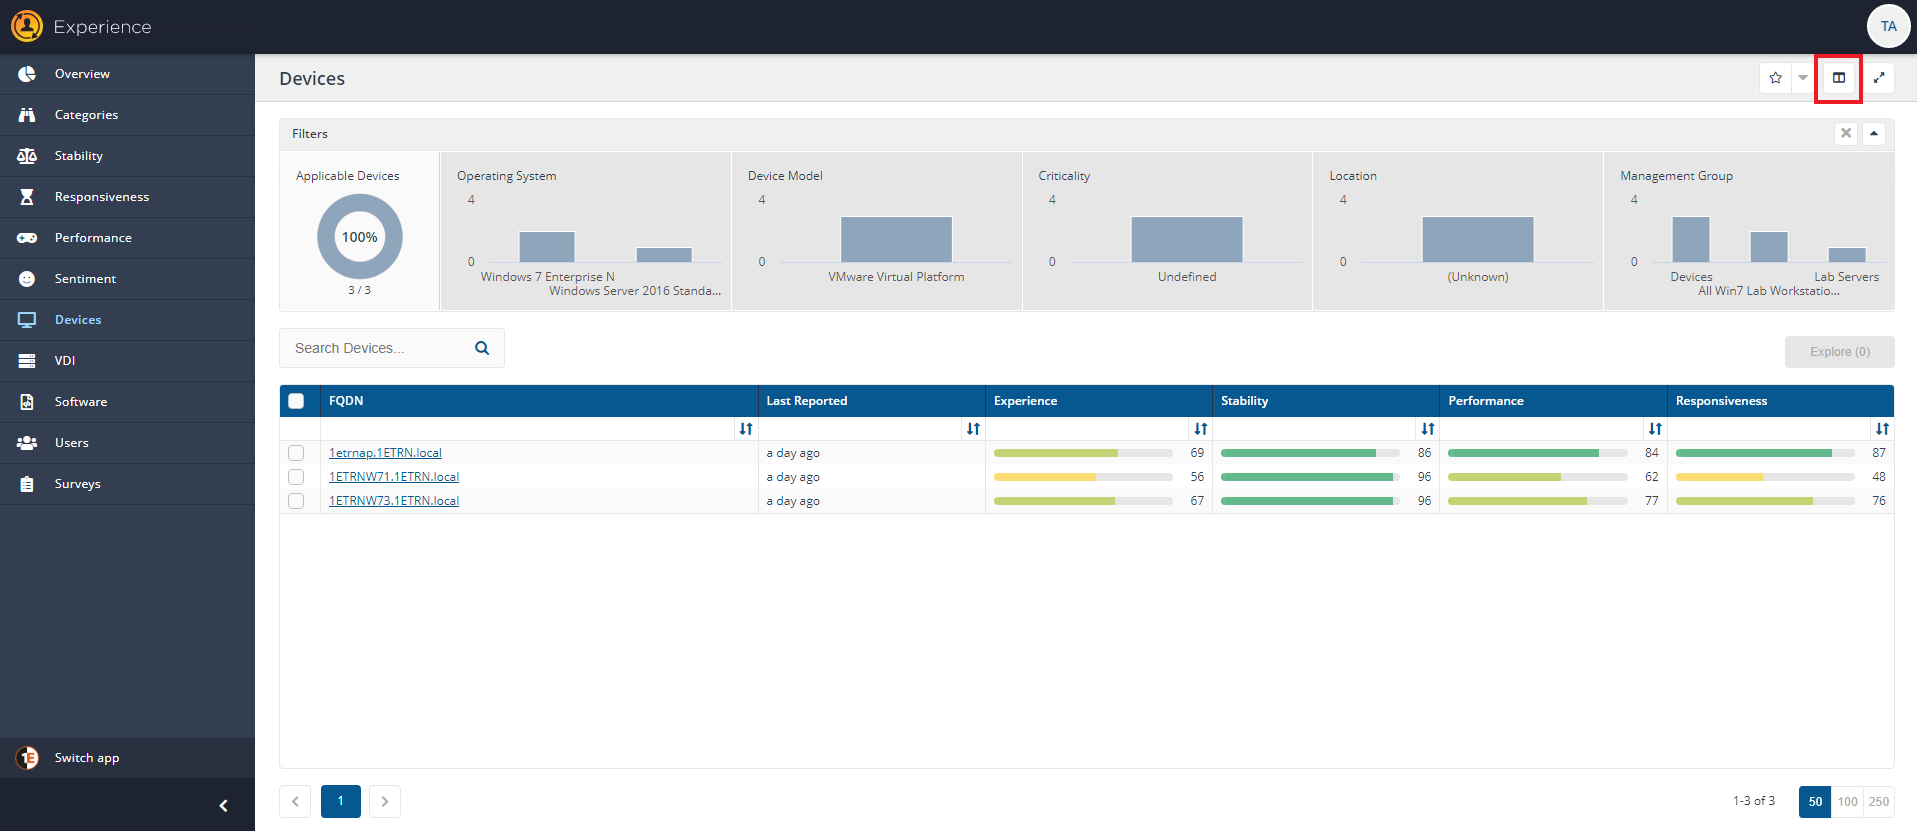
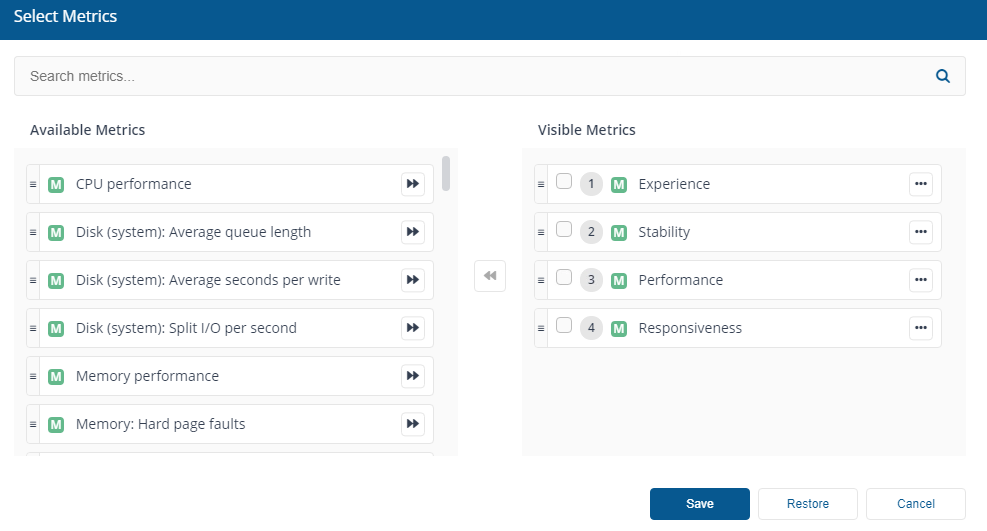
To choose the metrics to display on your dashboard, click the Select Metrics control as highlighted in the picture.
The Select Metrics control allows you to add different metrics or remove metrics that are visible on the currently displayed dashboard.
In our example, we'll remove the Experience metric to focus on Stability, Performance and Responsiveness. We can do this by selecting the Experience metric and clicking the double arrow icon to remove it from the list of Visible Metrics and add it to the list of Available Metrics.
In addition, you can:
Drag and drop columns to change the order they are displayed.
Also use the arrow controls to move up or move down, exclude or include any column - clicking on the ellipsis displays on each metric displays these additional controls.
To apply the view to the current dashboard and return to the dashboard view, clickSave.
Note
If you've made a number of changes and you want to revert to the original metrics settings you can click on the Restore button in the Select Metrics popup to revert to the original settings.
Clicking Cancel will also cancel your changes and exit the Select Metrics control.
When you have saved your changes and returned to the dashboard view, clicking the star icon in the top right-hand corner of the screen will allow you to save this view as a Preset dashboard you can return to a later date.
Note
For a detailed walkthrough of how to save Presets for your chosen metrics, please refer toCreating your own dashboard.