Title and filter bars
Information about the title and filter bars that appear at the top of all Patch Success pages.
Patch Success title bar
The title bar shows information about the total number of devices and the patch status. The totals on the title bar are not affected by filters. The following table describes the function of each heading in the title bar.

Heading | Description | |
|---|---|---|
Inventory repository | A selected inventory repository. Changing the selection in this drop down will update the data on the Patch Success dashboards. Only one inventory repository can be selected at any one time. | |
Devices | The total number of devices in the selected inventory repository. If two numbers are shown, the first number is the total number of devices that reported patch data. A single number is shown if all devices reported patch data. The image above shows 8 devices have reported patch data. | |
Fully patched | The number of fully patched devices. | NoteThe numbers shown are for the selected inventory repository. A device is counted only once under under each of these headings. The sum of these four numbers equals the total number of devices in the selected inventory repository. The totals shown on the title bar are only affected by the Repository filter, no other filter will affect these numbers. See below for more information about how 'Device Patch Status' is determined. |
Require rebooting | The number of devices that require rebooting to complete installations. | |
Require patching | The number of devices with missing patches. | |
Require attention | The number of devices with failed patches. | |
Management group | A management group filter. Changing the selection in this drop down will change the filter to the selected management group and update the data on the Patch Success dashboards. To filter multiple management groups you must use the Filter popup, and the title bar will show the first one in the filter list. | |
Last processed | This shows the last time the ETL and cube was last processed. | |
Avatar | The initials of the logged on user. | |
Page title bar
Each Patch Success page has refresh and expand buttons.
The refresh button is used to refresh the contents of the page.
The expand button toggles the size of the page inside the browser by hiding or showing the menu and main title bar.
Filter bar
The filter bar shows all currently selected filters. The Filter button open the Filter popup to allow filters to be managed, and Clear Filters removes all the currently selected filters.
You can add filters by using the Filters button, or cicking on headings in the Overview
Using the Filter popup to add and remove filters
Click the Filter button to display the Filter popup
Select a Filter type from the first column
Select or enter all the required filter options for the selected filter and click Add
Add multiple filters if required
Click Apply to close the Filter popup and apply the selected filters
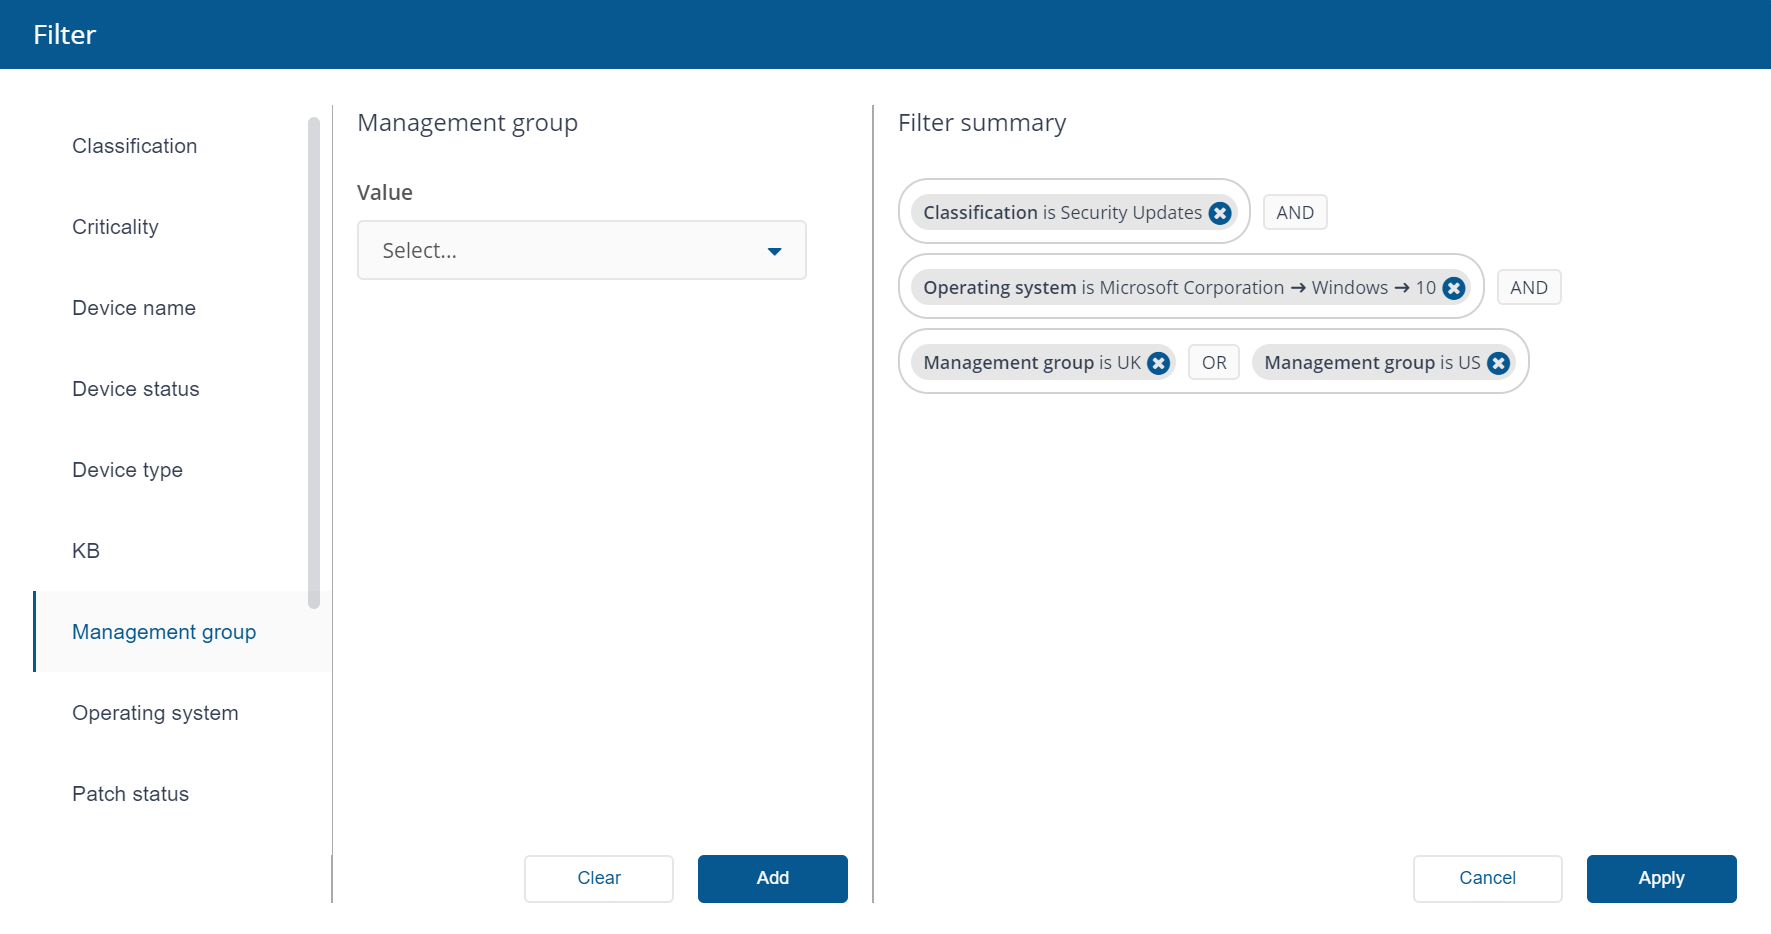
You can add multiple filters of the same type if needed, the exception being range filters where only one filter per type can be added. The range filters are time to install and publish date. All filters of the same type are combined with OR, filters of different types are combined with AND. The Filter popup is divided into 3 columns as shown in the picture opposite and the table below:
Filter type | Filter options | Filter summary |
|---|---|---|
Displays a list of Filter types. Select a Filter type by scrolling through the list and selecting one. | Displays options for the currently selected filter type. Click Add to add the filter with its selected options. Click Clear to reset the currently selected options. This will not affect filters that have already been added to the filter summary column. | Displays all the currently selected filters. Click the Click Apply to apply the new filters and close the Filter dialog. Click Cancel to ignore any changes and close the Filter dialog. |
Interacting with Overview page charts to add and remove filters
You can click on chart slices and labels to add filters. Clicking on a slice or label once adds its filter, and clicking on it again removes its filter. Clicking with the CTRL key down allows you to add and remove multiple filters. For range charts clicking with the SHIFT key down allows you to select a range of filters.
To remove a filter
click on the

icon to remove an invidual filter from the Filter summary or from the filter bar
click on Clear filters to remove all filters from the filter bar
click on a
icon to remove an invidual filter from teh filter bar
open the Filter popup and use the the Filter summary or from the filter bar
The pictures below show an example of filters that have been added to show Security Updates on Windows 10 devices in the UK or US management groups.
Filter types
The following table lists filter types and their avilable values. You can add multiple filters of the same type if needed, the exception being range filters where only one filter per type can be added. The range filters are time to install and publish date. All filters of the same type are combined with OR, filters of different types are combined with AND.
Type | Available values |
|---|---|
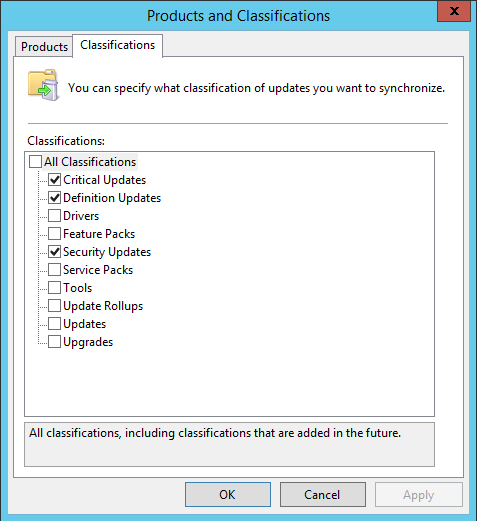
Classification | Select a patch classification from the list of available values. The available values depend on which products and classifications have been specified in WSUS, as shown in the picture opposite.
And also:
|
Criticality | Select a device criticality from the list of available values. The available values shown opposite are default values provided by Tachyon and configurable in a lookup list in the GlobalSettings table in TachyonMaster database.
Device criticality is set on devices by the using the Device.SetCriticality method, as used for example by the instruction 1E-Explorer-TachyonAgent-SetCriticality. The instruction sets the criticality number on the Tachyon client, which is returned as part of the Device details. If not set then the client returns 0. The system translates this number into a criticality value using a lookup table (in the TachyonMaster database). The criticality value is used in various dashboard tiles and tables, as well as Device details, and can be filtered using these values. |
Device name | Select a specific device by name. Search by typing at least three characters and select a device from the search results. The filter itself cannot contain a wildcard, you must select a device and use its full name. |
Device status | Select a device status from the list of available values:
|
Device type | Select a device type category and sub-category:
|
KB | Select a specific KB number. Search by typing at least three digits and select a KB from the search results. The search is based on KB meta-data available in your inventory repository as reported by Configuration Manager or WSUS. The list includes all KBs not just the ones that are actually installed, and may therefore return zero devices. |
Management group | Select a management group from the available list. If the list is not up-to-date after creating a new management group then you may need to reprocess the cube data. |
Operating system | Select an operating system by selecting Vendor, Title and Colloquial version from the available lists. The values available will depend on data in your selected inventory repository. |
Patch status | Select a patch status from the available list:
|
Publish date | Select from and/or to dates for when patches were published. Dates are inclusive. NoteOnly one range filter is allowed when filtering. |
Severity | Select a patch severity from the available list:
|
Time take to install | Specify from and/or to for the number of days a patch was installed after it was published. Days are inclusive. NoteOnly one range filter is allowed when filtering. |
User | Select a specific user by name or enter Unidentified. Search by typing at least three characters and select a user from the search results. The filter itself cannot contain a wildcard, you must select a user and use their full name. |
WSUS Products and Classifications
Please refer to https://docs.microsoft.com/en-us/sccm/sum/get-started/configure-classifications-and-products for a description of each classification.