Investigating Network Performance
In this scenario, the EUC manager uses the Advanced Analytics→Network page of Experience to monitor and examine experience related to the network performance for devices.
Taking a look at the Network page
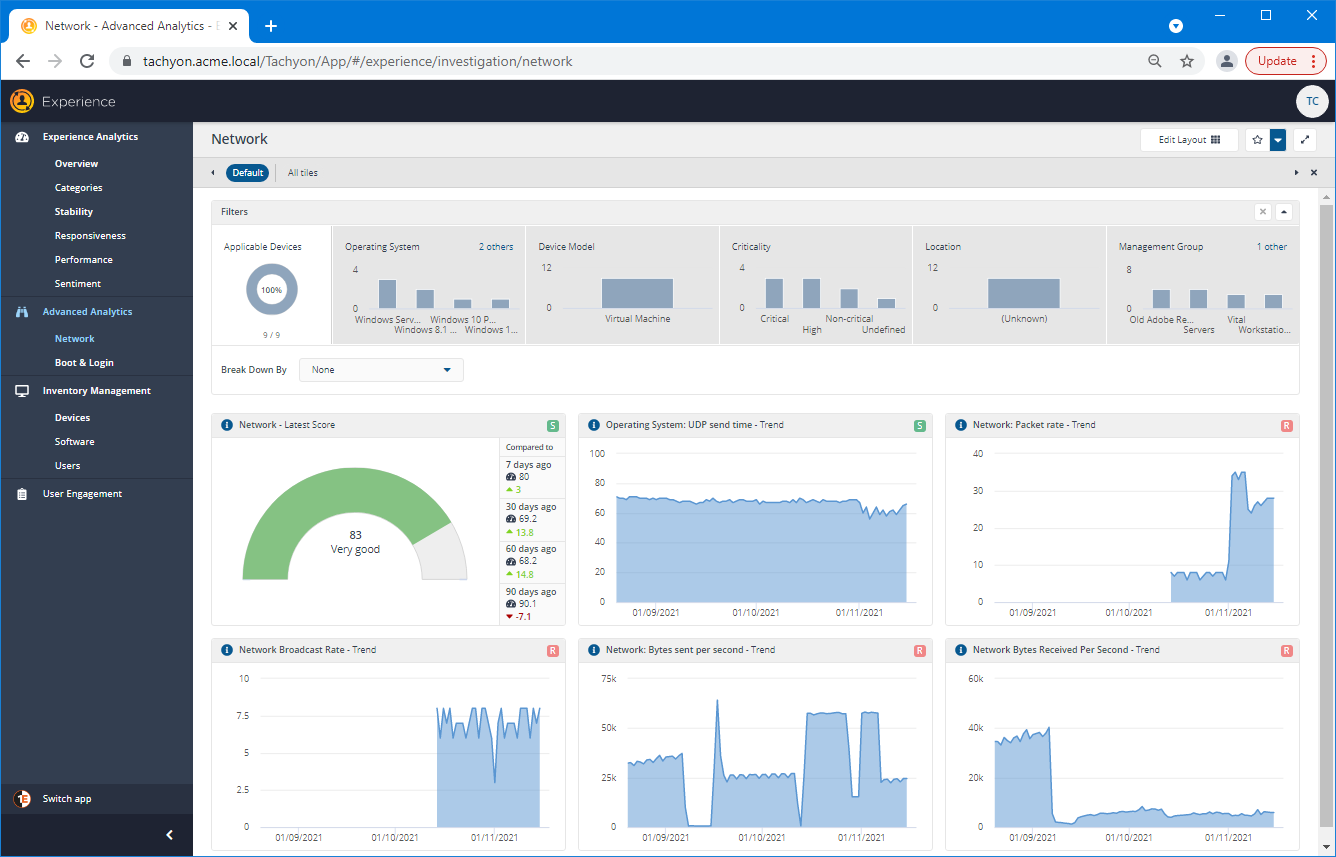
The Advanced Analytics→Network page provides a dashboard where network performance data can be examined. By default, there are two score related tiles: Network - Latest Score and Operating System: UDP send time - Trend. The rest of the tiles show averages of the raw, unprocessed data being measured across all the devices.
The EUC manager navigates to the Advanced Analytics→Network page, sees that the general overall score is 83 Very good, but also sees that there's been a bit of fluctuation for the measurements on the other tiles showing the averaged raw data.
Focusing on the UDP send time
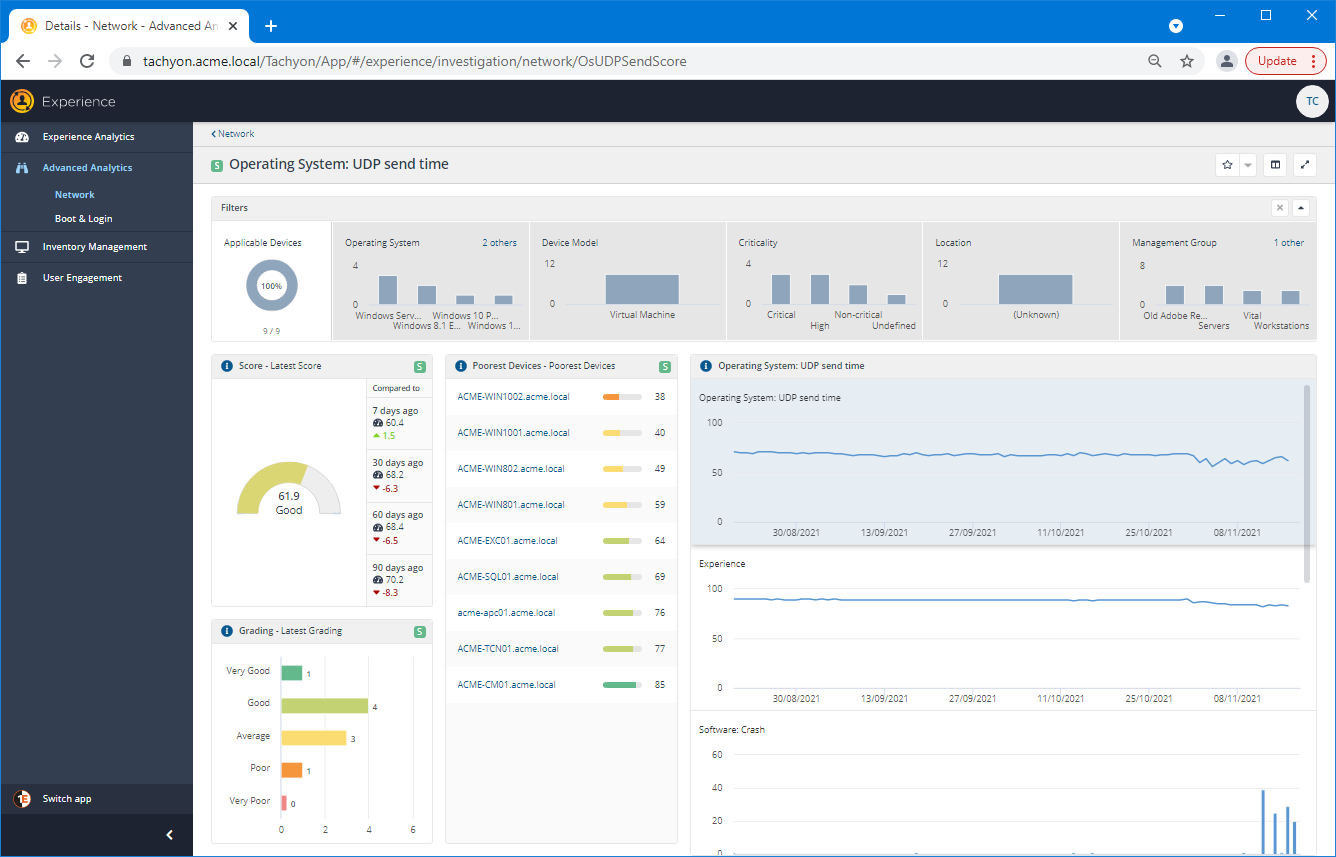
Looking at the trend on the Operating System: UDP send time - Trend tile, they notice that there has recently been a dip in the score. Clicking on one of the data points in the chart navigates to the Operating System: UDP send time page. Here they can see in the Poorest Devices tile that a few devices aren't performing particularly well in that area. There is also a recent downward trend for the Experience score that matches the fluctuations in the UDP send time.
The Devices page
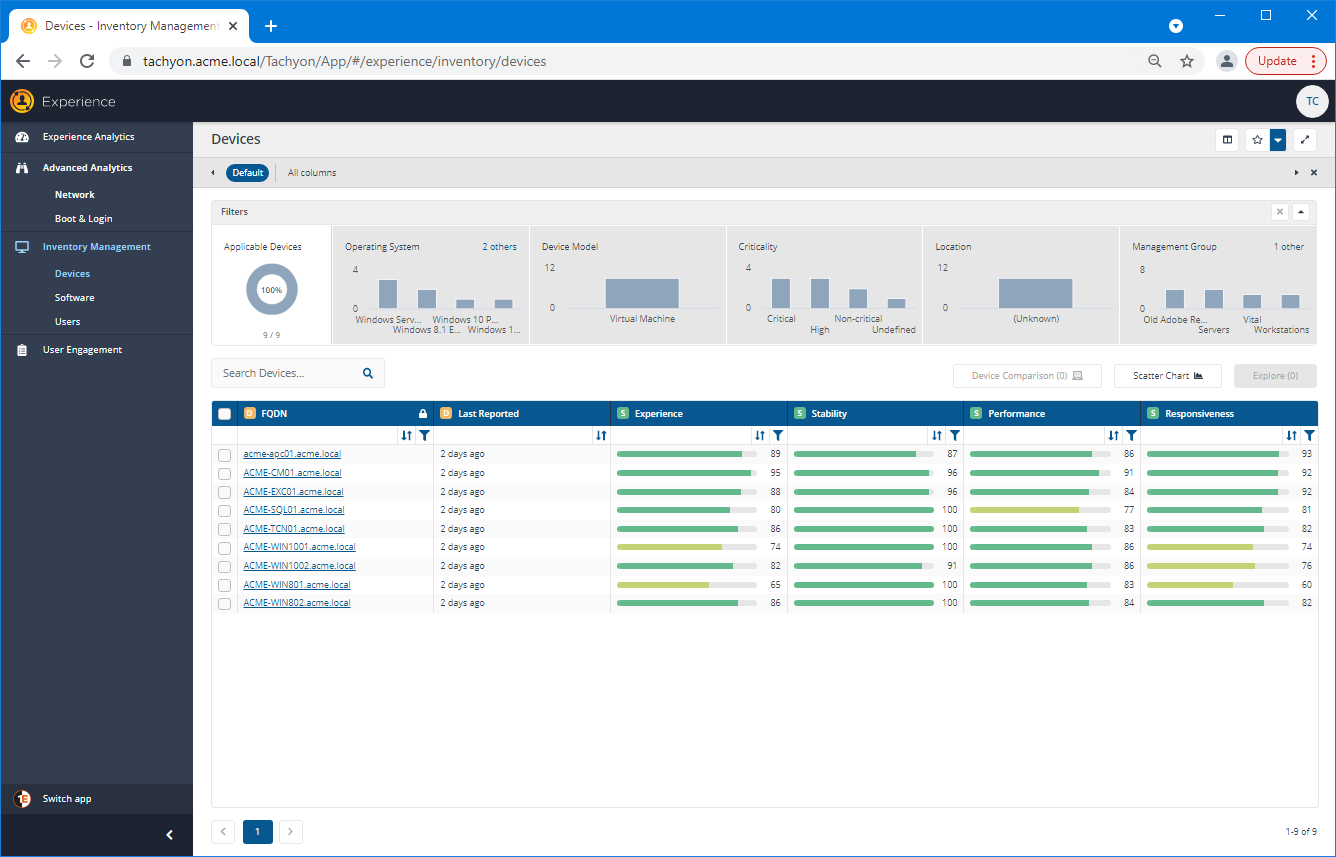
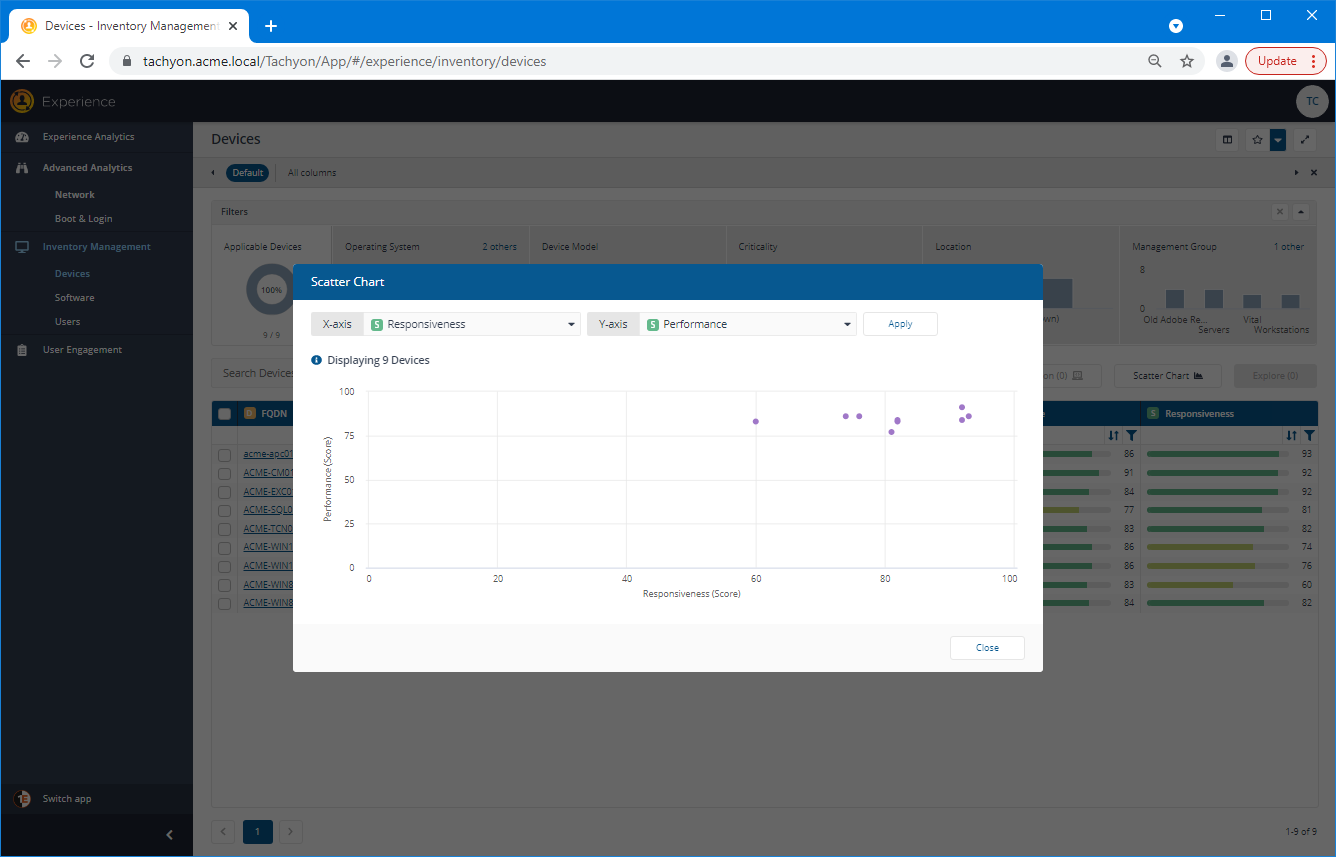
Navigating to the Inventory Management→Devices page enables the EUC manager to investigate the devices using the Scatter Chart popup. To display this, click on the Scatter Chart button just above the devices table.
The Scatter Chart
The Scatter Chart plots the devices in the current view on a chart with two selectable axes. Initially, this shows the Responsiveness score on the X-axis and the Performance score on the Y-axis. In our example, the devices are all situated in the ideal top-right quadrant for these two scores.
Selecting the UDP sent time score for the X-axis
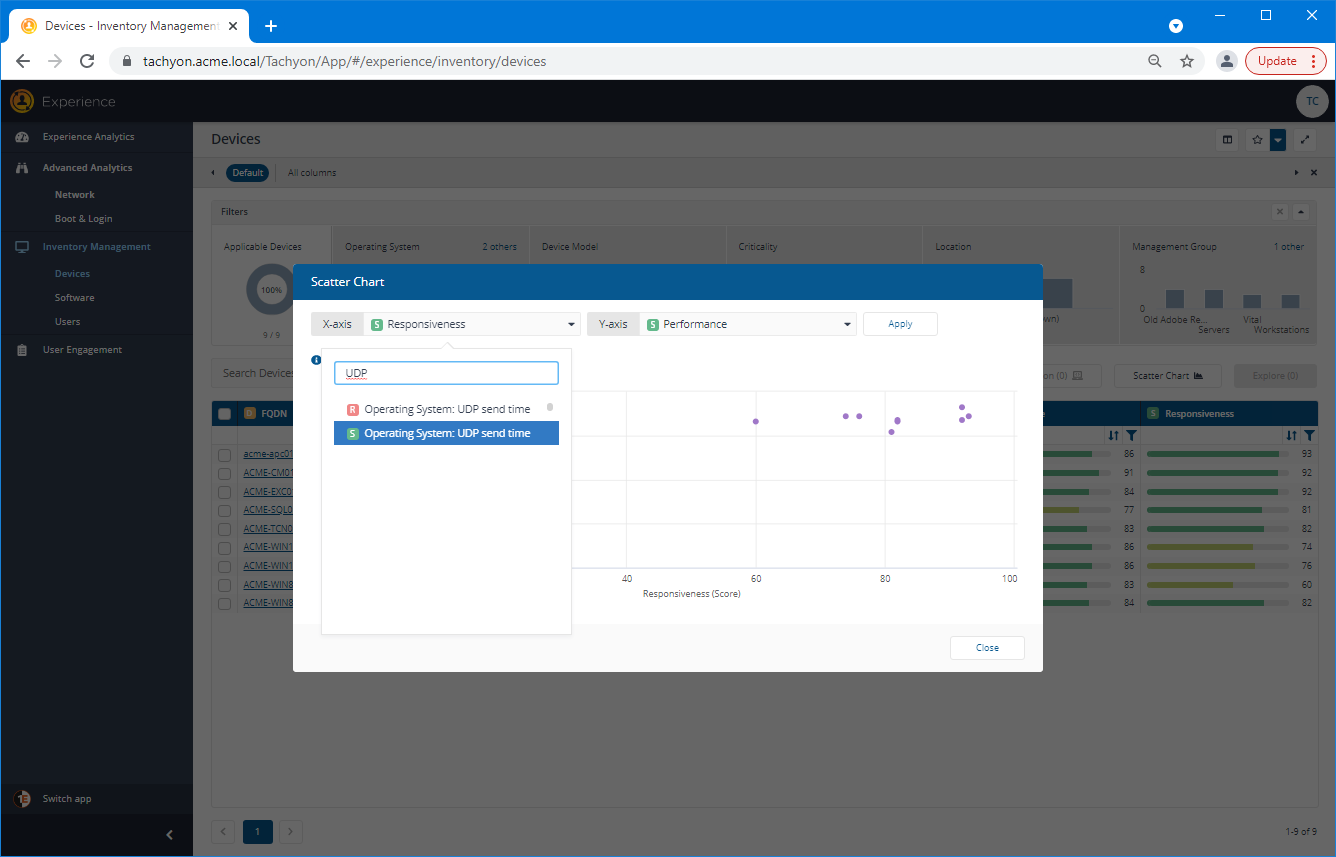
The EUC manager wants to plot the devices according to the UDP send time, in order to determine both the poorest and best scoring devices. Clicking on the drop-down menu next to the X-axis field, displays the list of available parameters. You can choose from a selection of score or raw values. Typing into the search field filters the available parameters to those that match.
In our example, the EUC manager types UDP into the search field and then selects the Operating System: UDP send time score from the list of matching parameters.
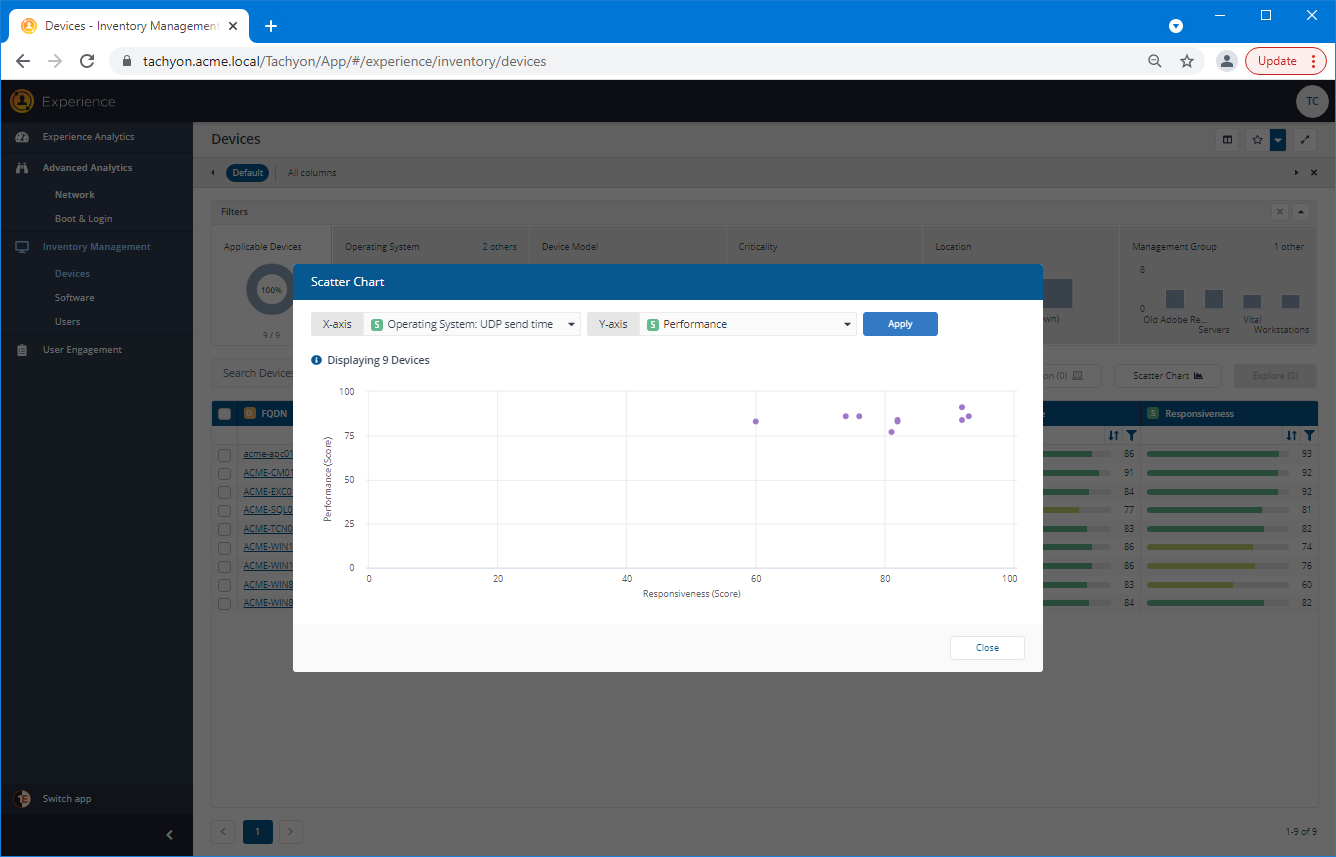
Applying the selected change to the X-axis
When you make a change to either axis parameter, you then need to click Apply to change the plot of the Scatter Chart. The picture shows the Apply button highlighted.
The device with the lowest UDP send time score
When the devices are plotted using the Operating System: UDP send time along the X-axis, the poorest score is displayed on the left. Hovering over a point, shows the FQDN and X and Y values for that device. Here, the EUC manager can see that the device with the poorest UDP send time score is ACME-WIN1002.acme.local.

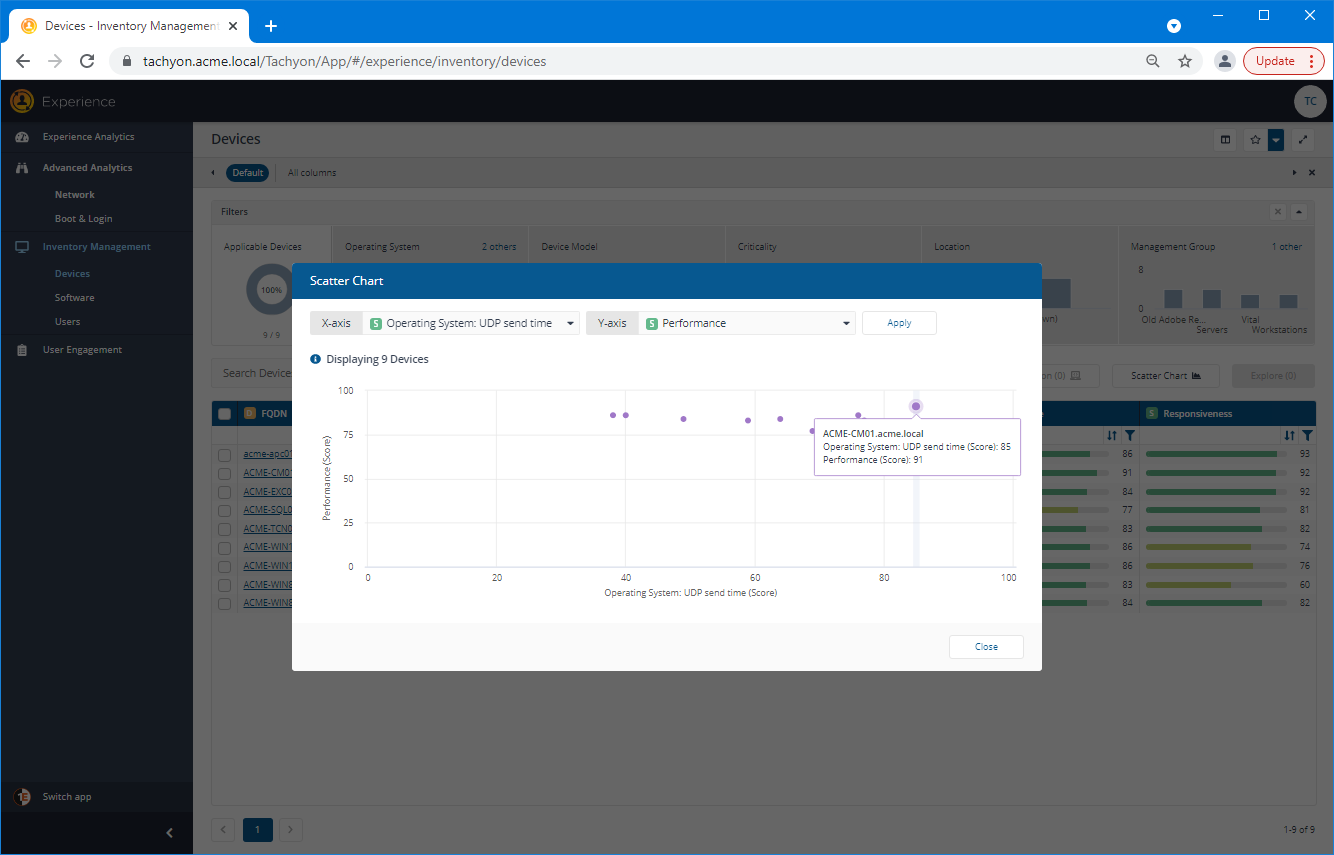
The device with the highest UDP send time score
Correspondingly, hovering over the point furthest to the right displays the details for the device with the highest UDP send time score. In our example, this is ACME-CM01.acme.local. Having made a note of the devices with the lowest and highest UDP send time scores, the EUC manager clicks the Close button on the Scatter Chart popup.
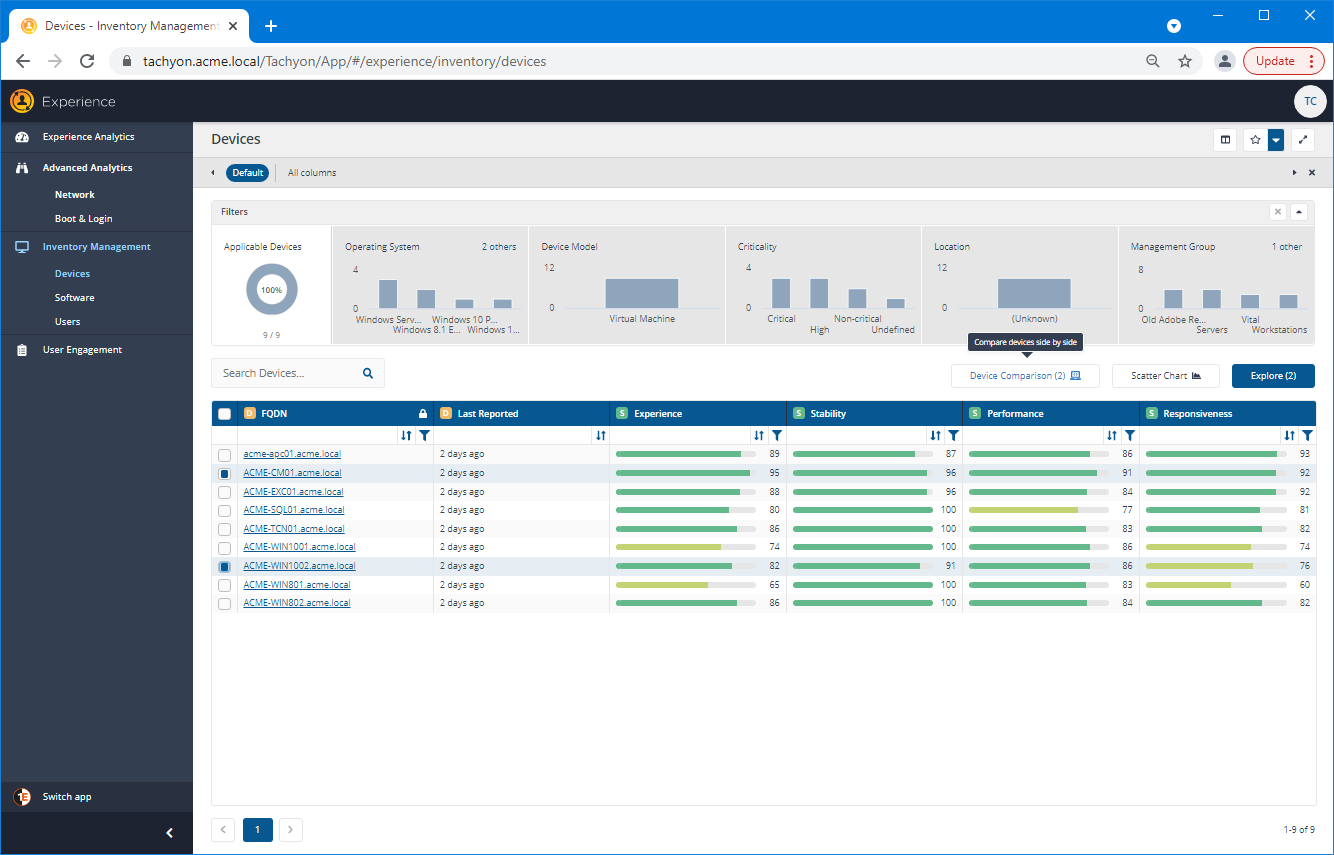
Selecting the devices with the lowest and highest UDP send times
On the Devices page, the EUC Manager selects the two devices they made a note of earlier, and then clicks the Device Comparison button.
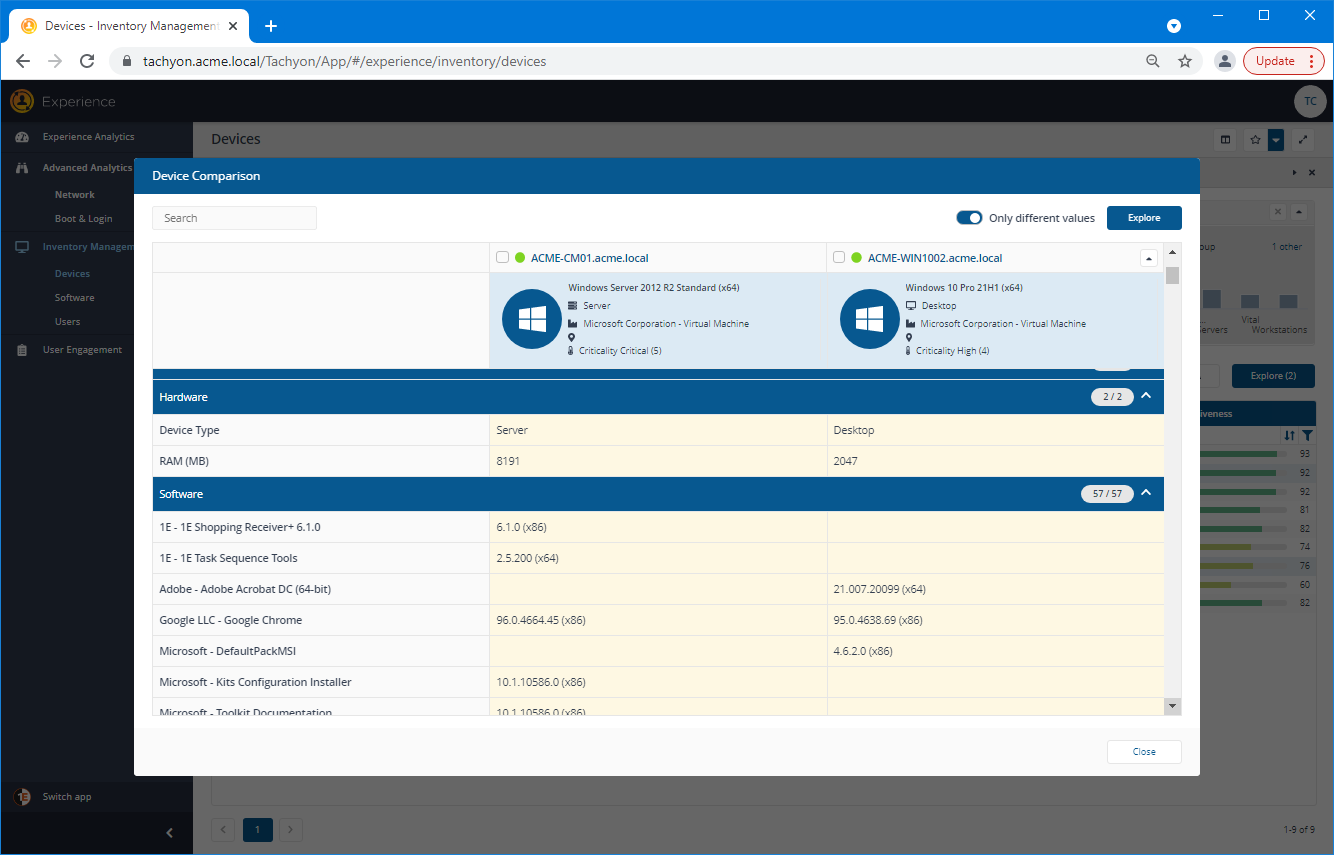
The Device Comparison popup set to display only different values
When the Device Comparison popup is displayed, the EUC manager first turns on the Only different values toggle - to concentrate on the differences. They can see that the two devices have different Operating Systems, which may or may not be significant.
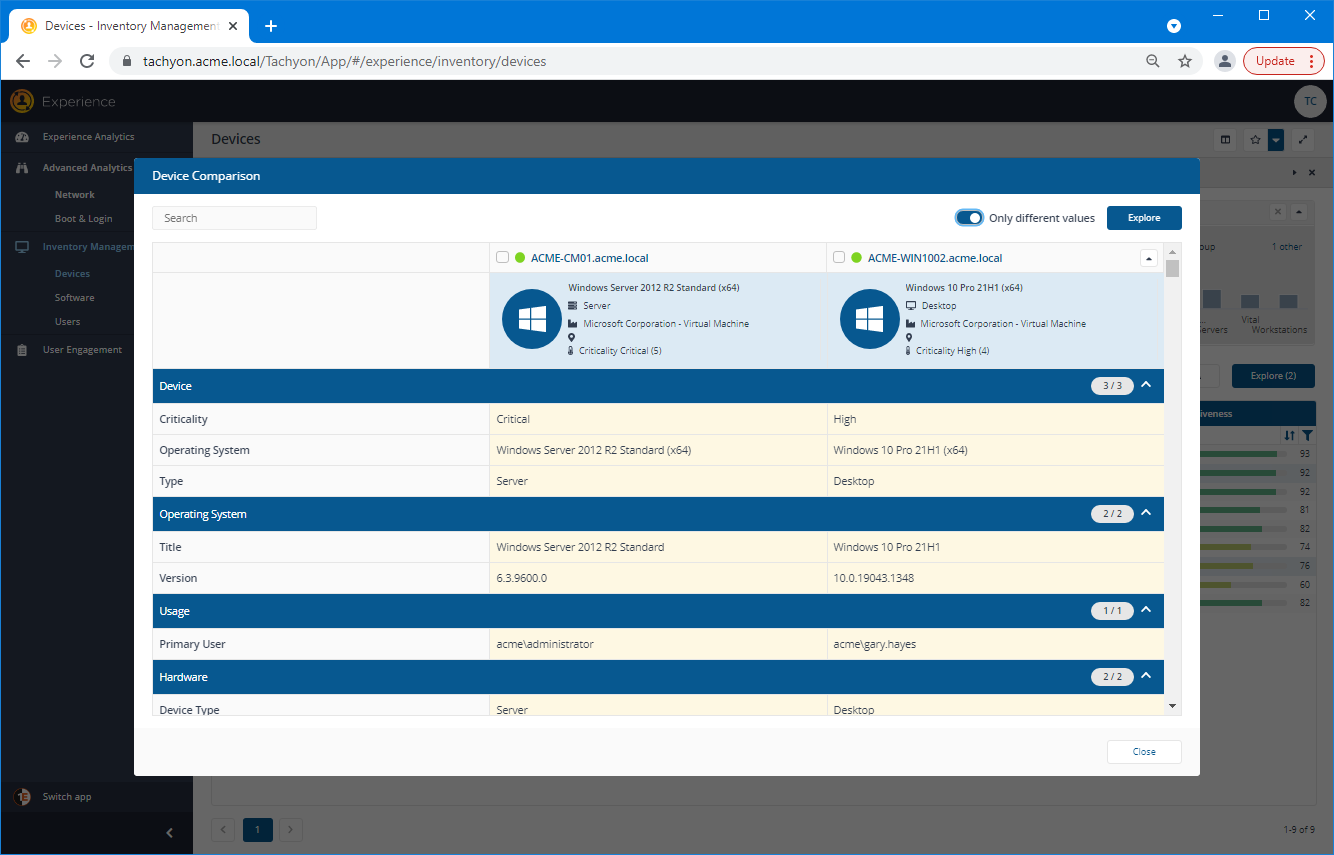
A possibly significant difference
Further down in the Hardware section, another, more significant difference is shown. Here, the EUC manager can see that the device with the best performing UDP send time score has 4 times as much RAM (MB) as the poorest one. As they know that these are both virtual devices, they conclude that this may be a contributing factor to the differences in throughput performances. The next step would be to test assigning more RAM to the device with the poorest UDP send time and see if this resolves the issue.