Software Inventory
Software Inventory shows data captured from sources such as Configuration Manager, Big Fix and vCenter if you have them configured.
The dashboard is refreshed (recalculated) when the page is opened or the page is refreshed in the browser.
Dashboard
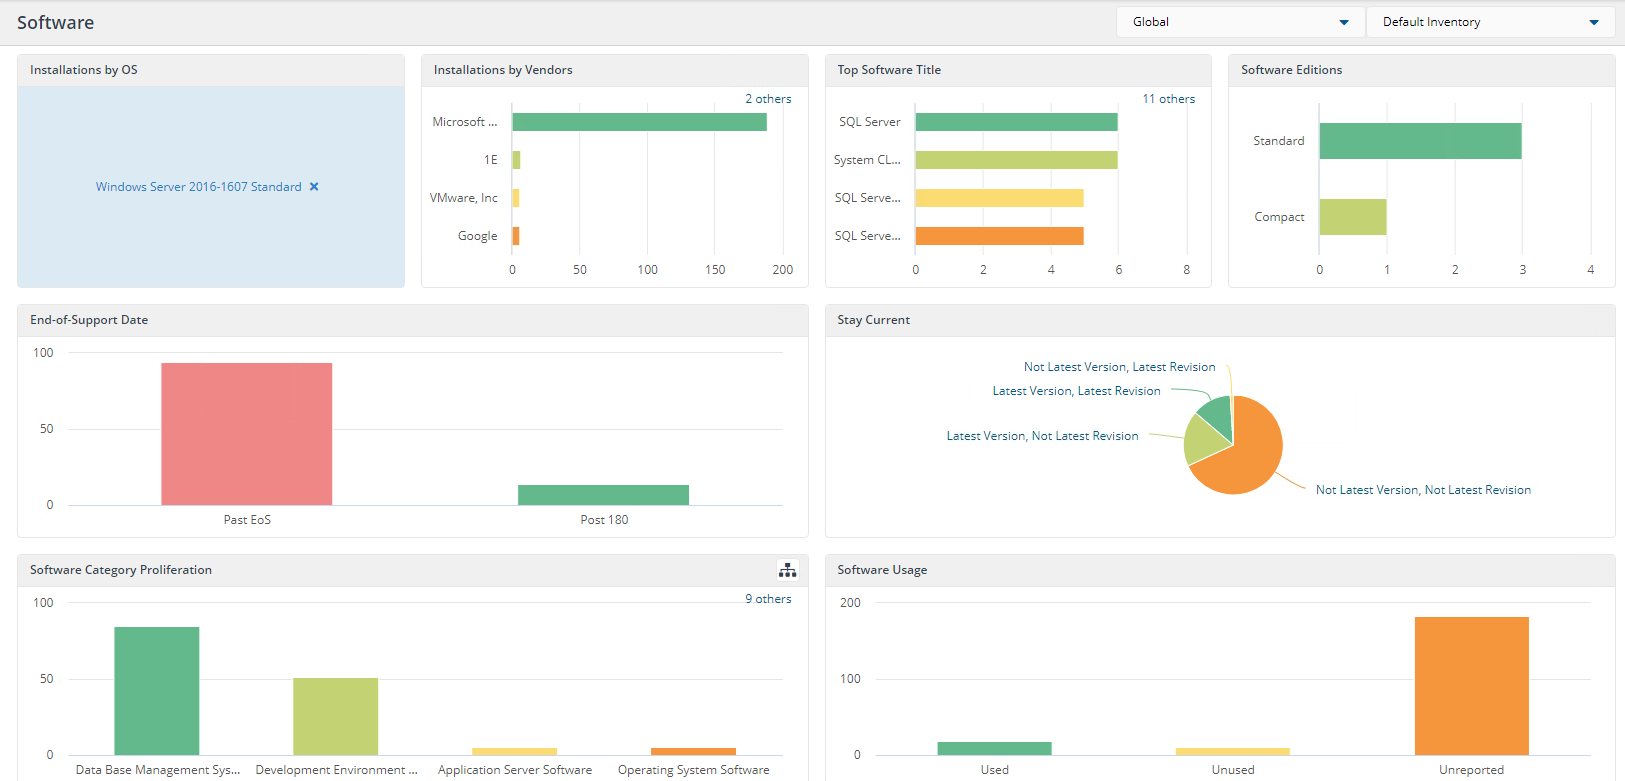
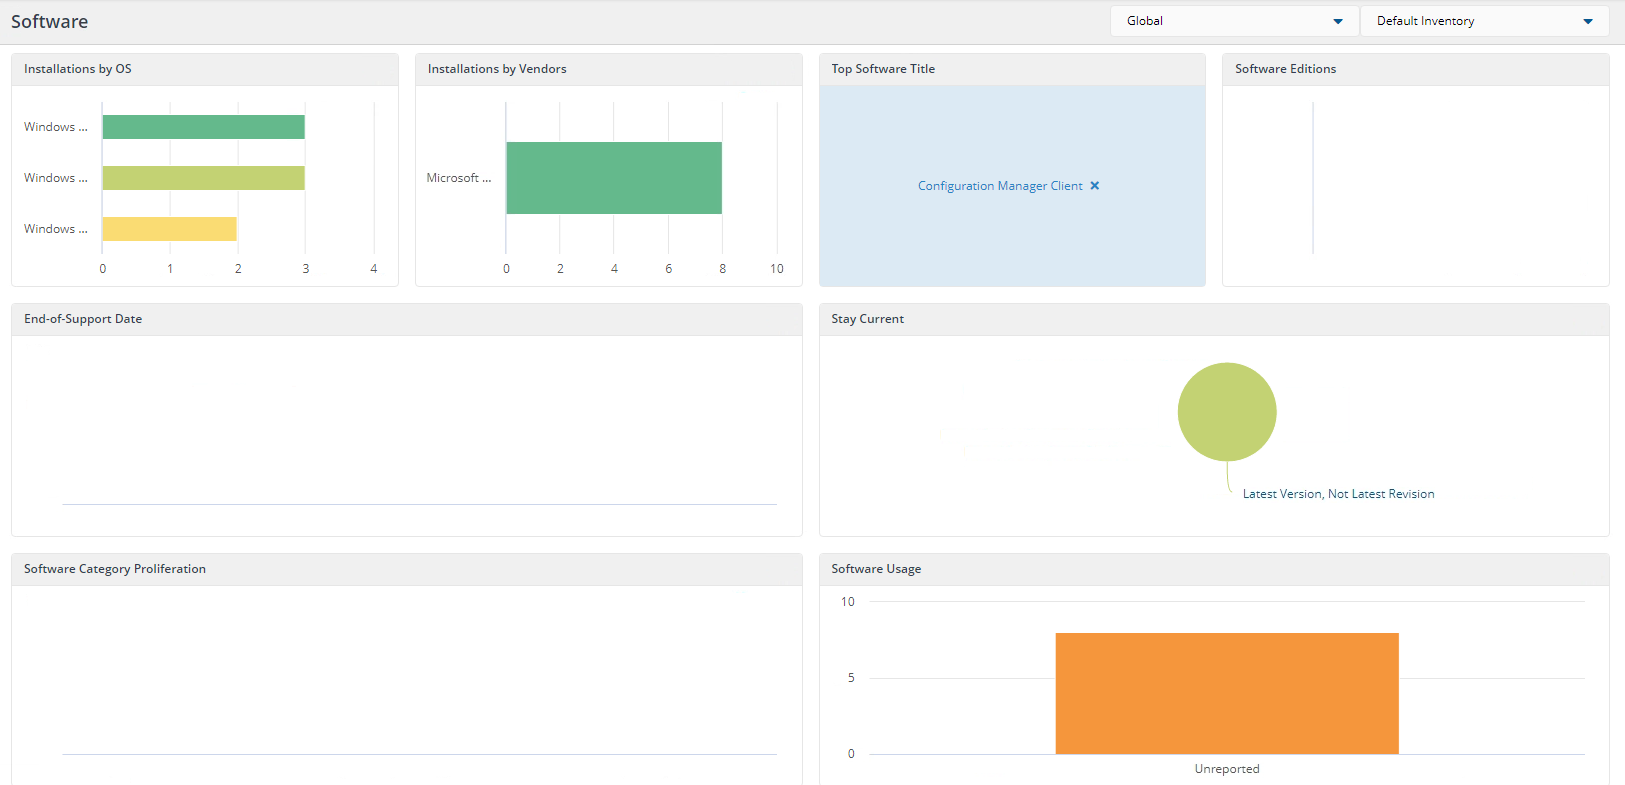
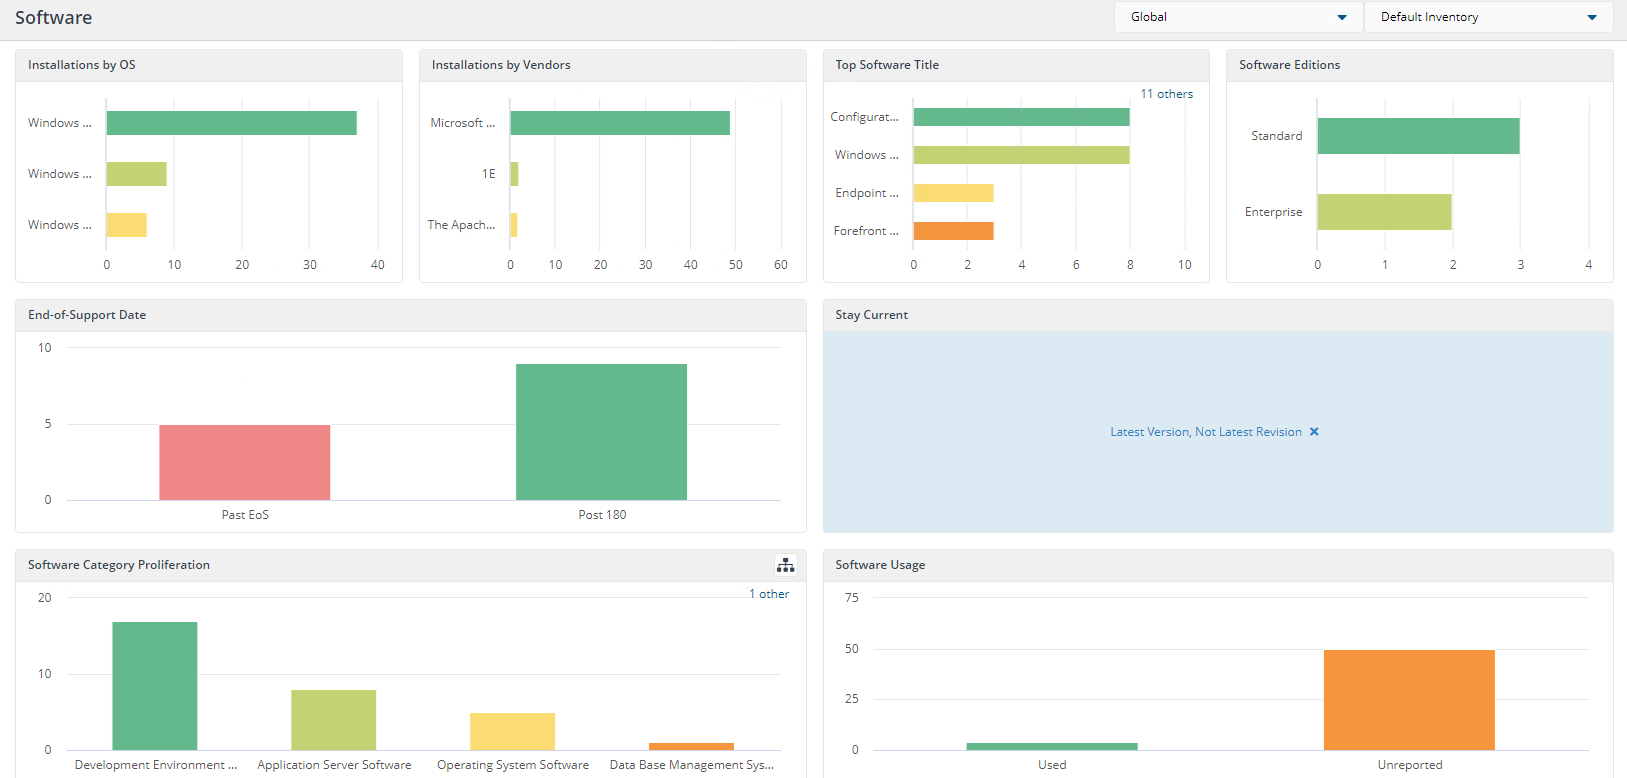
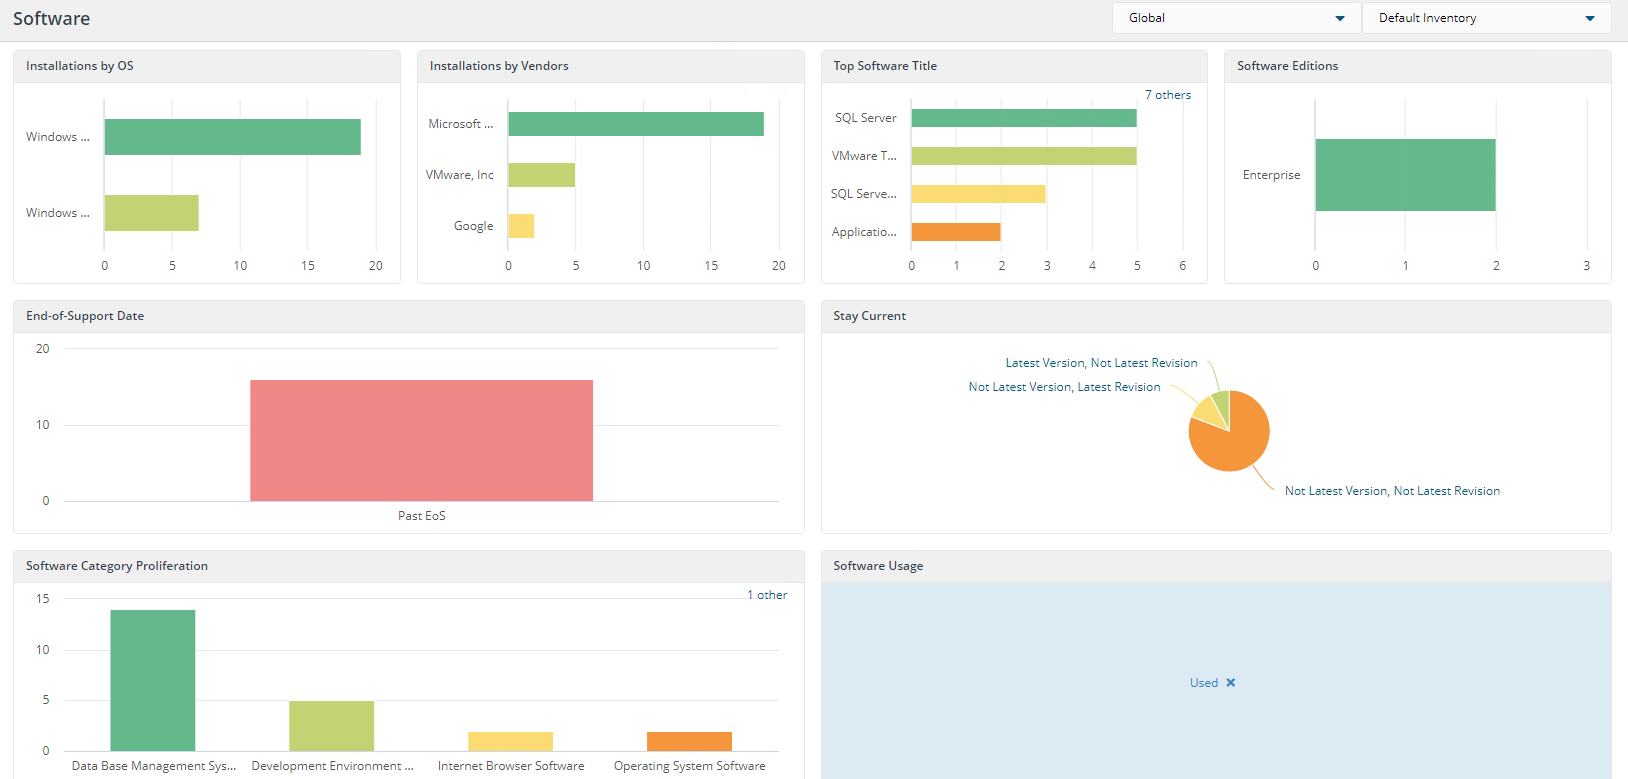
The dashboard page displays eight panels, reflecting the current Inventory.
The Software Inventory dashboard presents a number of panels:
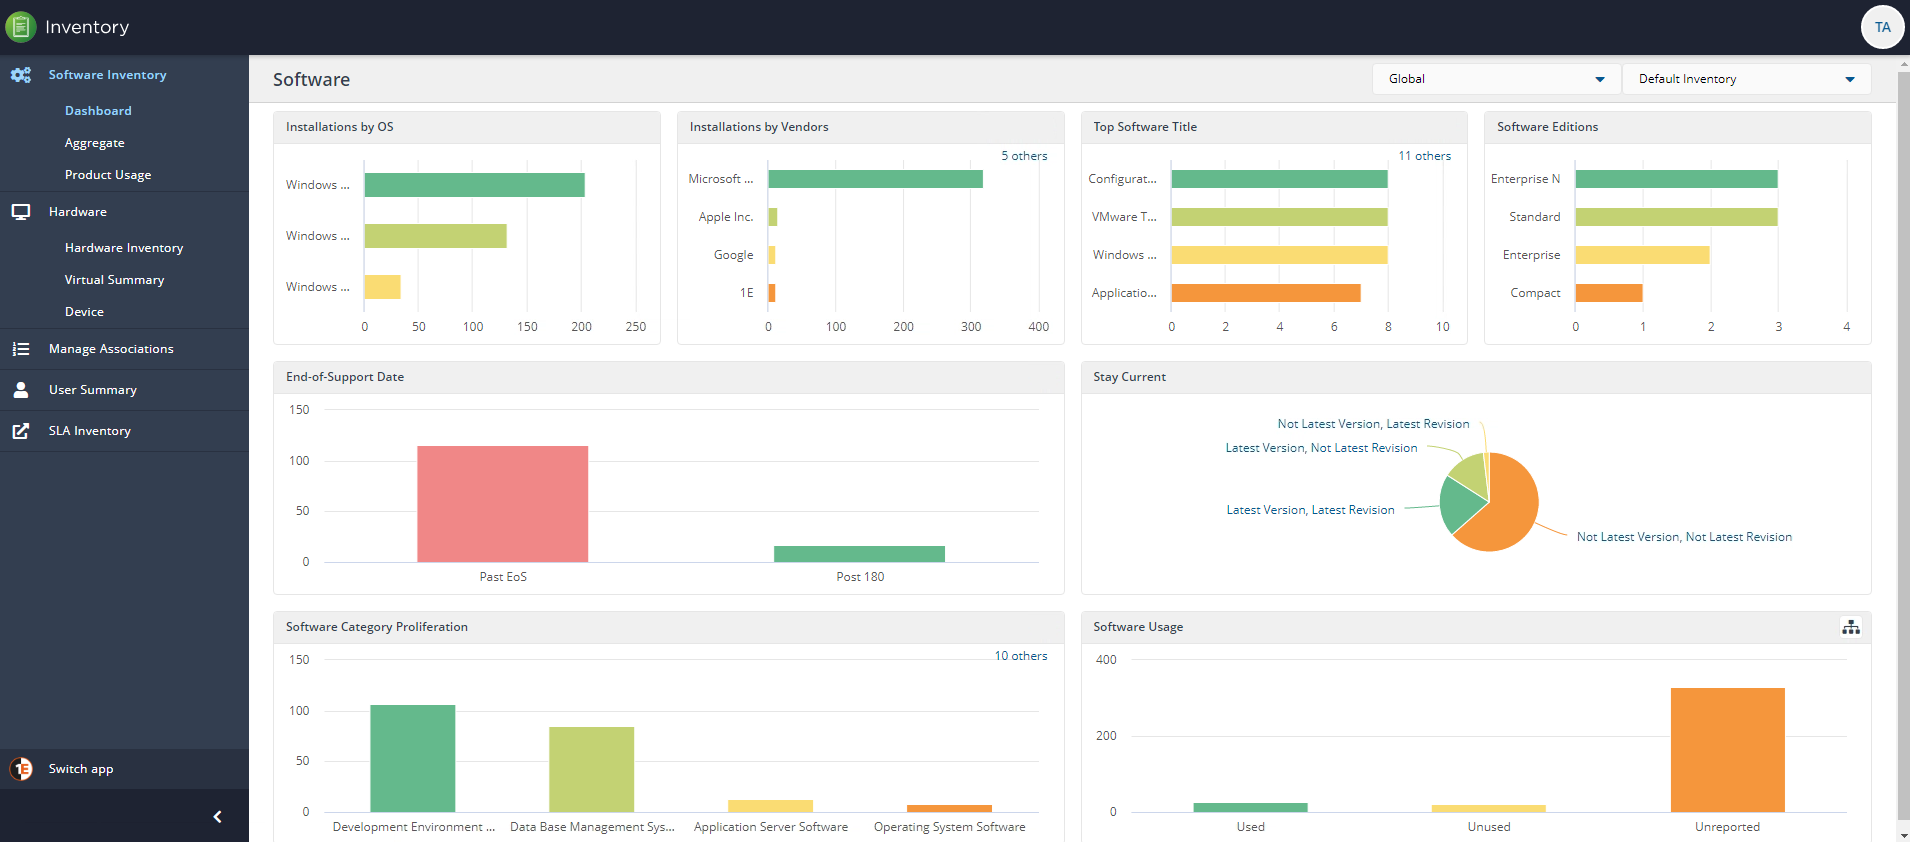
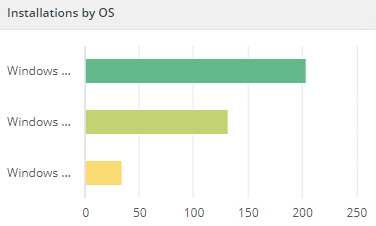
Installations by OS
This panel presents installations grouped by the operating system.
The user has the ability to drill down into each installation for each group by clicking on each color bar. This updates the other fields on the dashboard with data related to your choice. Our example shows details for Windows Server 2016-1607 Standard.
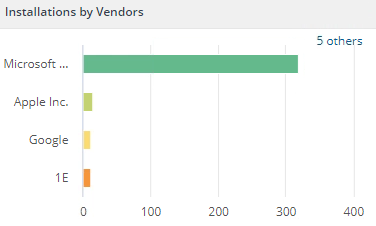
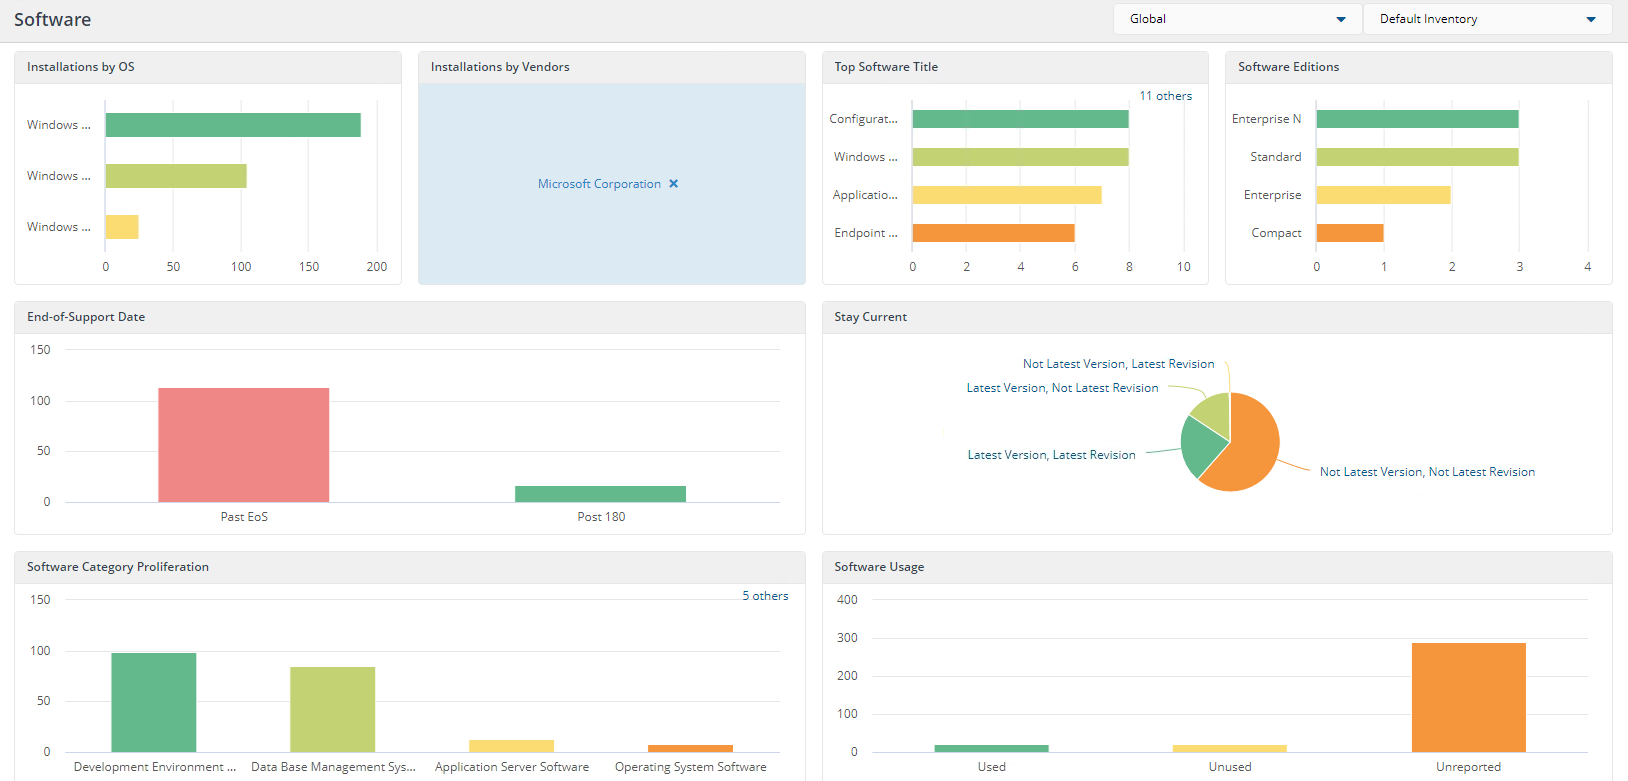
Installations by Vendors
This panel presents installations grouped by vendors.
The user has the ability to drill down into each installation for each group by clicking on each color bar. This updates the other fields on the dashboard with data related to your choice. Our example shows details for Microsoft Corporation.
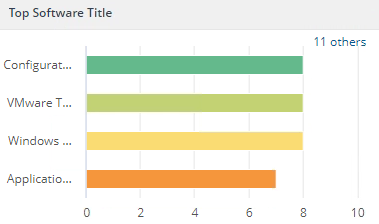
Top Software Title
This panel presents installations grouped by Top Software Title.
The user has the ability to drill down into each installation for each group by clicking on each color bar. This updates the other fields on the dashboard with data related to your choice. Our example shows details for Configuration Manager Client.
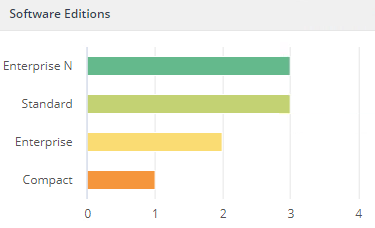
Software Editions
This panel presents installations grouped by Software Edition.
The user has the ability to drill down into each installation for each group by clicking on each color bar. This updates the other fields on the dashboard with data related to your choice. Our example shows details for Standard editions.
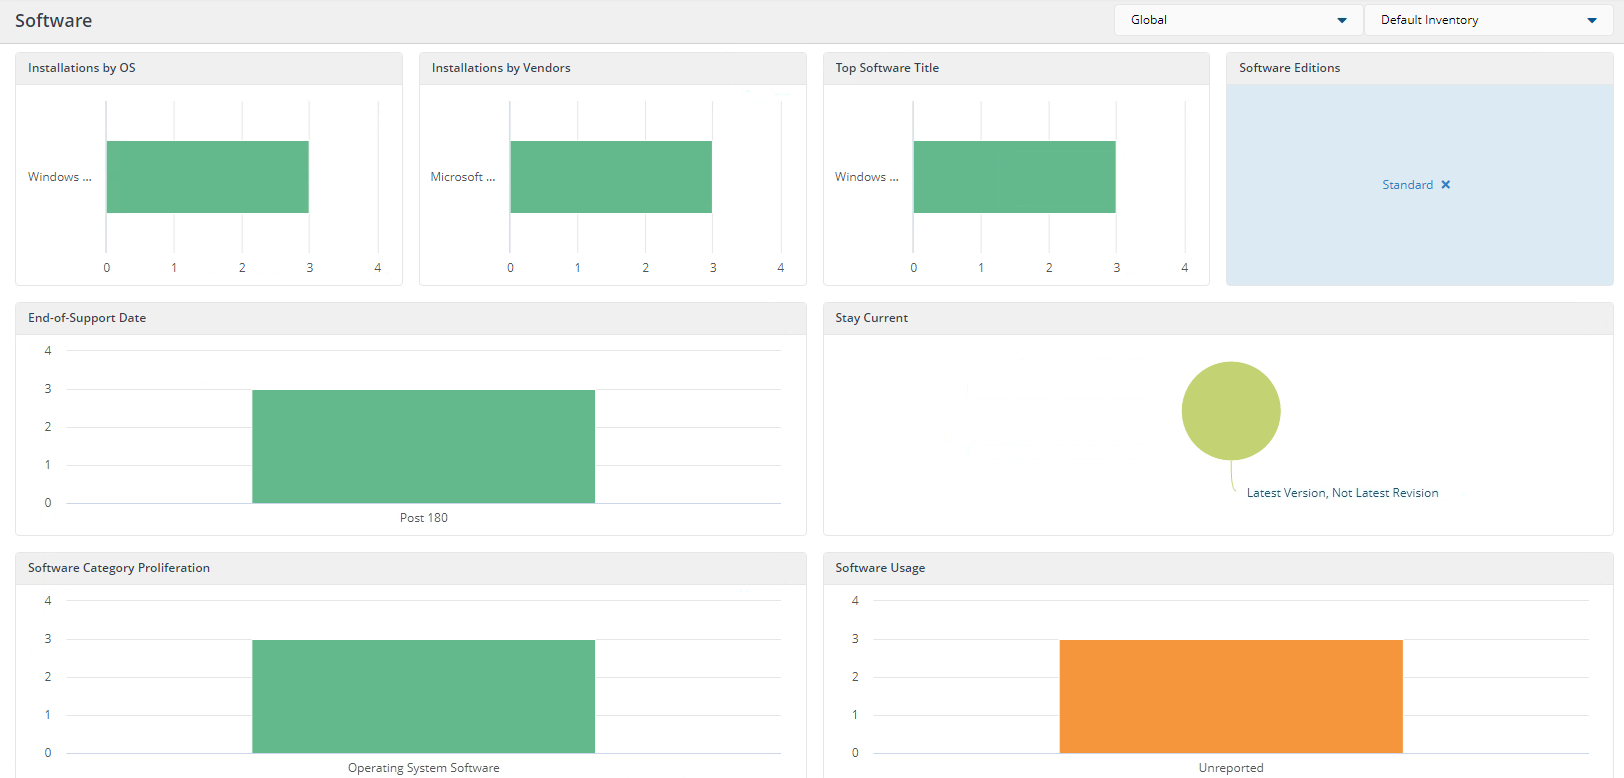
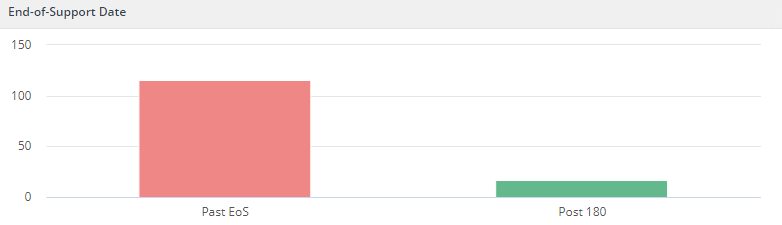
End-of-Support Date
This panel presents installations grouped by End-of-Support Date.
The user has the ability to drill down into each installation for each group by clicking on each color bar. This updates the other fields on the dashboard with data related to your choice. Our example shows details for Past EoS.
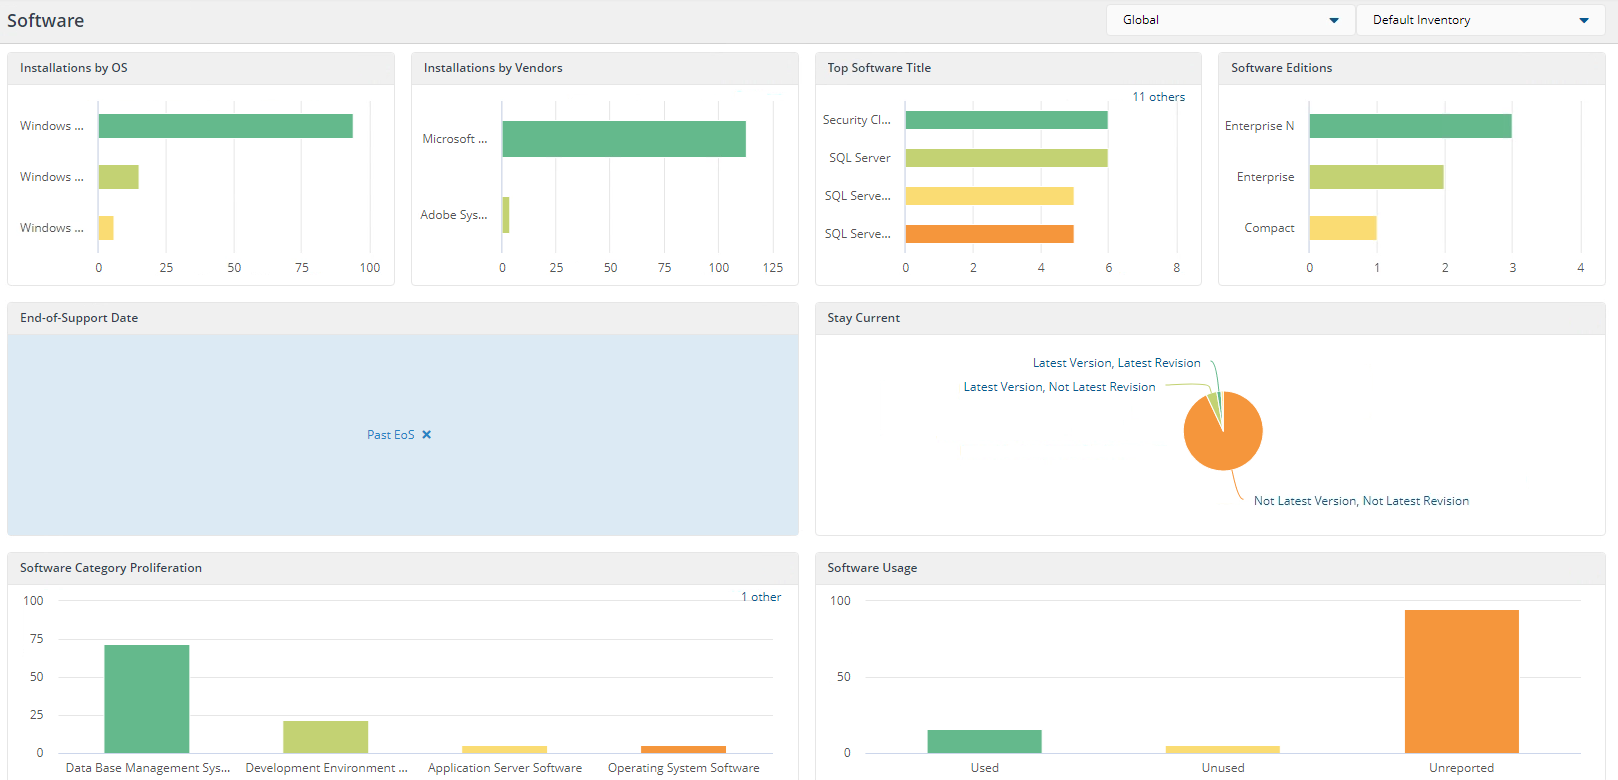
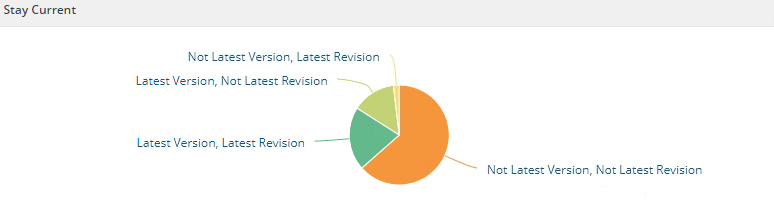
Stay Current
This panel presents installations grouped by Stay Current.
The user has the ability to drill down into each installation for each group by clicking on each color segment. This updates the other fields on the dashboard with data related to your choice. Our example shows details for Latest Version, Not Latest Revision.
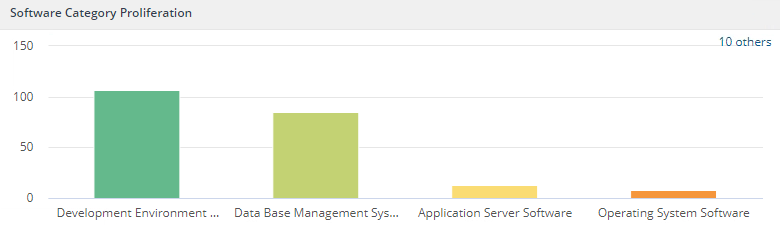
Software Category Proliferation
This panel presents installations grouped by Software Category Proliferation.
The user has the ability to drill down into each installation for each group by clicking on each color bar. This updates the other fields on the dashboard with data related to your choice. Our example shows details for Development Environment Software.
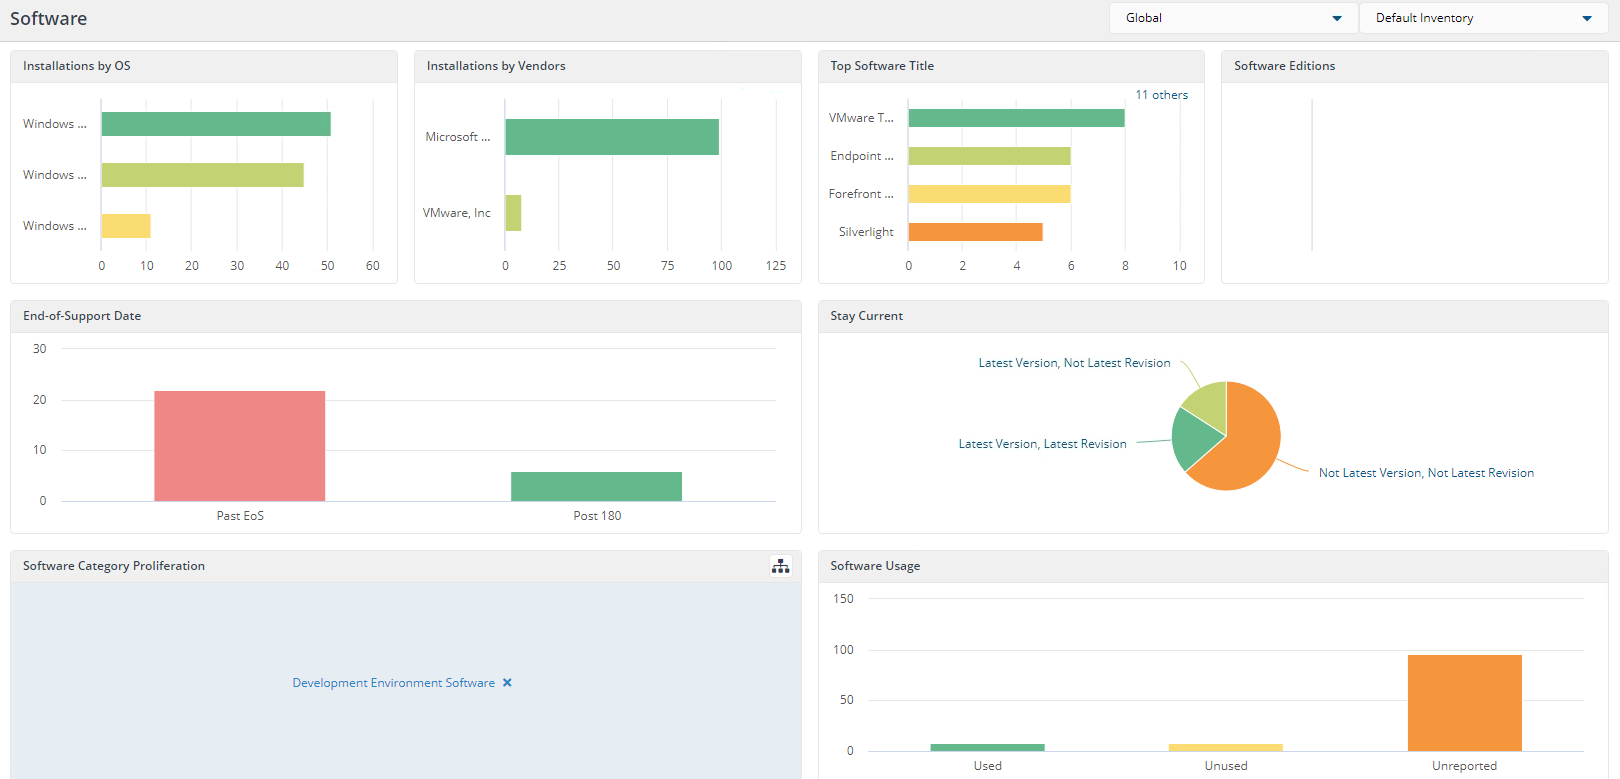
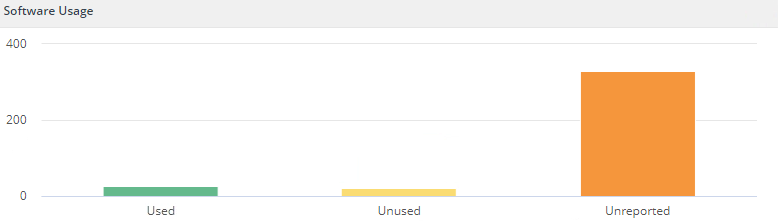
Software Usage
This panel presents installations grouped by Software Usage.
The user has the ability to drill down into each installation for each group by clicking on each color bar. This updates the other fields on the dashboard with data related to your choice. Our example shows details for Used.
 |
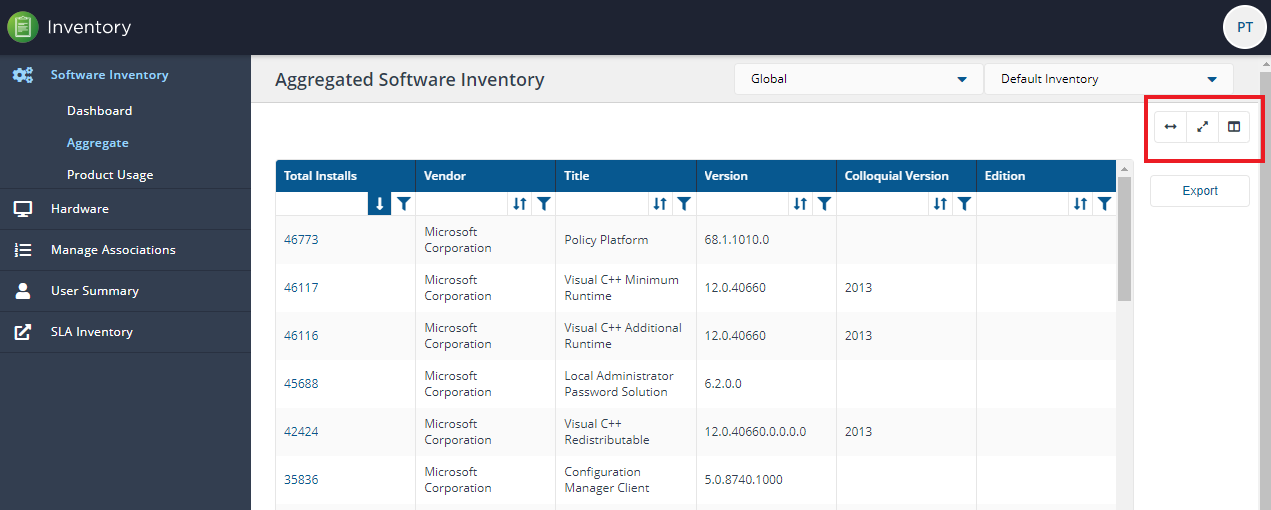
Aggregate
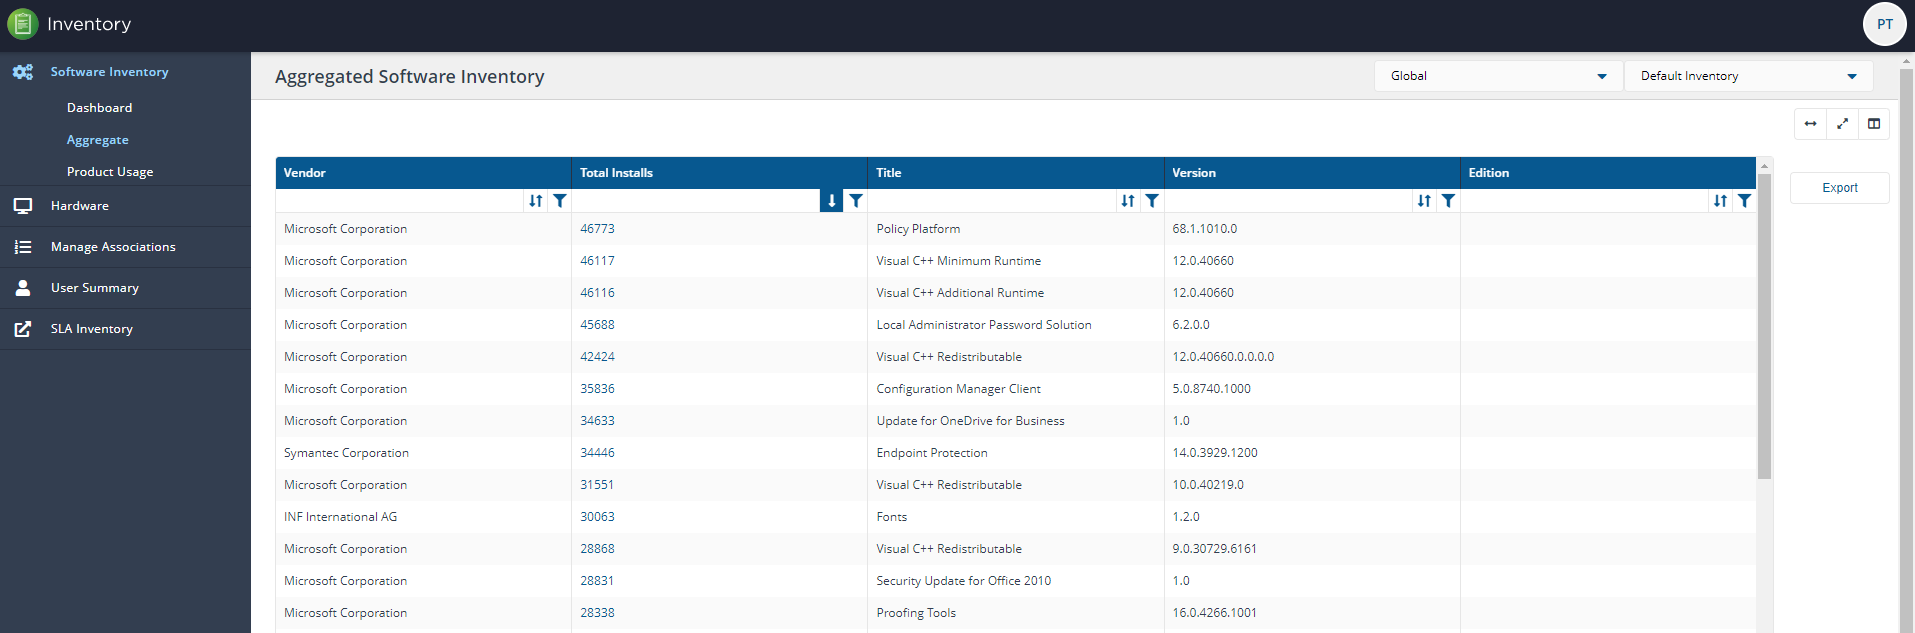
The Aggregated Software Inventory page shows a list of all software gathered using Configuration Manager software inventory.
In the top right of the page in line with the screen title are two dropdown lists, Global and Default Inventory. If you select the Global dropdown list and look at the available options, you'll see listed any additional Management groups you have configured.
If you have multiple Management Groups, choose each option and see how the display changes to show the software installed on each Management group, you may need to scroll to see all the groups. To find out more about Management Groups refer to the Management Groups page. If you have configured more than one Inventory, they will be available to choose from the Default Inventory dropdown list.
Note
You can choose which columns are displayed in some detail tables to increase readability. On pages where you can pick the displayed columns you'll see a new control like the one below:

To find out more about this feature refer to Choosing the columns displayed in reports.
The following table shows the available Aggregated Software Inventory columns, not all columns are displayed by default. You can add other columns or remove them using the column chooser control.
Column | Description | Displayed by default |
|---|---|---|
Vendor | The software vendor. | Yes |
Title | The software title. | Yes |
Version | The version of the software installed. | Yes |
Colloquial Version | If known or exists, the Colloquial version is installed. | Yes |
Edition | The edition installed. | Yes |
Total Installs | The number of times the software has been installed on the estate. | Yes |
Latest Known Version | The latest version was discovered using AI matching. | No |
Category | Category information is set in Configuration Manager. | No |
End Date | If provided, the end date for the License. | No |
Licensable | Yes or No if the software is Licensed. | No |
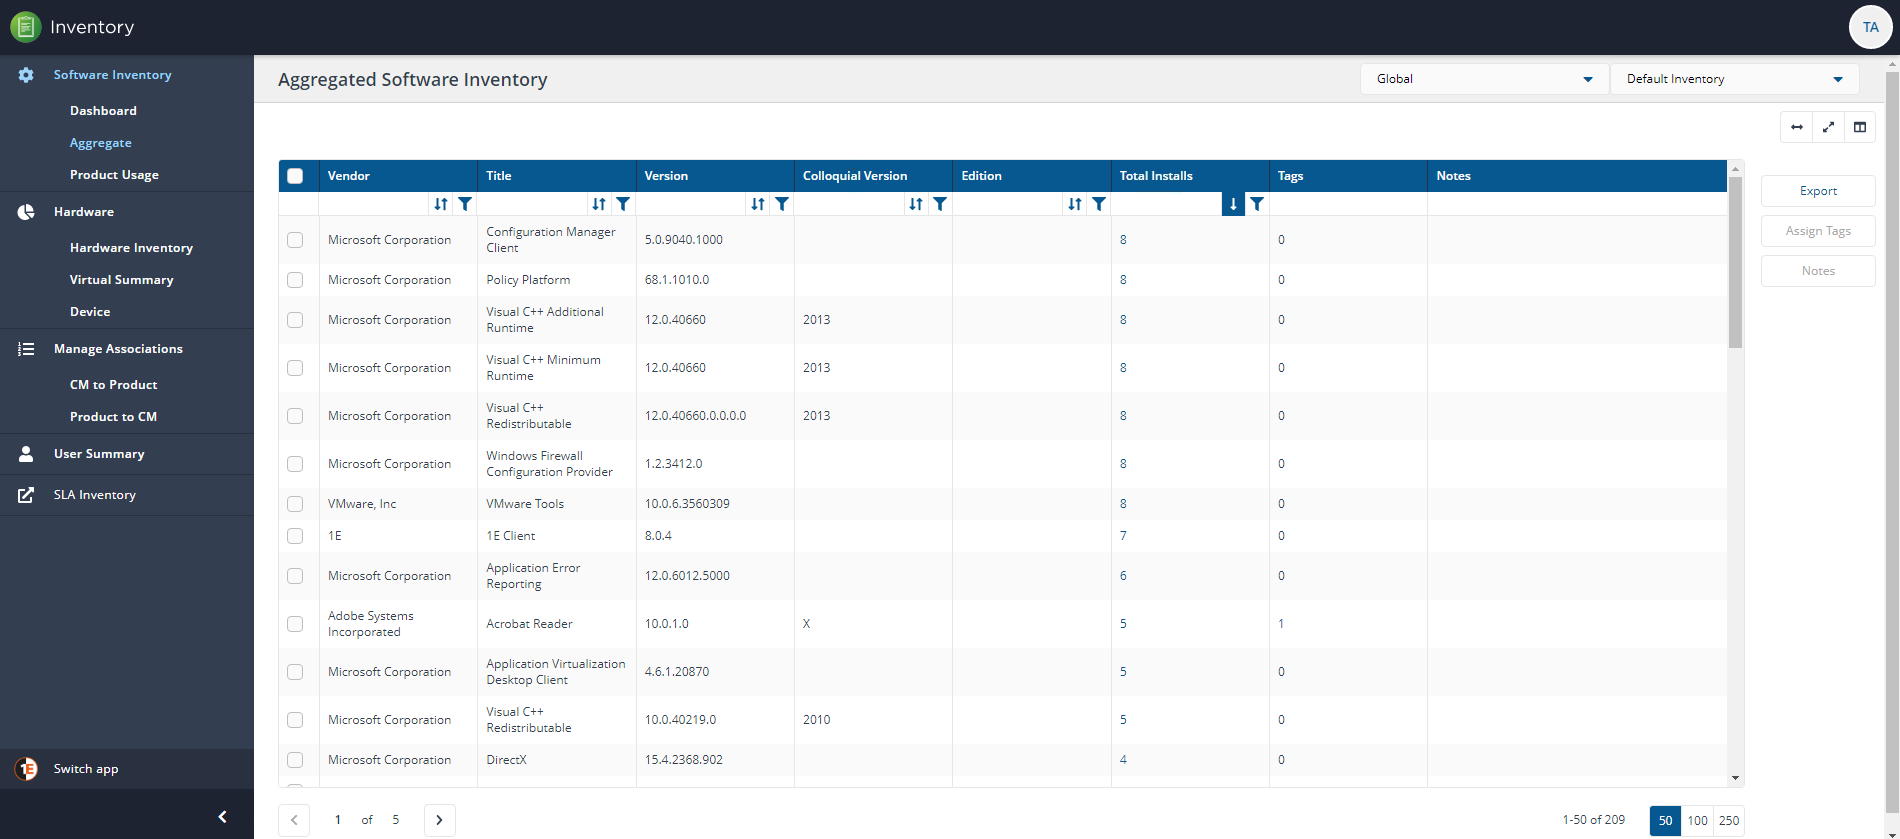
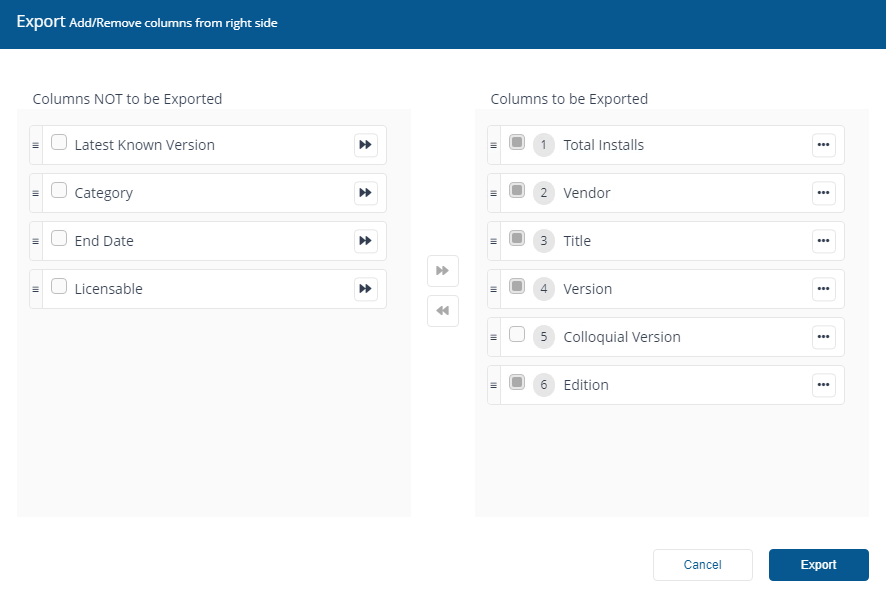
Export
You can use the Export button to export currently displayed data in a downloadable report.
When you click on the Export button you'll see the Export popup. You can choose which columns to export in the same way you can choose columns to display in the main report panel.
The report is exported in a .TSV format, for example, AggregatedSoftwareInventory_20200813095415.tsv. The file is exported and downloaded to the default location for the browser you are using.
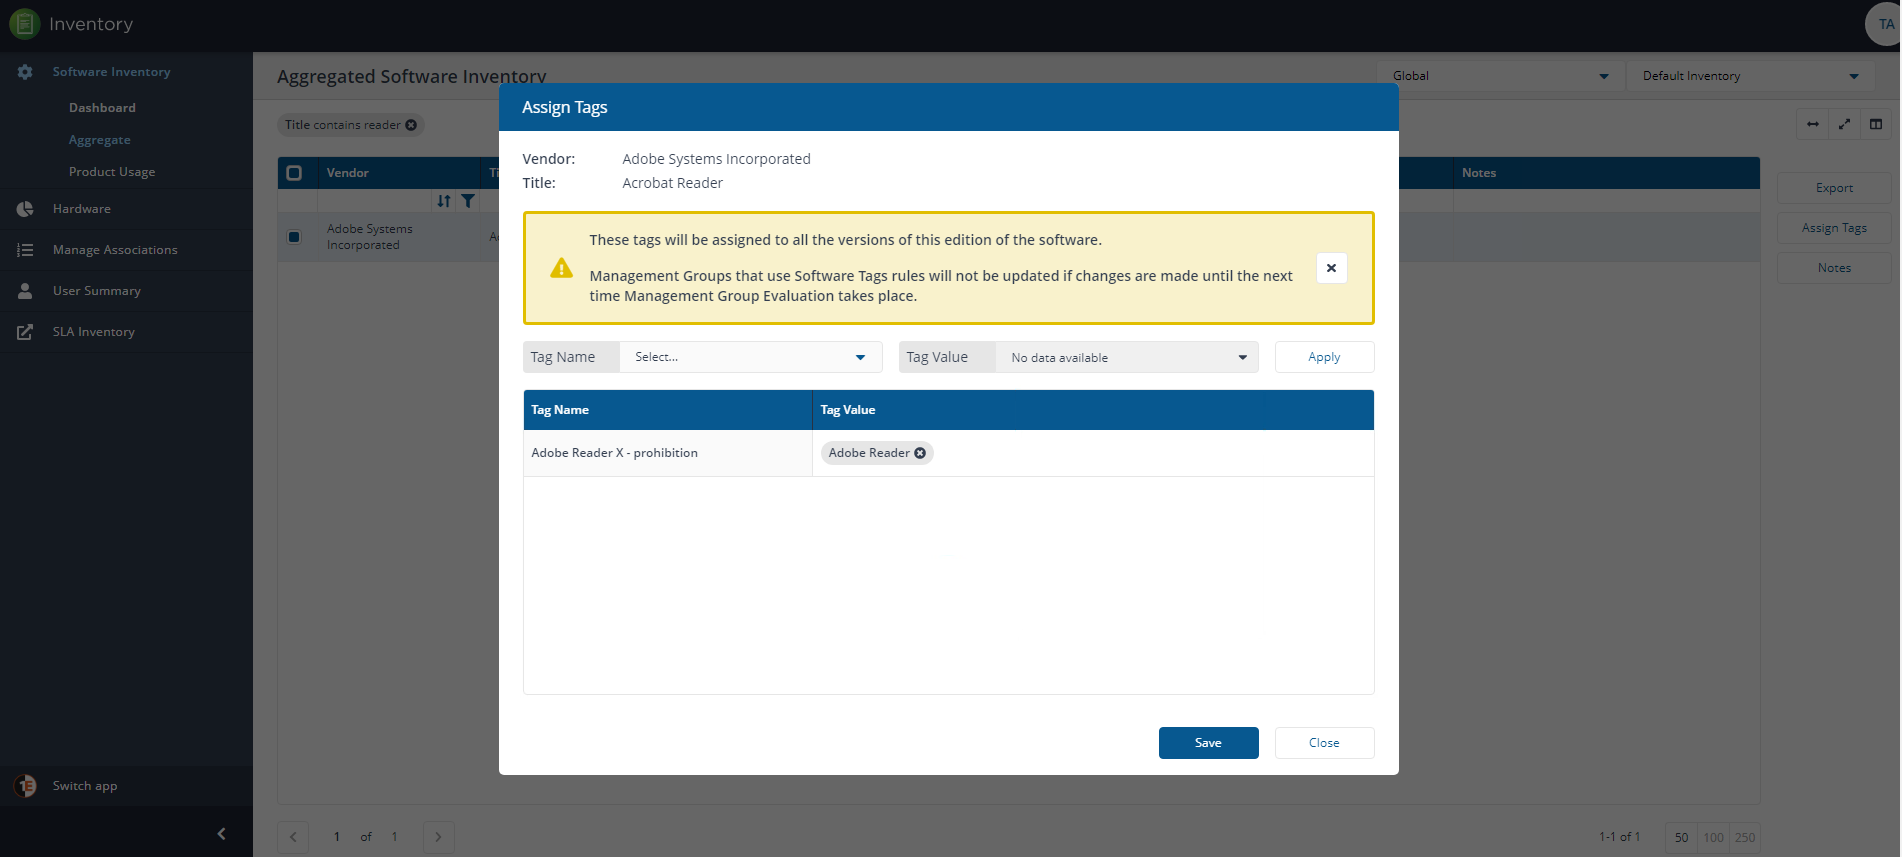
Assign Tags
Using Software Tags allows you to create custom labels and associate them with the software titles you have deployed in your estate. An administrator with either the Full Administrator or Group Administrator role can set Software Tags in their environment, they can also create Management Groups based on the tag name and value. For details about configuring Users, Roles, and Management Groups refer to the Permissions Menu pages.
In short, you can work with Software tags by:
Creating your Software Tag.
Associating the new tag with a software title.
Creating a Management Group based on the Software Tag name and Tag value rules (This step can be run anytime before an evaluation).
Evaluating the new Management Group by running a Basic Inventory Consolidation.
If an administrator adds or modifies Software Tags or associations, they will have to run the Management Group evaluation report again to see the updated devices reflected in the Inventory.
To find out more about using Software Tags, refer to the Software Tags page.
Notes
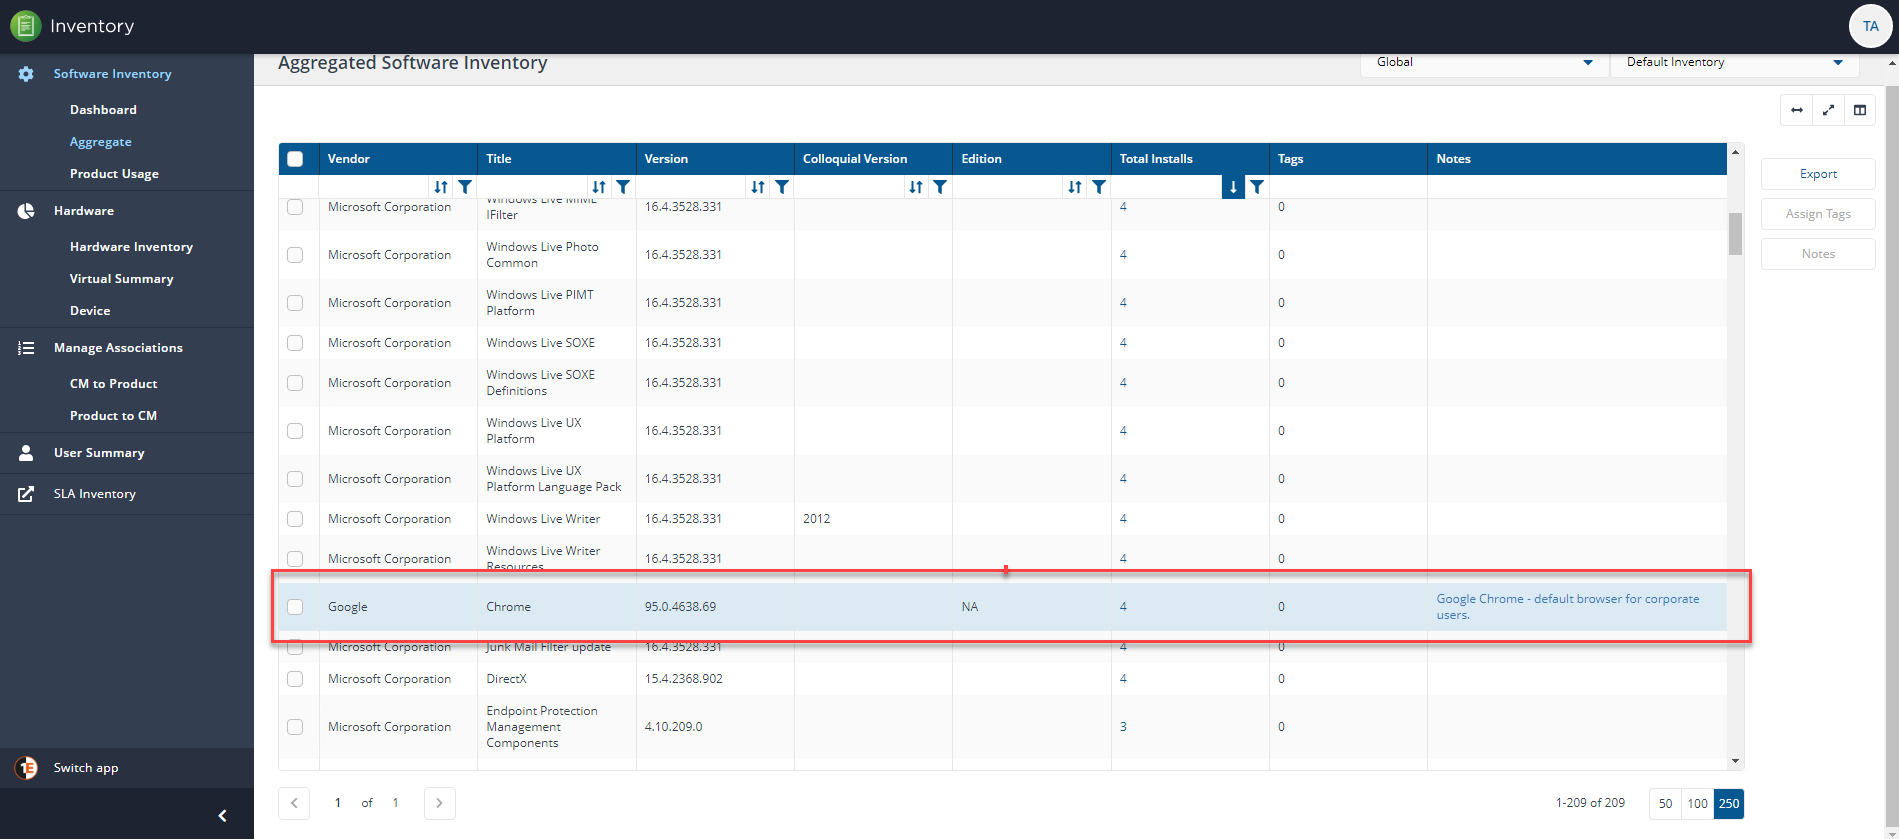
An important feature of software management is to provide additional information for each software title.
From Inventory 8.0 you can add notes which allow you to add additional information for each software title. Software notes are a simple text field that can be added to any software title as required.
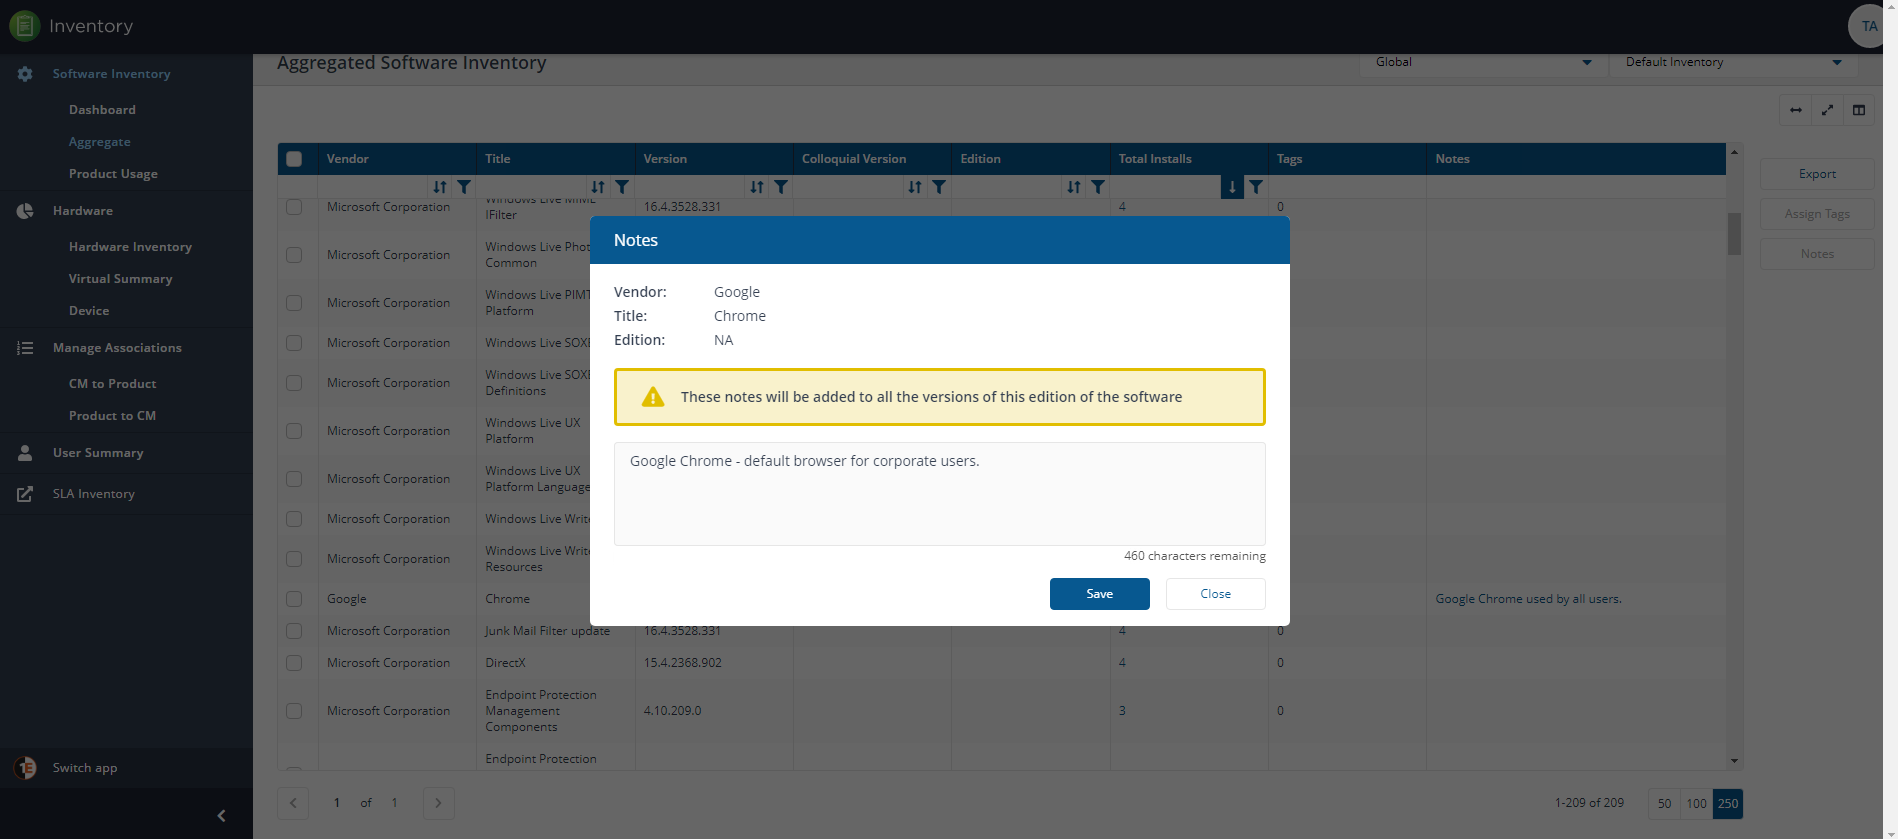
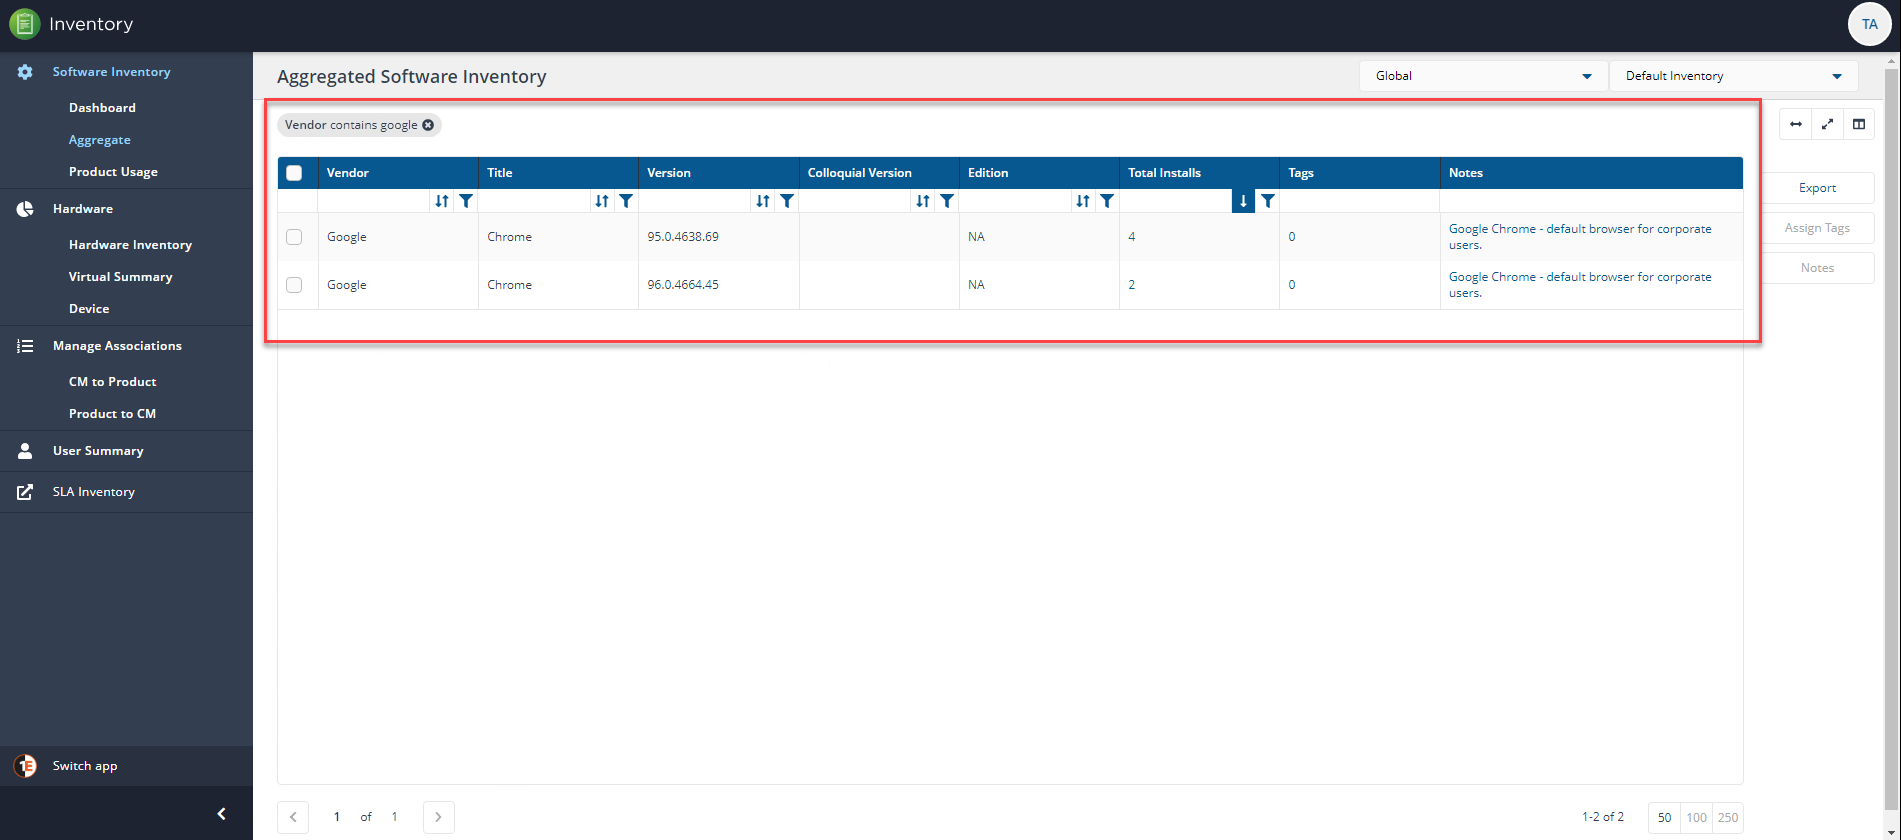
You can add a note to each title, and it will be added to every version of that software edition. In our example, we applied a note to Google Chrome v95.0.4638.69.
But as the note applies to all versions of Google Chrome when we filter Aggregated Software Inventory by Vendor contains google, we can see that our note was also applied to Google Chrome v95.0.4664.45.
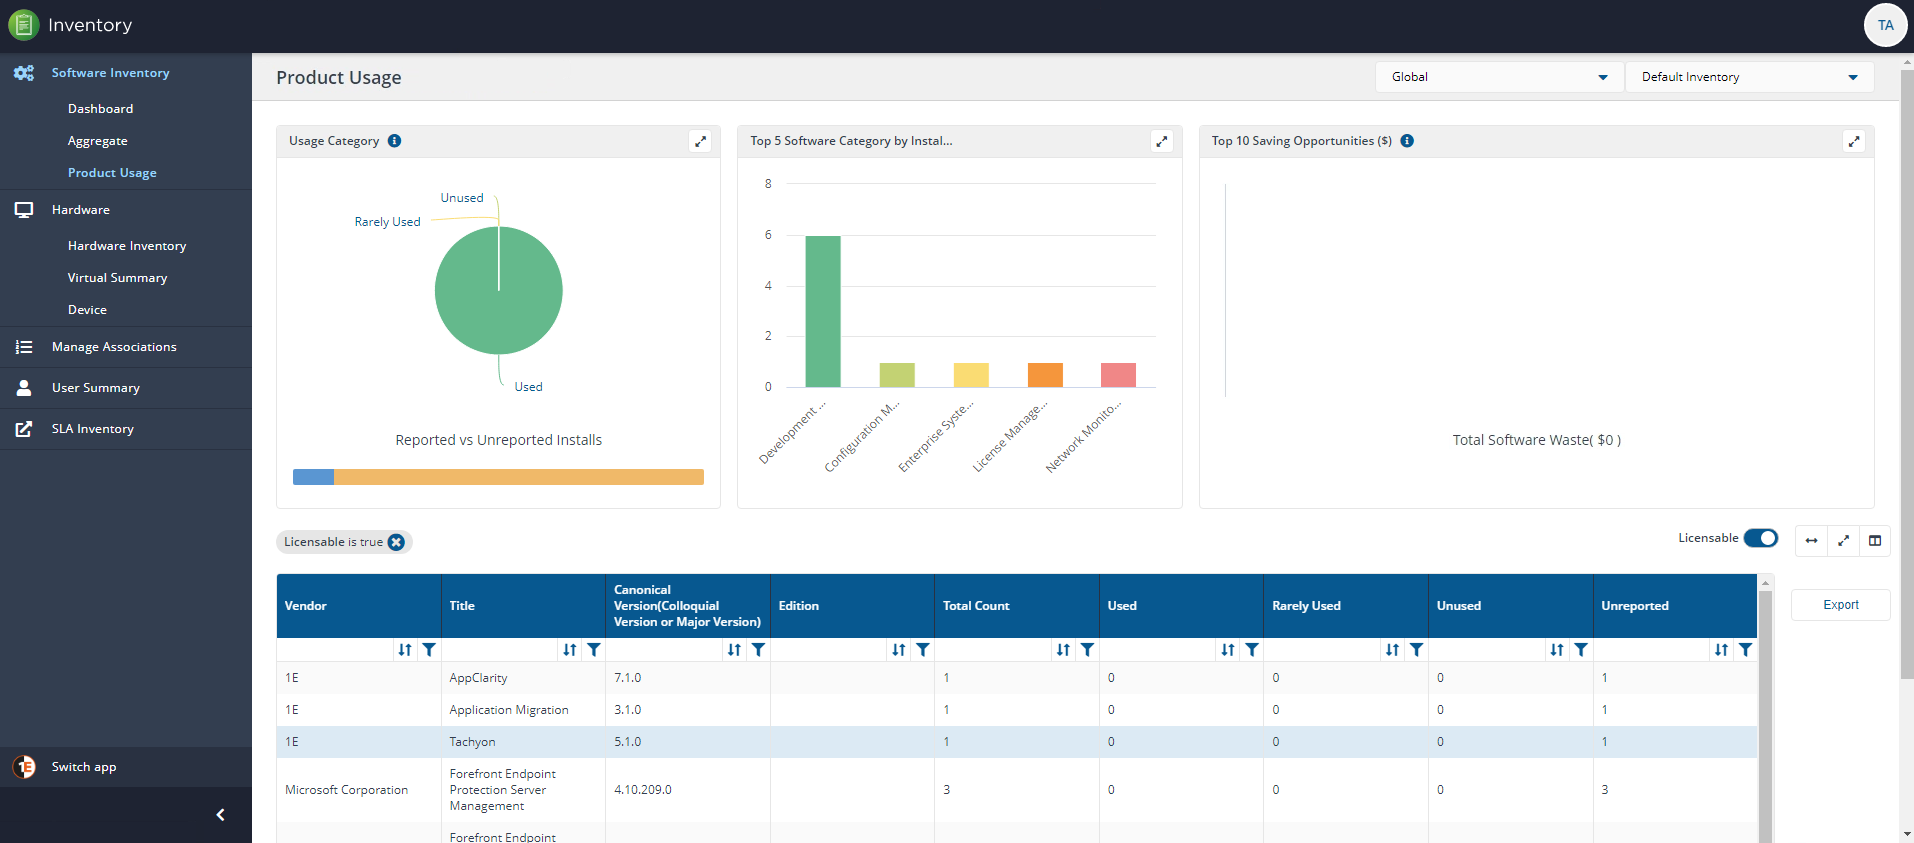
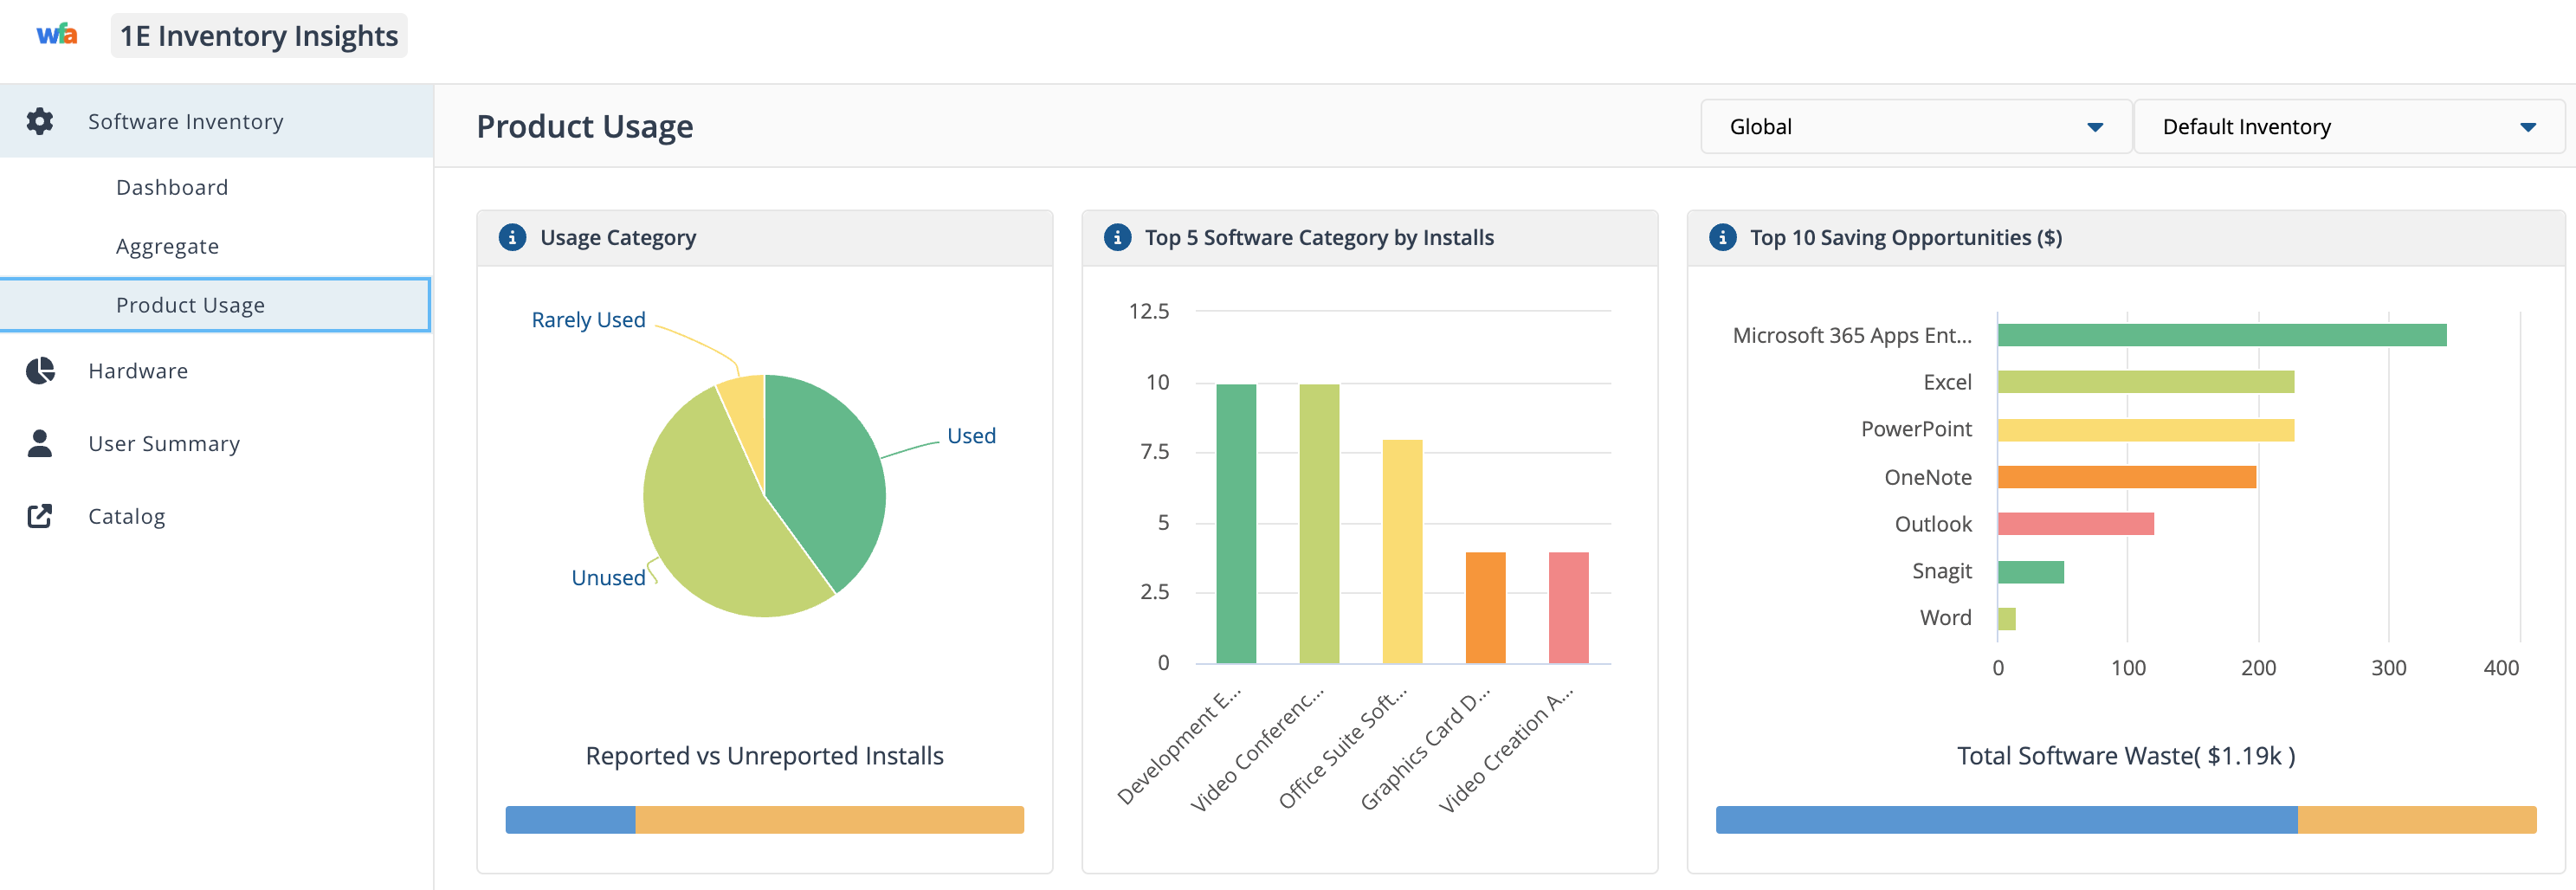
Product Usage
The Product Usage page shows the distribution of software installs, the top five categories by install and top saving opportunities across your software estate.
In the top right of the page in line with the screen title are two dropdown lists, Global and Default Inventory. If you select the Global dropdown list and look at the available options, you'll see any Management groups you have configured listed there.
If you have multiple Management Groups, choose each option and see how the display changes to show the software installed on each Management group, you may need to scroll to see all the groups. To find out more about Management Groups refer to the Management Groups page. If you have configured more than one Inventory they will be available to choose from the Default Inventory dropdown list.
By clicking each colored bar and segment in the three top panels you can narrow the view to only those related products. The table below the top panels is then dynamically updated with these results which are exportable to a downloadable .TSV format. For both the displayed table and the exported file you can choose which columns are shown and exported.
Note
You can choose which columns are displayed in some detail tables to increase readability. On pages where you can pick the displayed columns you'll see a new control like the one below:
To find out more about this feature refer to Choosing the columns displayed in reports.
Available Product Inventory columns:
Column | Description |
|---|---|
Vendor | The software vendor. |
Title | The software title. |
Canonical Version (Colloquial Version or Major Version) | If known or exists the Colloquial version is installed. |
Edition | The edition installed. |
Total Count | Total count per software title. |
Used | Total count of used instances of a title. |
Rarely Used | Installs are categorized as rarely used. |
Unused | Installs are categorized as unused. |
Unreported | Total count of titles where usage information is unavailable. |
Price per Unit (USD) | The price per title is shown in the default currency. |
Licensable | Yes or No if the software is Licensed. |
Software Category | Category information is set in Configuration Manager. |
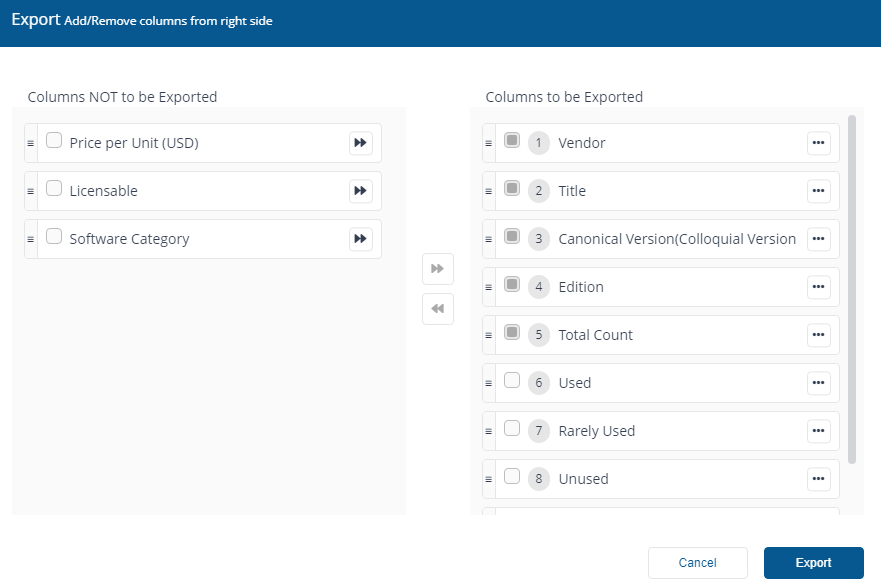
You can use the Export button to export currently displayed data in a downloadable report.
When you click on the Export button you'll see the Export popup. You can choose which columns to export in the same way you can choose columns to display in the main report panel.
The report is exported in a .TSV format, for example, InventoryProductUsage_20200813102621.tsv and is downloaded to the browser's download folder.
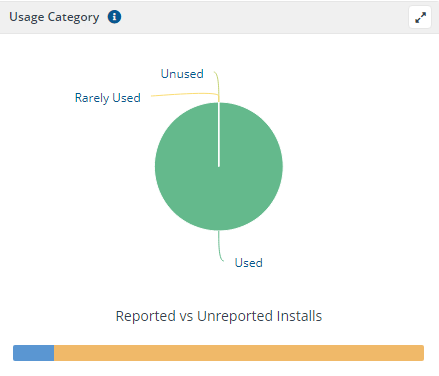
Usage Category
The pie chart shows the distribution of installs Used, Rarely used, and Unused as a percentage of total installs that report usage (i.e. Total Reported Installs). The bar at the bottom shows the distribution of installs as Reported and Unreported as a percentage of Total Installs.
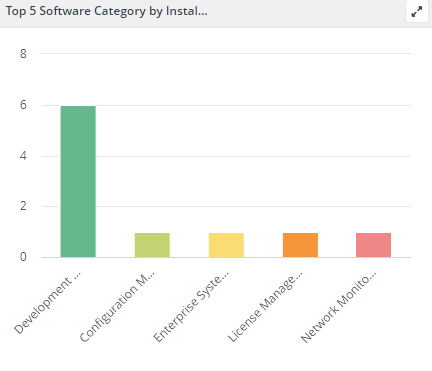
Top 5 Software Category by installation
The bar chart shows the top five categories by installs. The chart ignores operating systems and internet browser categories for calculating the top five categories.
Top 10 Saving Opportunities ($)
The bar chart shows the top ten products offering maximum saving opportunities in USD. The calculation is based on multiplying a product's unit price and the sum of Unused and Rarely Used installs. The bar at the bottom shows the total opportunity in USD, segregated from Unused and Rarely Used installs.
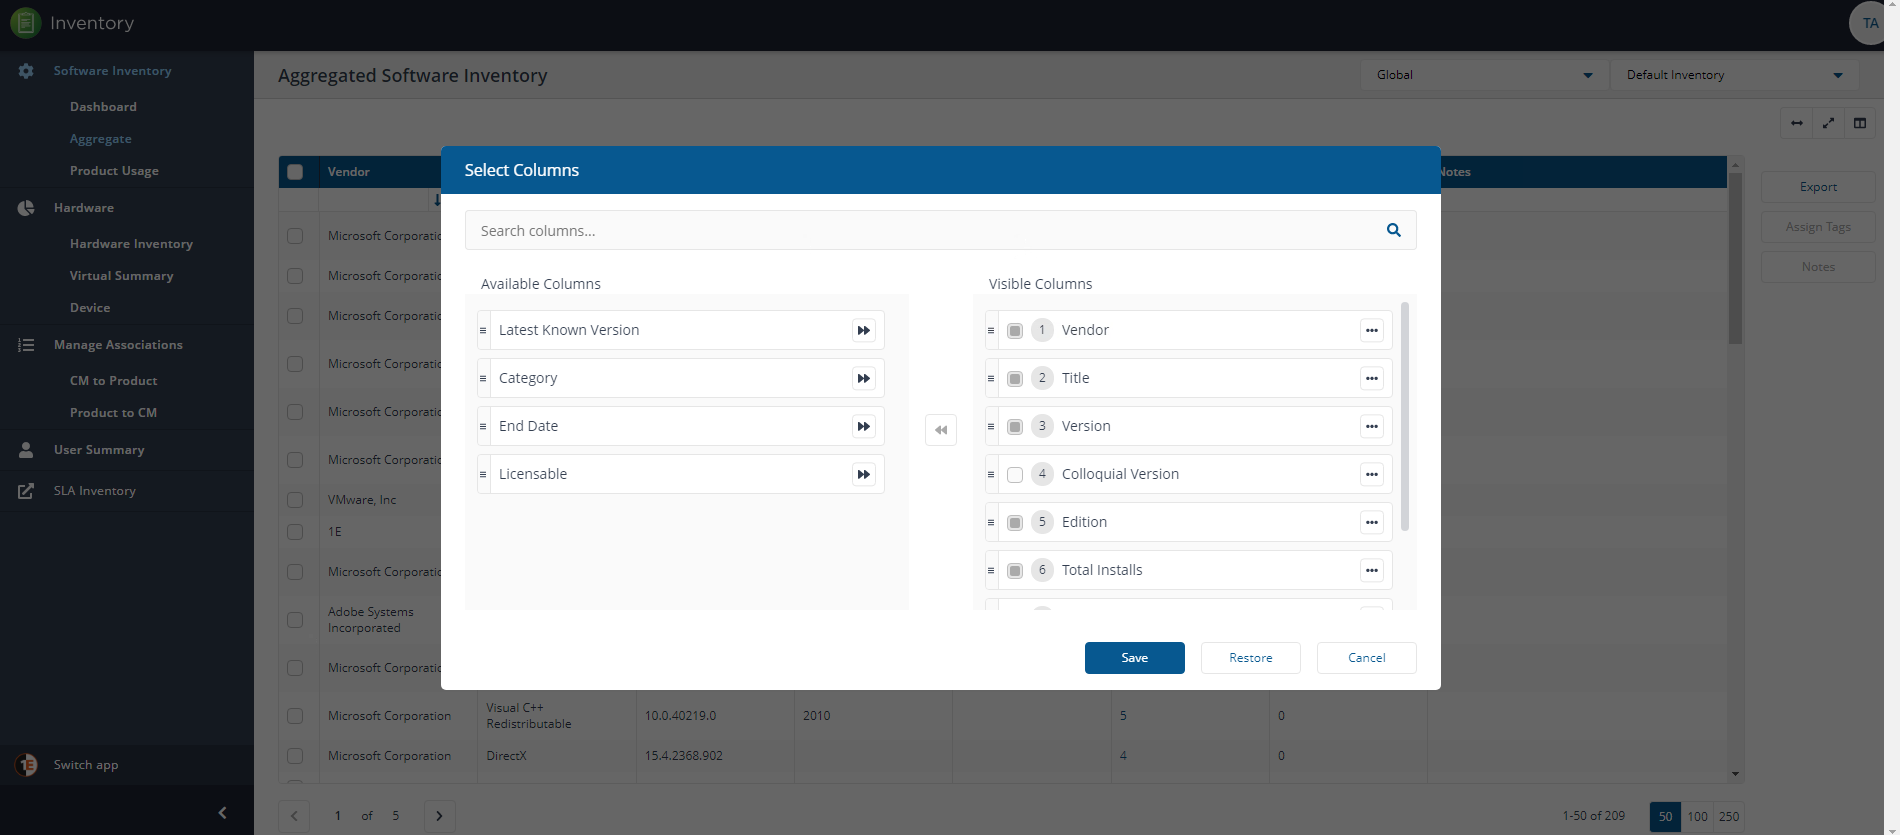
Choosing the columns displayed in reports
To increase readability, you can choose the columns displayed in detail tables. On the pages where you can pick the displayed columns you'll see the control highlighted in the opposite example.
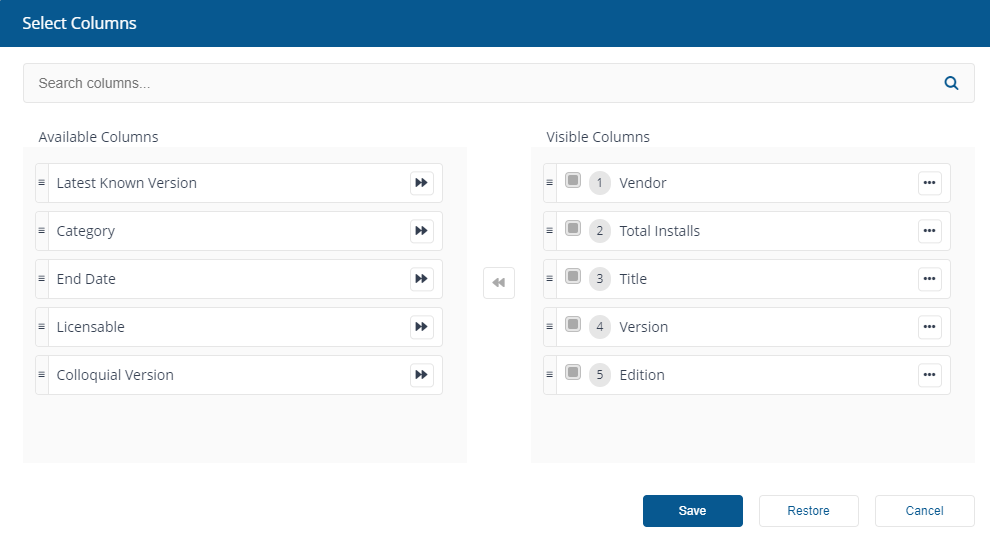
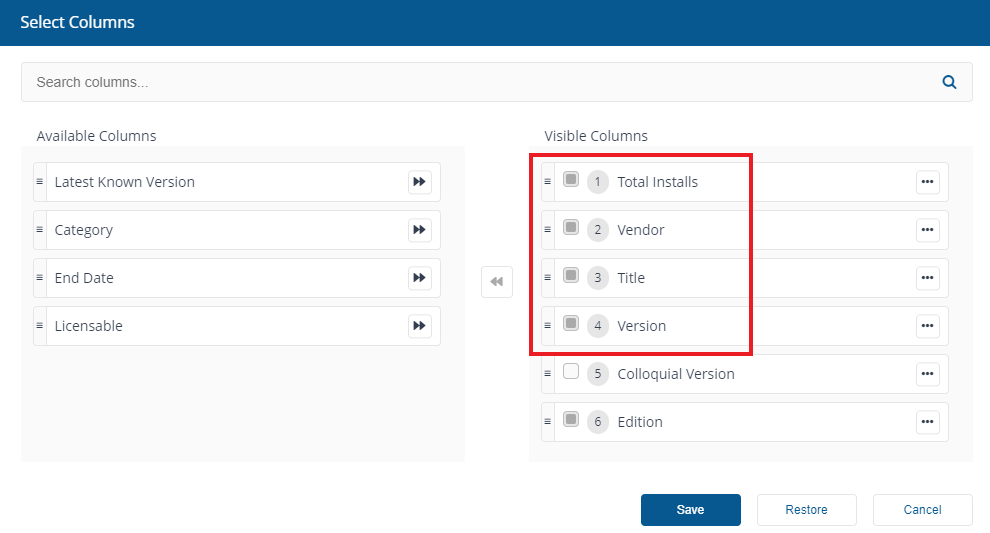
When you click on the Choose columns control it opens a popup displaying every column on the current screen, the controls are:
Control | Explanation |
|---|---|
Available Columns | Columns which are hidden by default from being displayed on screen. You can still include any of them to display on screen. |
Visible Columns | Displays the list of columns displayed on screen. Mandatory Columns cannot be excluded, the selection controls for these items are disabled. They can still be moved up or down. TipSome pages have mandatory columns and a set of default hidden columns. |
Arrow buttons | To move up or move down, exclude or include any column, clicking on the ellipsis displays these additional controls: 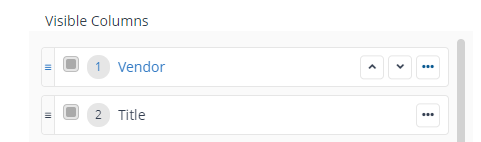 |
Drag and drop | You can drag and drop columns to change how they are displayed. |
Exclude columns | Exclude column button allows you to select columns to exclude from the current display. |
For example, inInventory→Aggregated Software Inventory we use the Choose columns control to pick which columns are displayed.
On this page the default columns are:
Total Installs
Vendor
Title
Version
Colloquial Version
Edition.
Some pages also have mandatory columns which cannot be excluded from the display. The excluded columns are greyed out and cannot be removed.
The Aggregated Software Inventory page has the following mandatory columns which you cannot remove:
Total Installs
Vendor
Title
Version
Edition.
From this screen we chose to exclude Colloquial Version and move Vendor to the top of the list.
To apply this view to the current report, we click Save.
You can also choose Restore to reset the column chooser or Cancel to cancel your changes and exit the Choose columns control.
Note
When you refresh reports on a page where you have amended the displayed columns, the report view will reset back to its default view once the refresh completes and the page reloads.