Built-in Processors Reference
Built-in processors for response visualizations.
Tachyon provides a number of built-in processors you can use for response visualizations. These can also be considered as inline functions.
Every processor requires X and Y axis to be specified. Multi series require Z axis as well. Each axis must be a valid field inside the 'Values' collection in your responses data.
In other words, it has to be one of your instruction's schema columns.
Function: ProcessSingleSeries
This processor can be used to create charts that plot a single series of numeric data.
Parameter index | Meaning |
|---|---|
1 | Column to use as X-axis labels. The X-axis can be any datatype. |
2 | Column to use as Y-axis quantities. The Y-axis must be numeric. |
3 | Number of entries. If this number is positive TOP entries will be selected. If this number is negative BOTTOM entries will be selected. Results will be sorted in descending order if the value of that parameter is positive and sorted in ascending order when the value is negative. |
4 | Name of the series. |
5 | OPTIONAL - Flag indicating if 'other' results should be included. If set to true, anything that is not included in the number of entries defined in the third parameter will be summed together in a data point called "Others". The default value of this property is true (not false as you might intuitively expect). So if you don't want the additional data point you have to specify the parameter explicitly. |
Example usage:
Processor call with optional parameter
"Function":"ProcessSingleSeries('FileName', 'Count', '9', 'Count', 'true')"Processor call without optional paramter
"Function":"ProcessSingleSeries('DeviceStatus', 'Count', '5', 'Count')"Example: ProcessSingleSeries
The instruction we’re looking at shows count of disable services and has two columns: Caption and Count. 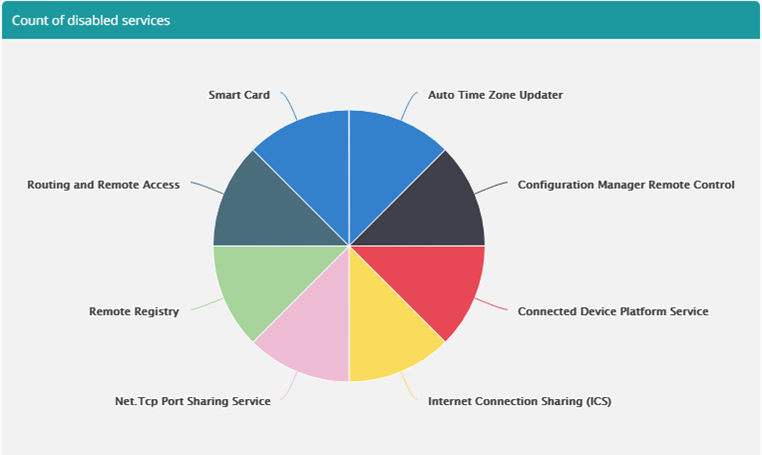
And here’s the configuration:
JSON
{
     "Name": "default",
     "TemplateConfigurations": [{
           "Id": "mainchart",
           "Title": "Count of disabled services",
           "Type": "Pie",
           "X": "Caption",
           "Y": "Count",
           "PostProcessor": "processingFunction",
           "Size": 1,
           "Row": 1
     }],
     "PostProcessors": [{
           "Name": "processingFunction",
           "Function": "ProcessSingleSeries('Caption', 'Count', '10', 'Count', 'true')"
     }]
}
Function: ProcessMultiSeries
This processor can be used to create charts that plot multiple series of numeric data.
Parameter index | Meaning |
|---|---|
1 | Column to use as X-axis labels. The X-axis can be any datatype. |
2 | Column to use as Y-axis quantities. The Y-axis must be numeric. |
3 | Column to use as Z-axis groupings. The Z-axis can be any datatype and input data will be grouped by this column. |
4 | Number of entries in each series. If this number is positive TOP entries will be selected. If this number is negative BOTTOM entries will be selected. Results within each series will be sorted in descending order if the value of that parameter is positive and sorted in ascending order when the value is negative. The series themselves will be sorted in alphabetical order (ascending order). |
5 | Number of series. The series will be sorted in descending order if the value of that parameter is positive and sorted in ascending order when the value is negative |
6 | OPTIONAL - Flag indicating if 'other' results should be included. If set to true, anything that is not included in the number of entries defined in 3rd parameter will be summed together in a "Others". Also, any series outside the number of series defined in 4th parameter will be grouped together as a series called "Others". |
Example usage:
Processor call with optional parameter
"Function":"ProcessMultiSeries('Service Name', 'Count', 'Status' '100', '10', 'true')"Processor call without optional paramter
"Function":"ProcessMultiSeries('DeviceStatus', 'Count', 'Status '10000', '3')"Example: ProcessMultiSeries
As an example we’ll use an instruction that returns all software installed on the system. This instruction is aggregated by publisher, product and the product’s version and gives a simple count. 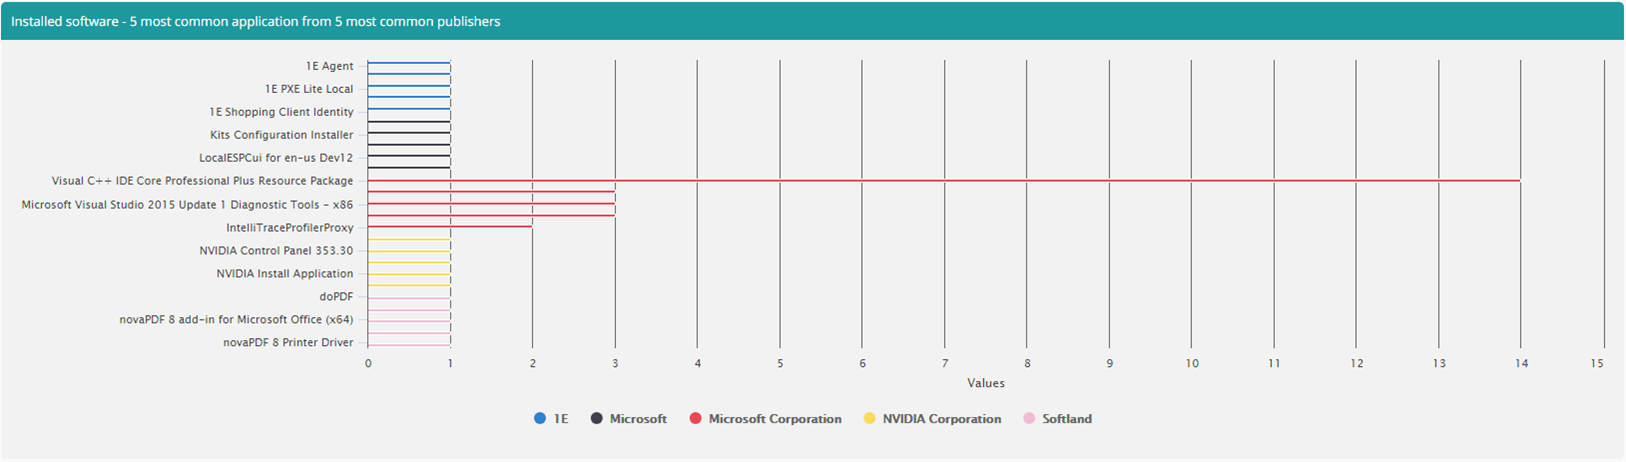
The chart above shows us the 5 most common apps from 5 most common publishers. To achieve that, we grouped over the Publisher and used Product as our X-axis with the count being the value. It’s worth noting that this will include all versions of a given product, since taking that into account would require another level to the chart.
Here’s configuration for the chart above:
JSON
{
     "Name": "default",
     "TemplateConfigurations": [{
           "Id": "mainchart",
           "Title": "Installed software - 5 most common application from 5 most common publishers",
           "Type": "Bar",
           "X": "Product",
           "Y": "Count",
           "Z": "Publisher",
           "PostProcessor": "processingFunction",
           "Size": 1,
           "Row": 1
     }],
     "PostProcessors": [{
           "Name": "processingFunction",
           "Function": "ProcessMultiSeries('Product', 'Count', 'Publisher', '5', '5', 'false')"
     }]
}
Function: ProcessDateTimeSingleSeries
This processor can be used to create charts that plot a single series of numeric data.
This processor will establish what is the earliest and latest date time in data provided and knowing what the interval is (the unit to be used) will work out what entries are needed.
This processor expects there to be one entry per unit and will not sum entries if there happens to be more than one so it's up to you to make sure the processor is configured to handle exactly the data that your instruction produces.
This means that if you've set the interval to month and in the input data there are two entries for the same month, they will not be combined.
The series is limited to 90 elements. Older dates will be truncated.
Parameter index | Meaning |
|---|---|
1 | Column to use as X-axis labels. The X-axis must be a valid date time. |
2 | Column to use as Y-axis quantities. The Y-axis must be numeric. |
3 | Unit to be used - 'minute', 'hour', 'day', 'month', 'year' are supported. |
4 | Output format. Must conform to .NET DateTime data type formatting rules or custom date and time format strings. |
5 | Name of the series. |
Example usage:
Processor call
"Function":"ProcessDateTimeSingleSeries('ModificationDateTime', 'Count', 'day', 'd', 'Modification timestamp')"Example: ProcessDateTimeSingleSeries
As an example we’ll look at an instruction that looks on DNS resolutions over time. This instruction has a simple aggregated schema with two columns: TimeStamp and Count.
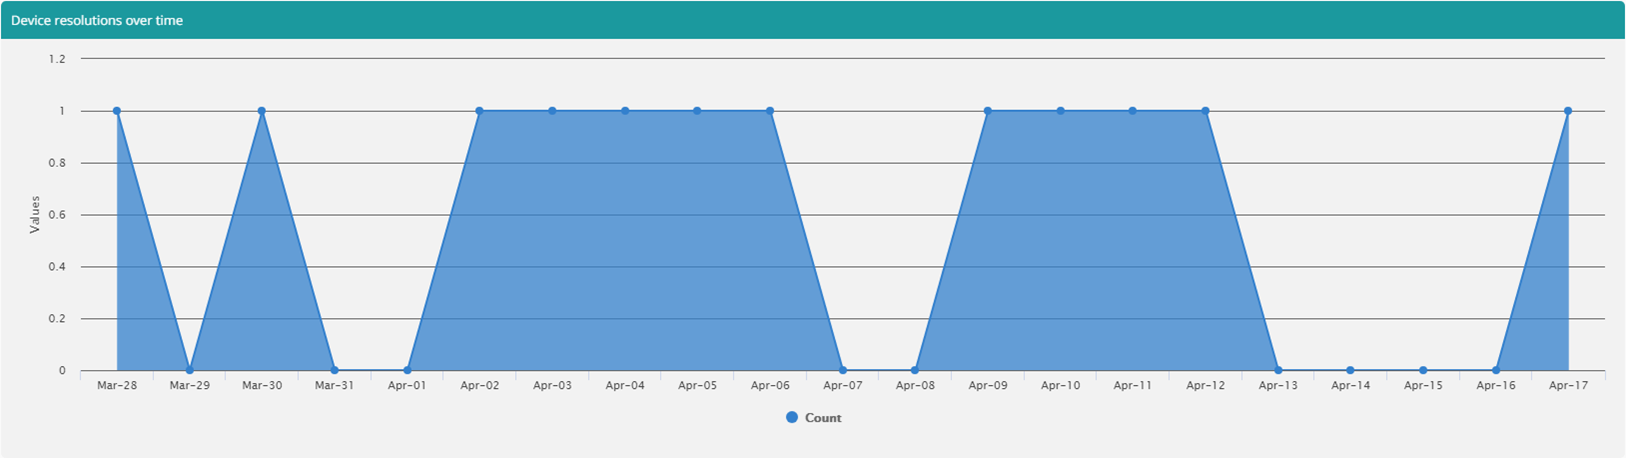
Above graph has following configuration:
JSON
{
     "Name": "default",
     "TemplateConfigurations": [{
           "Id": "leftArea",
           "Title": "Device resolutions over time",
           "Type": "Area",
           "X": "TimeStamp",
           "Y": "Count",
           "Z": "Fqdn",
           "PostProcessor": "processingFunction",
           "Size": 1,
           "Row": 1
     }],
     "PostProcessors": [{
           "Name": "processingFunction",
           "Function": "ProcessDateTimeSingleSeries('TimeStamp', 'Count', 'day', 'MMM-dd', 'Count')"
     }]
}
Function: ProcessDateTimeMultiSeries
This processor can be used to create charts that plot a multiple series of numeric data.
Because there is no guarantee each series will have the same start/end date time value, this processor will use the widest time scale required by all the series and all the missing (blank) entries in each series, be that at the beginning, end or in the middle, will be filled in with zero values.
As with the single series data time processor, this processor assumes there's one entry per unit.
Each series is limited to 90 elements. Older dates will be truncated.
Parameter index | Meaning |
|---|---|
1 | Column to use as X-axis labels. The X-axis must be a valid date time. |
2 | Column to use as Y-axis quantities. The Y-axis must be numeric. |
3 | Column to use as Z-axis groupings. The Z-axis can be any datatype and input data will be grouped by this column. |
4 | Unit to be used - 'minute', 'hour', 'day', 'month', 'year' are supported. |
5 | Number of groups. |
6 | Output format. Must conform to .NET DateTime data type formatting rules or custom date and time format strings. |
Example usage:
Processor call
"Function":"ProcessDateTimeMultiSeries('ModificationDateTime', 'Count', 'ValueType' 'day', '7', 'd')"Example: ProcessDateTimeMultiSeries
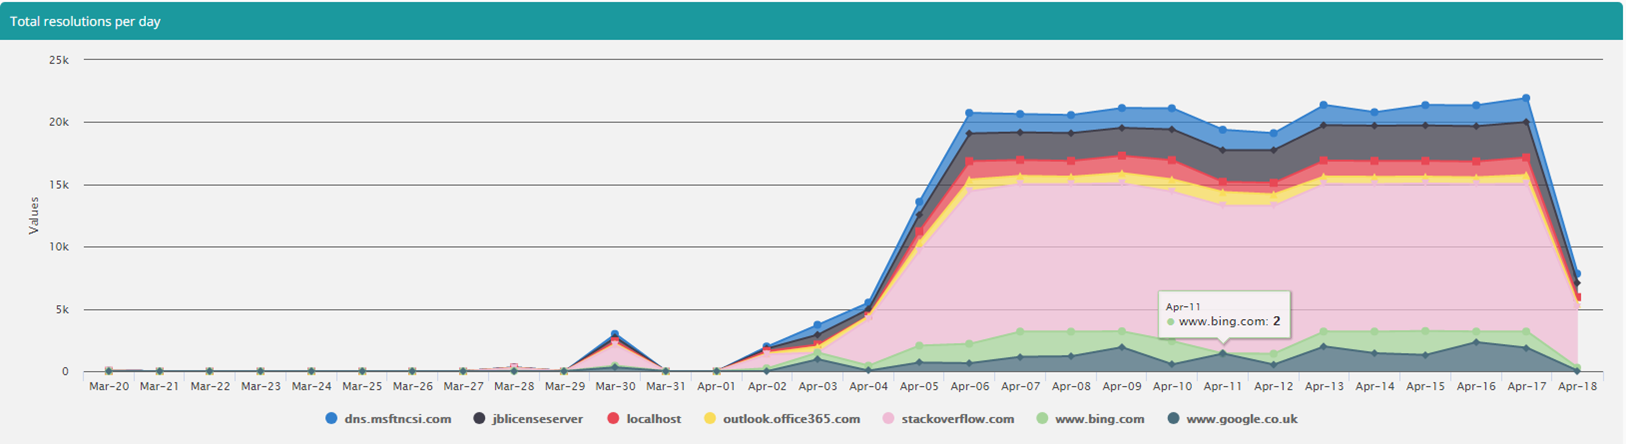
Using this configuration:
JSON
{
     "Id": "bottomStackedArea",
     "Title": "Total resolutions per day",
     "Type": "StackedArea",
     "X": "TimeStamp",
     "Y": "Count",
     "Z": "Fqdn",
     "PostProcessor": "processingFunction",
     "Size": 1,
     "Row": 2
}
JSON
{
     "Name": "processingFunction",
     "Function": "ProcessDateTimeMultiSeries('TimeStamp', 'Count', 'Fqdn', 'day', '7', 'MMM-dd', 'false')"
}