Score reference
This reference provides details on how the scores are collected and calculated.
The Scores
How Experience calculates the scores
The Experience Score is an overall number that represents the user experience of a given device. It is a total of weighted scores in the four categories - Performance, Stability, Responsiveness, and User Sentiment. The total possible score overall or in any given category is 100.The scoring number is assigned a Grade based on the chart below. Grades appear in the user interface as different colors.
This information is provided to give you an understanding of the makeup of the scores.
Grading
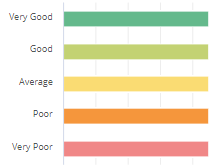
Experience scores are divided into one of five gradings.
Very Good
Good
Average
Poor
Very Poor
The ranges for each grading is listed in this table.
Grading | Score range | Bar Color |
|---|---|---|
Very Good | 100 - 81 | Dark Green |
Good | 80 - 61 | Olive Green |
Average | 60 - 41 | Yellow |
Poor | 40 - 21 | Orange |
Very Poor | 20 - 0 | Red (Exclamation Point) |
Categories
Experience uses four categories to calculate the overall Experience Score.
Category | Description |
|---|---|
User sentiment | The score for this category is based on the responses to user surveys. |
Stability | The score for this category is based on the "crashiness" of the applications and the Operating System that the applications are installed on. |
Responsiveness | The score for this category is based on our patented technology that we call "Synthetic Micro-Transactions". We run these periodically on the device and perform different tests to measure the responsiveness of the device. This information cannot be obtained from any other solution. |
Performance | The score for this category is based on the typical Windows performance type data - CPU usage, Memory Usage, Processes, etc. |
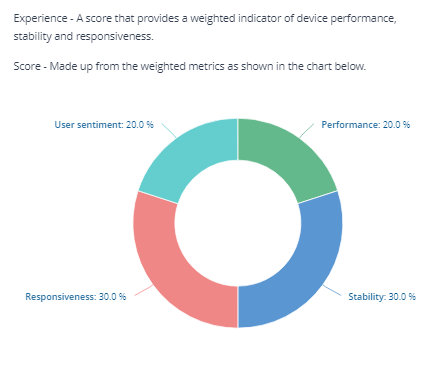
Experience overall score
The User Experience score provides an indicator of device performance, stability and responsiveness. It is derived from weighted User sentiment, Performance, Stability and Responsiveness scores.
Metric | Description |
|---|---|
User sentiment | A measure of end-users feelings about their experience based on user surveys. |
Performance | Hardware utilization |
Stability | System stability |
Responsiveness | System responsiveness |
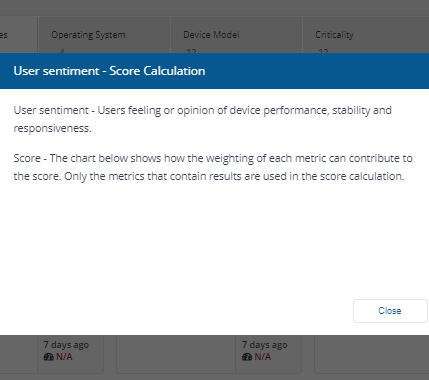
User sentiment
The User sentiment score is derived from the responses to user and metric surveys.
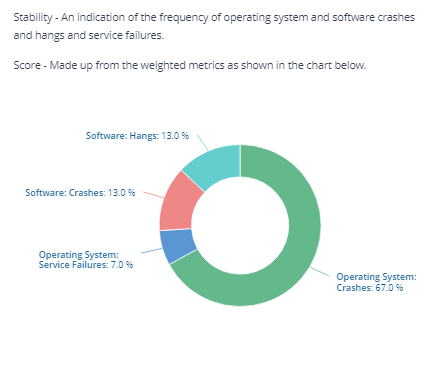
Stability
The Stability score is derived from four scores based on the number of crashes and hangs for software and for the Operating System itself.
What is measured | Description |
|---|---|
Operating System: Crashes | Scores the frequency of operating system crashes (Blue Screens, or unexpected shutdowns). A lower score indicates crash activity, which is likely to be caused by a faulty or misconfigured device drive. |
Operating System: Service Failures | Scores the frequency of service failures (where a service fails to start or shutdown correctly). A lower score indicates problematic services which may need to be investigated. |
Software: Crashes | Scores the frequency of software crashes. A lower score indicates a high rate of crashes. The Devices screen Logs tab can assist with investigation of software crashes. |
Software: Hangs | Scores the frequency of software hangs (where an application becomes unresponsive). A lower score indicates a high rate of hangs. |
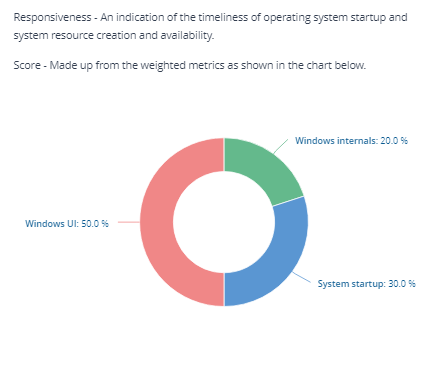
Responsiveness
The Responsiveness score is derived from the scores of Windows internals, system startup, and Windows UI.
What is measured | Description |
|---|---|
Windows Internals | Windows internals provides an indication of the timeliness of Windows System resource creation and availability |
System Startup | Derived from Operating System: Boot time |
Windows UI | Provides an indication of windows creation and operation |
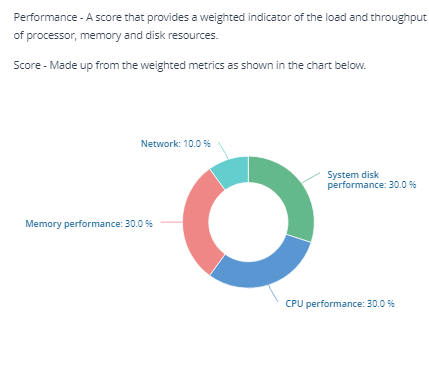
Performance
The Performance score is derived from the scores of disk performance, CPU performance, and memory performance.
What is measured | Description |
|---|---|
System disk performance | System disk performance |
CPU performance | CPU performance |
Memory performance | Memory performance |
Metrics and algorithms
Metrics are the datasets that are collected by the 1E Client and sent up the Tachyon server daily. Metrics are either Raw or Aggregate. Raw metrics have a scoring algorithm applied to them to derive a score. Operating System: Create file time is a raw value metric. The data will simply be the time it takes to create a file on that device. For example, the actual time it takes to create a file on a specific device is 0.008 seconds. So the value for the metric will be 0.008. Once the algorithm is applied the score will be 58.
An aggregated metric is calculated from other metrics.
An aggregate score will never have an associated value since it was never directly derived from Raw data.
For example, Performance score is calculated by applying weightings to three other scores - System disk performance, CPU performance and Memory performance. The weightings are determined by the impact to end user experience for that item. Things that impact the user greater are weighted higher.
Normalization algorithms
Tachyon Experience uses the following algorithms to derive a score for that metric.
Scoring Algorithm | Fixed Parameters | Description |
|---|---|---|
SweetSpot | Minimum, maximum and sweet spot | Sweet Spot Scoring Algorithm Based on a bell curve. Define a range (minimum and maximum) and a sweet spot within that range. Score is based on the distance from the nearest edge (minimum or maximum) to the sweet spot value. Example: SweetSpot(0,100,15) given a value of 30 gives you a score of 83 which is a Good grading |
Percentage | value | Percentage Scoring Algorithm Expect a value in the range of 0 - 100 and return that same value as the score. Dropping off any decimal points. Example: A 9.6 value would give you a score of 9 which is a Very Poor grading |
Inverse Algorithm | Inner algorithm | Inverting Algorithm The result of this algorithm subtracts 100 from the value dropping any decimals. Example: A 9.6 value would give you a score of 91 (100 - 9 = 91) which is a Very Good grading |
Constant | constant score | Constant Scoring Algorithm No matter the incoming value, return a constant score Example: A value of 42 would give you a score of 42 which is a Poor grading |
Bounded Range | Minimum and maximum | Bounded Range Scoring Algorithm Expect a value in the range of (minimum, maximum) and return a score of 0-100 based on the position, dropping any decimals. Example: BoundedRange(10,120) given a score of 119 would give you a score of 1 which is a Very Poor grading |
Experience Metrics
The following table outlines the Experience Metrics that are collected and scored for each device and how they are classified:
Experience | a score that provides a weighted indicator of device performance stability and responsiveness. | ||
Performance | a score that provides a weighted indicator of the load and throughput of processor memory and disc resources. | ||
System disc performance | an indicator of system disc load and throughput | ||
Disc (system): split I/O per second | scores the I/O operations that were broken into multiple requests on the system disc. A lower score may indicate excessive disc fragmentation. | ||
Disc (system) : average queue length | scores the average queue length for the system disc. A lower score indicates that this disc is not keeping up with the I/O backlog. | ||
Disc (system): average seconds per write | scores the average time taken for the system disc to perform a right. A lower score indicates that this disc is taking too long to service write requests. | ||
CPU performance | an indication of processor load and throughput. | ||
Processor: queue length | scores the CPU Q length (backlog of processing work). A lower score means that the CPU is not keeping up with the workload. | ||
Processor: percent interrupt time | scores the amount of time the CPU spent servicing interrupts. A lower score may indicate faulty or misconfigured hardware/ drivers. | ||
Processor: processor time | scores the CPU load. A lower score indicates that the CPU is fully loaded, and additional processing power may be required. | ||
Memory performance | a score that indicates memory load and system paging activity. | ||
Memory: hard page faults | Scores the amount of memory pages that had to be read from disc based storage. A lower score indicates this device is low on available physical memory. | ||
Memory: page file usage | Scores the percentage of the page file that is in use. A lower score indicates more high page file use, which may mean the device is low on available physical memory. | ||
Memory: Physical memory usage | Scores the percentage of physical memory in use. A lower score indicates higher memory consumption, and therefore less available physical memory. | ||
Operating System: Memory access time | Score the time taken to allocate, zero and free a block of memory. A lower score indicates that the operating system is slow to server memory requests, which may affect application performance. | ||
Network | A score that indicates the local network stack performance (not including physical network considerations, such as latency). | ||
Operating System: UDP send time | Scores the time taken to perform a basic loopback UDP send. A lower score may indicate problems with the operating system network stack. | ||
Network: Output queue length | Scores the network transmission backlog based on the length of the output packet queue. | ||
Network: Wireless signal quality | Scores the signal quality of the wireless network connection on the device. | ||
Stability | An indication of the frequency of operating system and software crashes and hangs and service failures. | ||
Operating System: Crashes | Scores the frequency of operating system crashes (Blue Screens, or unexpected shutdowns). A lower score indicates crash activity, which is likely to be caused by a faulty or misconfigured device driver. | ||
Operating System: Service Failures | Scores the frequency of service failures (where a service fails to start or shutdown correctly). A lower score indicates problematic services, which may need to be investigated. | ||
Software: Crashes | Scores the frequency of software crashes. A lower score indicates a high rate of crashes. The Devices screen Logs tab can assist with investigation of software crashes. | ||
Software: Hangs | Scores the frequency of software hangs (where an application becomes unresponsive). A lower score indicates a high rate of hangs. | ||
Responsiveness | An indication of the timeliness of operating system startup and system resource creation and availability. | ||
Windows internals | An indication of the timeliness of Windows system resource creation and availability. | ||
Windows filesystem | A score that indicates file system and disk access speed. | ||
Operating System: Create file time | Scores the time taken to create an empty, temporary file. A lower score indicates that the operating system may be underperforming in terms of basic file operations. | ||
Operating System: Disk random access time | Scores the time taken to perform a random access disk operation on the system drive. A lower score indicates poor random disk access performance. | ||
Operating System: Disk sequential access time | Scores the time taken to perform a sequential access disk operation on the system drive. A lower score indicates poor sequential disk access performance. | ||
Windows registry | An indication of Windows registry access speed. | ||
Operating System: Registry read HKLM time | Scores the time taken to read from the HKLM Windows Registry hive. A lower score indicates poor registry read performance, which in turn may affect application performance. | ||
Operating System: Registry write HKCU time | Scores the time taken to write to the HKCU Windows Registry hive. A lower score indicates poor registry write performance, which in turn may affect application performance. | ||
Operating System: Registry write HKLM time | Scores the time taken to write to the HKLM Windows Registry hive. A lower score indicates poor registry write performance, which in turn may affect application performance. | ||
Processes and threads | A score that indicates Windows process and thread creation and startup speed. | ||
Operating System: Create process time | Scores the time taken to create a new process. A lower score indicates that the operating system is taking a long time to create new processes. | ||
Operating System: Create thread time | Scores the time taken to create a new thread within a process. A lower score indicates that the operating system is taking a long time to create new threads. | ||
Operating System: OpenHandle time | Scores the time taken to acquire a basic operating system resource. A lower score indicates that applications may underperform because the operating system is slow to service resource requests. | ||
Operating System: Load DLL time | Scores the time taken to load and unload a DLL in a process. A lower score indicates library loading is slow, which may affect the startup time of applications. | ||
System startup | An indication of the timeliness of operating system startup. | ||
Operating System: Boot time | Scores the time taken for the device to boot to the logon prompt. A lower score indicates a long boot up duration, which may affect user satisfaction. | ||
Windows UI | An indication of graphical window creation and operation speed. | ||
Operating System: Create window time | Scores the time taken to generate an empty window. A lower score indicates poor Windows desktop performance, which may cause applications to appear unresponsive. | ||
Operating System: Message dispatch time | Scores the time taken to dispatch and confirm processing of a windows message. A lower score indicates poor message processing throughput, which may affect application responsiveness. | ||
User sentiment | Users feeling or opinion of device performance, stability and responsiveness. | ||
User Sentiment Survey metrics | These have been added by an Experience Survey administrator. The information shows the text of the question related to the survey metric. | ||
Metrics Collection Details
Metrics
Metrics are the data points that are collected by the 1E Client and sent to the Tachyon server. They are collected at different intervals depending on the type of data that is being collected.For example, CPU usage might be collected each hour but crash information is collected at the time of the crash. If the 1E Client cannot connect to the Tachyon switch, the client still collects the data but will hold the information until the next time the switch can be contacted. The 1E Client will send all the collected data at that time.
Data Collection Intervals
Some metrics for Experience are collected as daily summaries. These are sent to the Tachyon Switch each night at midnight. If the 1E Client cannot contact the server at midnight the daily digest data is saved at the device and is sent to the server the next time the server can be contacted. In this version, there is not the ability to force the 1E Client to send the information outside of the nightly cycle.
The data that is collected in the daily digest is:
Device resource usage
Device Performance, responsiveness and stability data
Software stability and resource usage
The Stability Data is reported in real-time to the Tachyon Switch. These include:
Software installs/uninstalls
Patch installs/uninstalls
Operating System reboots
Application crashes
Application hangs
Operating System crashes
Windows service failures