Administration menu
Creating and configuring Guaranteed State Policies.
Note
Guaranteed State can be reached directly using the following URL:
https://<tachyon DNS Name FQDN>/Tachyon/App/#/guaranteedstate/
where <tachyon DNS Name FQDN> is the one set up during the preparation phase, as described under the heading Preparation: DNS Names.
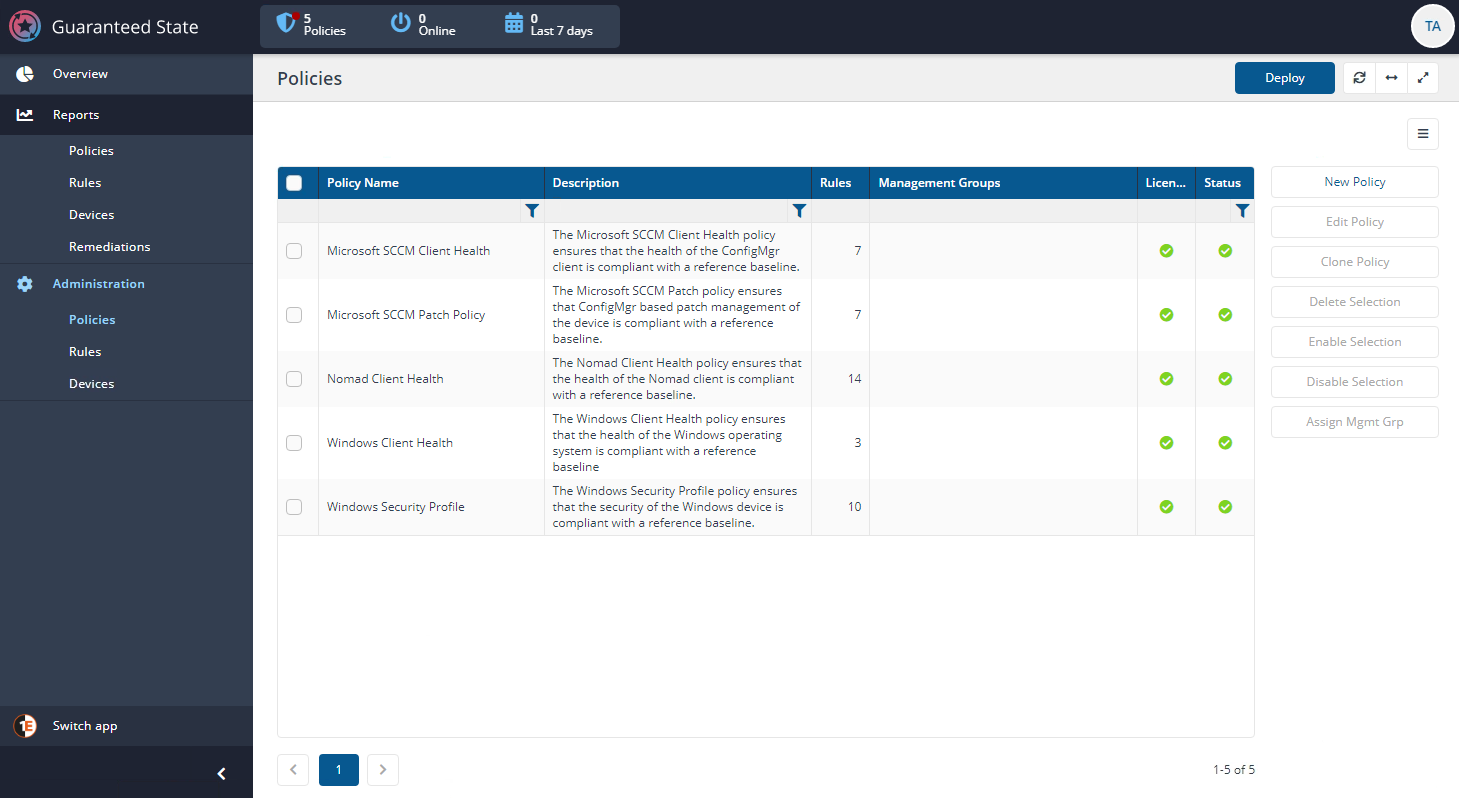
Policies page
The Policies page lets you view and manage the current Guaranteed State policies. From this page you can:
Create a New policy and assign and unassign existing rules
Edit an existing policy and assign and unassign existing rules
Clone an existing policy
Delete an existing policy
Enable or Disable an existing policy
Assign (or unassign) an existing policy to one or more Management Groups.
Creating a new policy
To create a new policy from selected Instructions:
<some instructions here>
Editing an existing policy
<some instructions here>
Cloning a policy
<some instructions here>
Deleting an existing policy
<some instructions here>
Enabling or Disabling an existing policy
<some instructions here>
Assigning or unassigning an existing policy
<some instructions here>
Rules page
The Rules page lets you view and manage the Guaranteed State rules. From this page you can:
Create a New rule and configure it
Edit an existing rule and configure it
Clone an existing rule with a new name
Delete an existing rule
Enable or Disable an existing rule
<picture>
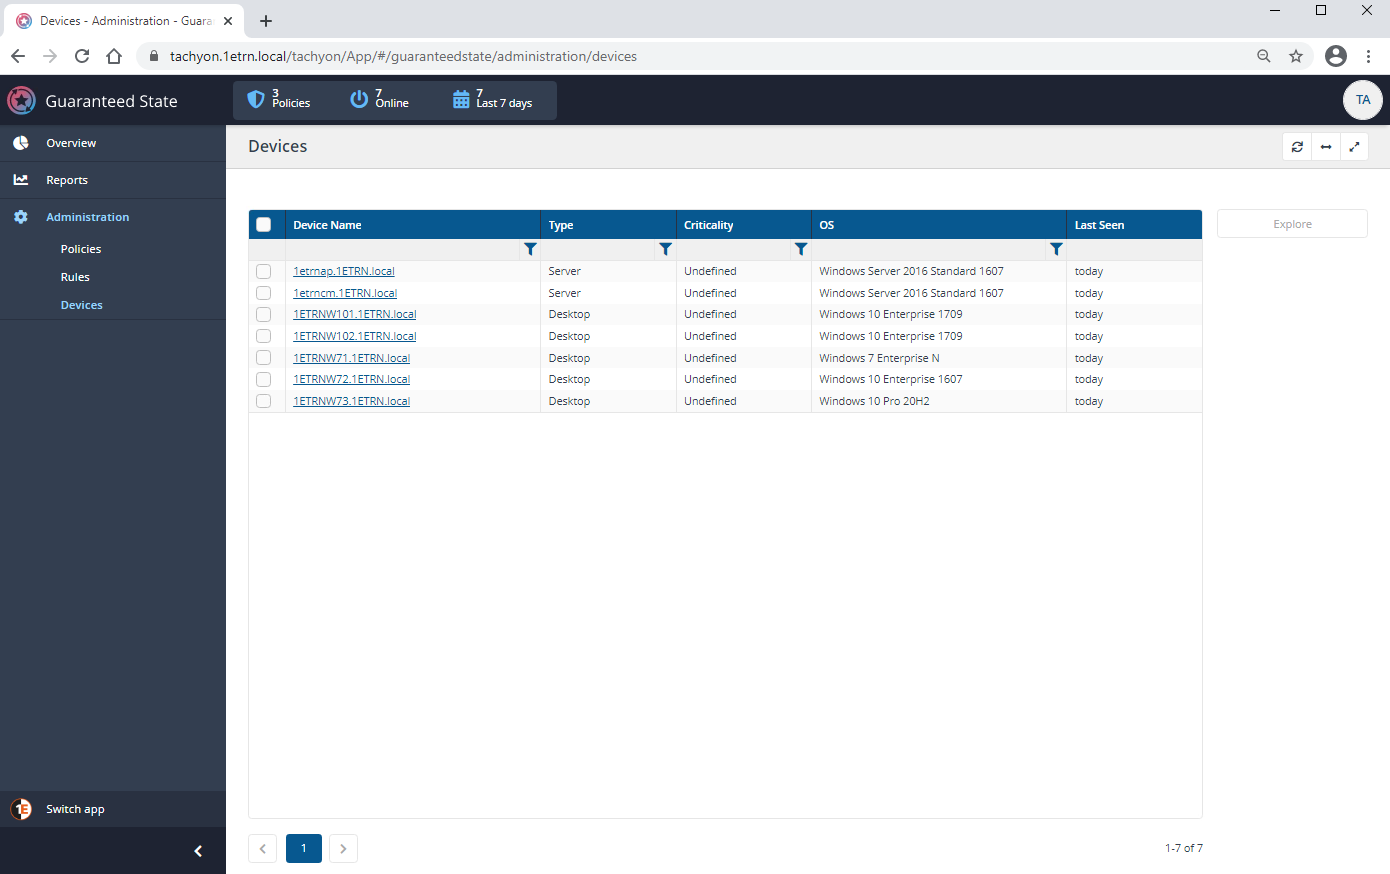
Devices page
The Devices page provides a list of all devices visible to Guaranteed State. You can display a Device view for a selected device by clicking on its link in the Device Name column. You can also select one or more entry from the list and choose to use that selection as the scope for an Explorer session.
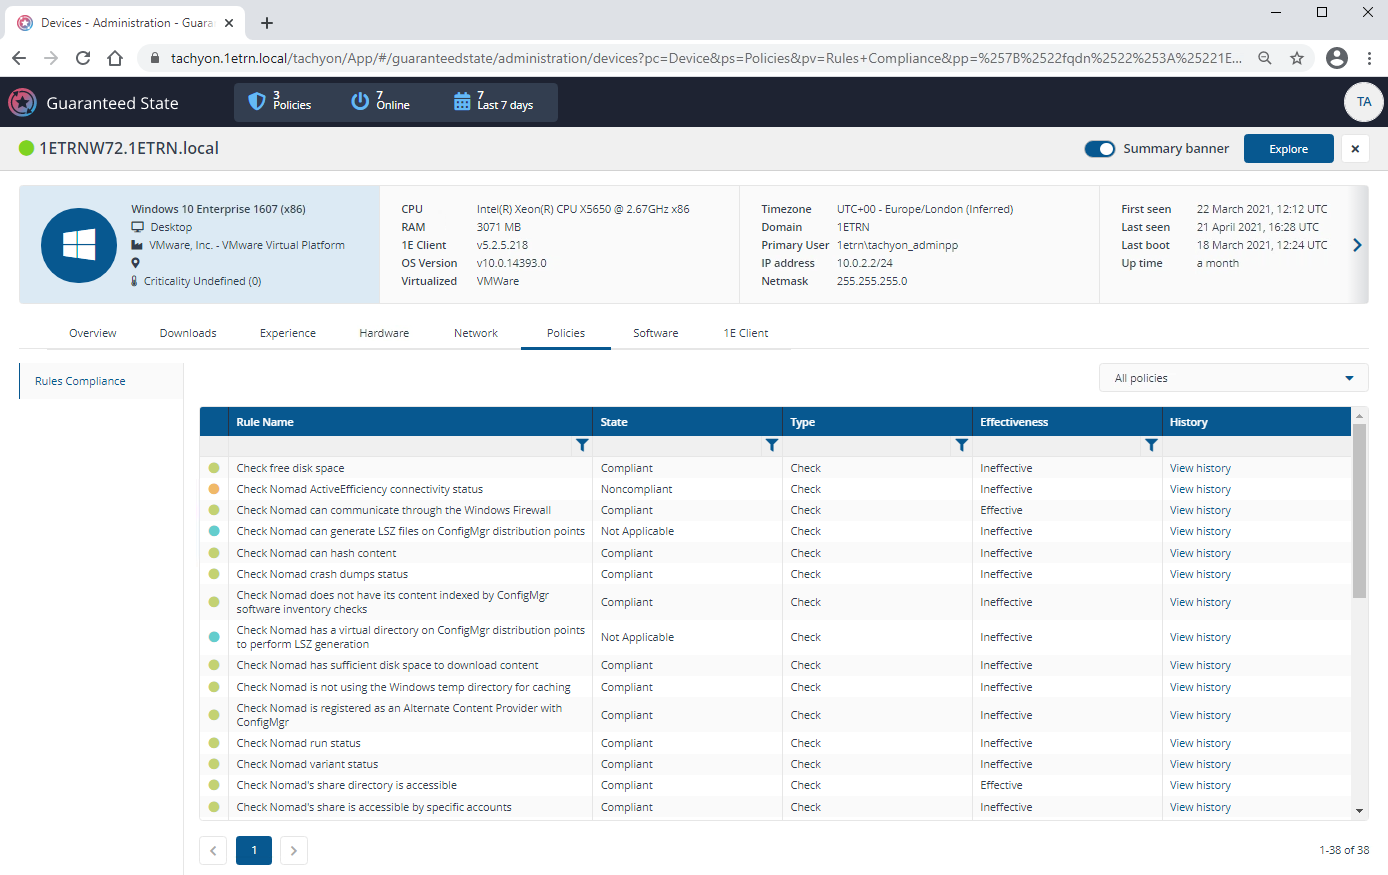
The Devices view Policies tab
The default view in the Guaranteed State devices view is Policies. The remaining tabs display information corresponding to an app, feature or data set implemented in Introducing Tachyon. Other tabs are visible if an app has been installed and licensed, and the user has permissions to use the app.
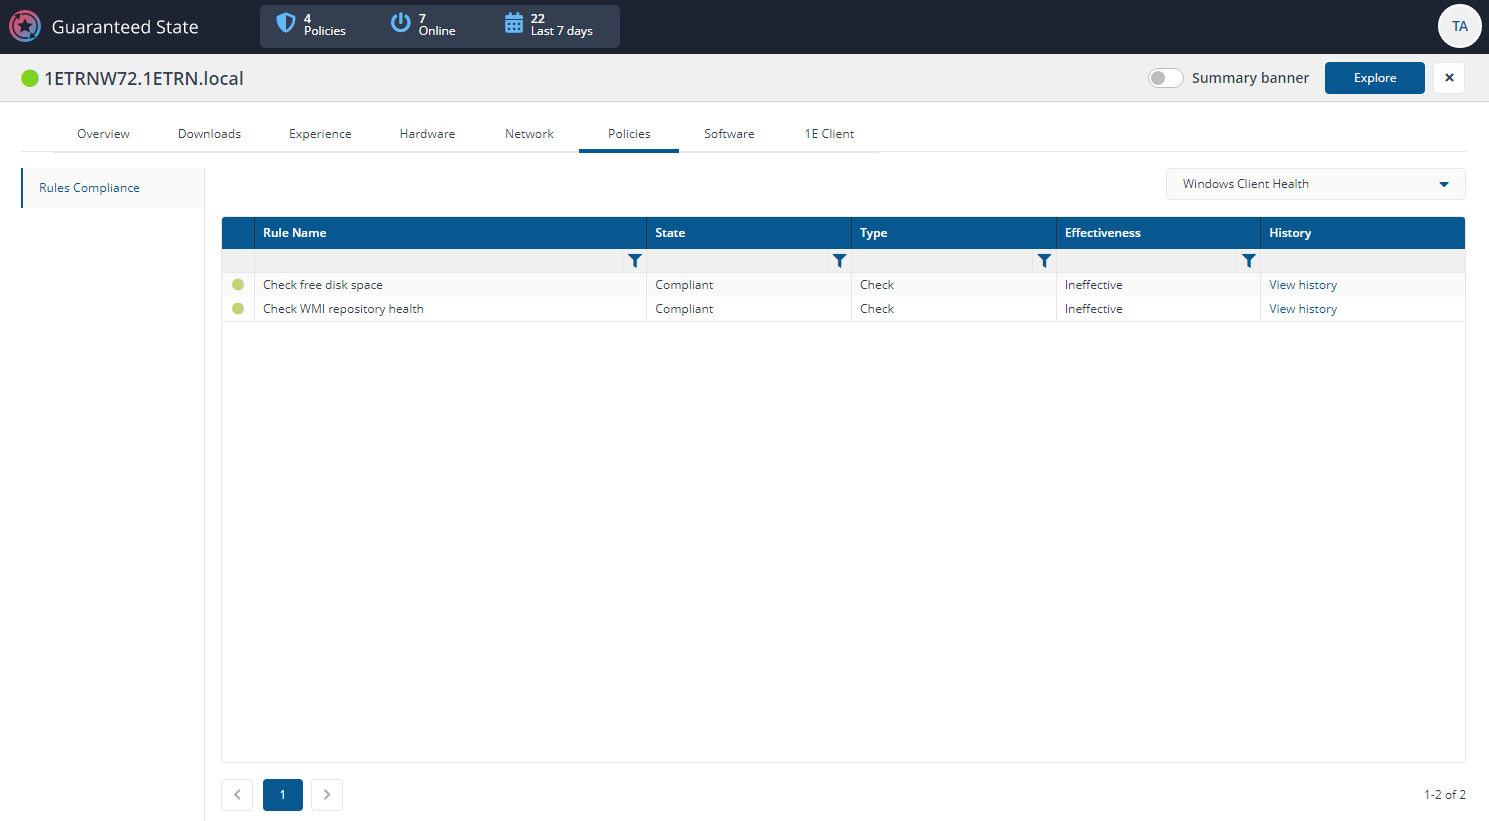
Clicking on one of the links in the Device Name column of the Devices page displays the Device view for the selected device. The aim of the Device view is to provide a combined overview of all the information known about a device along with the ability to retrieve information about the device in real time. When displaying the Device view from a Guaranteed State page the view defaults to the Policies tab. The Policies tab contains information derived from and useful for using Guaranteed State.
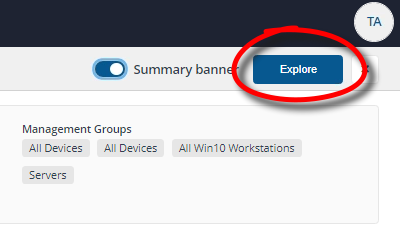
The Summary banner toggle at the top of the page (the default toggle setting is off), shows general device details, and the Explore button navigates you to the Explorer app, refer to Using Tachyon Explorer for details.
Is the Device is online and connected to Tachyon
In the picture opposite the device 1ETRNW72 is showing as online and connected to Tachyon, this is indicated by the green traffic light next to the device name at the top of the page. Hovering your mouse over the traffic light displays the message This device is online and connected to 1E Tachyon.
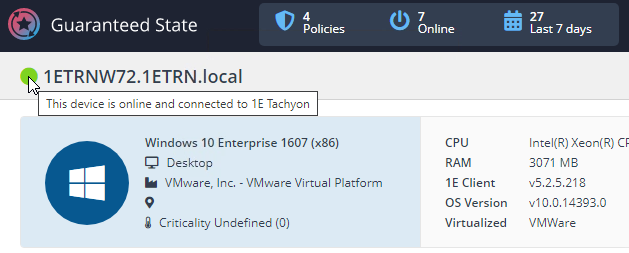
In the picture opposite the device 1ETRNW101 is showing as not connected to Tachyon, this is indicated by the gray traffic light next to the device name at the top of the page. Hovering your mouse over the traffic light displays the message This device is not connected to 1E Tachyon.

Device View table
In the Device View you can see if a device is compliant to the rules deployed in your environment, if they are effective and view information to assist with troubleshooting.
Column | Description |
|---|---|
Traffic light | Traffic light status relates to the State column.
|
Rule Name | Name of a specific rule. |
State | Device state per rule, for example:
|
Type | Whether the rule is one of two types:
|
Effectiveness | Rule effectiveness, either:
|
History | Clicking View history displays the related history per rule for the selected device.
For example, a message related to the rule Check Nomad's share directory is accessible , with a Check Failed message showing as the Status might return a message like, Permissions on the Nomad share are not valid. |
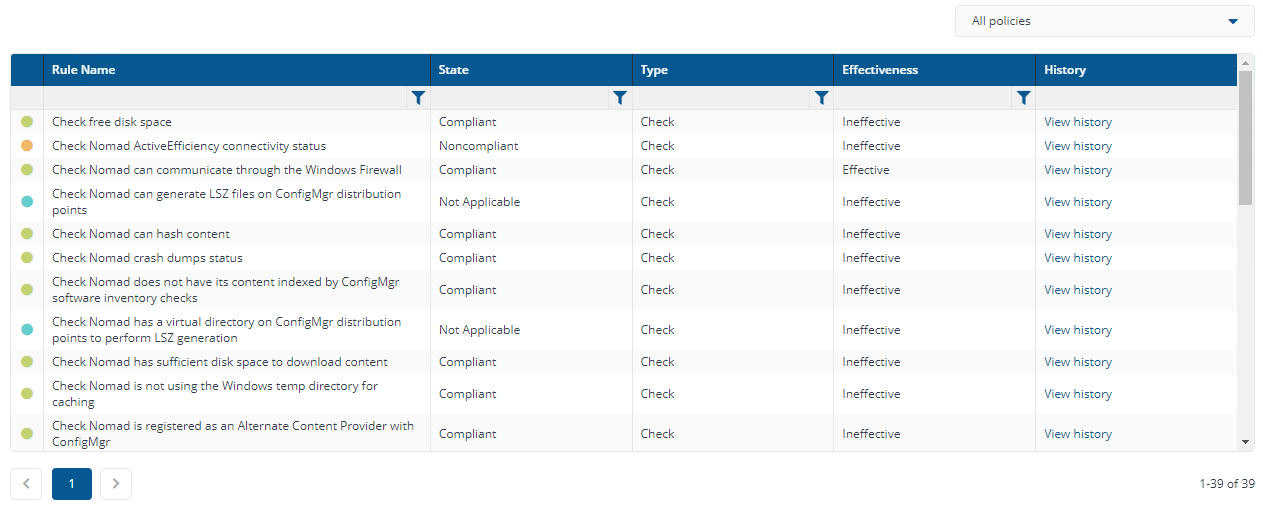
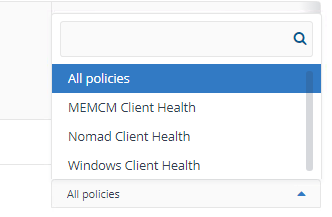
Policies filter
You can use the policies filter to differentiate between device compliance for the different policies you have deployed in your environment, the default view is All Policies.
In our example we have deployed three policies:
MEMCM Client Health
Nomad Client Health
Windows Client Health.
In the example we have filtered the view on the Windows Client Health policy which shows two Rules:
Check free disk space
Check WMI repository health.
For more information about Guaranteed State policies and using them refer to Using Guaranteed State for the following:
The Device View Summary banner
The Summary banner displays a quick summary of the information provided in the various tabs displayed in the Device View. It can be viewed by toggling the Summary banner switch to on.
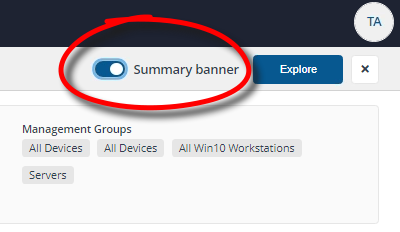
The following image shows the Summary banner displayed for a particular device.

Launching the Explorer from the Device View
You can click on the Explore button in the Device View to launch Explorer with the current device set as the scope.
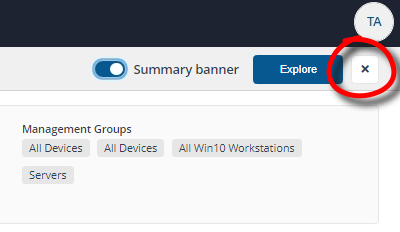
Closing the Device View
The Device View is a popup that is displayed when clicking on the name of a device on a page where devices are displayed. To return to the page you came from you need to click the x button.
Additional Device View tabs
In addition to the Policies tab, there are a number of other tabs, each corresponding to an app, feature or data set implemented in Introducing Tachyon:
The Overview and 1E Client tabs are always present in the Device View. Other tabs are visible if an app has been installed and is licensed.
Each tab has one or more panels with tiles populated with data from various sources, some by instructions that are run instantly, with results cached for 3 minutes. An appropriate error message is displayed instead of a tile in the following circumstances:
If the device is offline, as indicated by the color of the icon in the top left
The user does not have at least Viewer permission to view use the license the tab or panel
The user does not have questioner permission to run the instruction
An instruction has not been uploaded.
The Device View tabs and panels page lists the names of tabs and their panels, and a description of each tile indicating how the tile is populated.
Tab | Panel | Description | Data source | |||||||||||||||||||||||||||||||
|---|---|---|---|---|---|---|---|---|---|---|---|---|---|---|---|---|---|---|---|---|---|---|---|---|---|---|---|---|---|---|---|---|---|---|
Displays a number of tiles sorted into Identification, Hardware and Operating System and Connectivity and Activity columns that show information for the selected device retrieved from the online status information stored in the Tachyon Master database. The columns and tiles are shown in the following table:
| Data from Tachyon Master (the latest online status message) | |||||||||||||||||||||||||||||||||
Shows a list of the environment variables set on the device. | ||||||||||||||||||||||||||||||||||
Two panels:
| 1E-TachyonPlatform-Hardware-ResourceUsage 1E-TachyonPlatform-Hardware-ResourceUsageByMinute | |||||||||||||||||||||||||||||||||
Download activity and status for the device. Whenever you click on an FQDN on any of the Nomad pages then the Device View will be displayed with the Downloads tab selected. | Data from Content Distribution. | |||||||||||||||||||||||||||||||||
Content Titles on the selected device, the default view is from All Sources, All Types and All Status. NoteYou may see a difference in the number of items in a device’s Nomad cache versus that displayed in the Nomad app Device View. This is because if downloaded content has been deleted from Configuration Manager, the content titles cannot be resolved in the Nomad app and are not displayed. This is under consideration for re-design and may be revised in future versions of Nomad. | Data from Content Distribution. | |||||||||||||||||||||||||||||||||
1E Nomad Branch Settings . | 1E-Nomad-NomadBranchSettings | |||||||||||||||||||||||||||||||||
Metrics are the data points that are collected by the 1E Client and sent to the Tachyon server. They are collected at different intervals depending on the type of data that is being collected. | Data from Experience metrics | |||||||||||||||||||||||||||||||||
The Trends tab shows the changes in the scores over time. Hovering over any of the bars shows the details for that time and event. If the user viewing the device details also has the ability to at least ask a question in Explorer the Explore button will be visible. | Data from Experience metrics | |||||||||||||||||||||||||||||||||
The Event Logs tab gives you a listing of the Windows Event log entries for that device. This brings that data to this view and is very useful when determining the root cause of an issue that has been reported on the device. | Data from Experience metrics | |||||||||||||||||||||||||||||||||
Shows user interaction times and ratios across applications measured over the last 30 days | 1E-Experience-ApplicationInteraction | |||||||||||||||||||||||||||||||||
Shows user interactive sessions with activity over last 30 days. | 1E-Experience-UserInteractionHistory | |||||||||||||||||||||||||||||||||
Shows disk drives, including hardware and usage information.
| 1E-TachyonPlatform-Hardware-DiskDrives | |||||||||||||||||||||||||||||||||
Shows the list of plug and play hardware devices (Windows only).
| 1E-TachyonPlatform-Hardware-Devices | |||||||||||||||||||||||||||||||||
Shows network throughput on all adapters for the last hour, represented by the following tiles:
| 1E-TachyonPlatform-Network-AverageThroughput | |||||||||||||||||||||||||||||||||
Returns the output from the native network interface configuration command (e.g. ipconfig or ifconfig). | 1E-TachyonPlatform-Network-InterfaceConfiguration | |||||||||||||||||||||||||||||||||
Shows the Cache and Host file tiles:
| 1E-TachyonPlatform-Network-DnsCache 1E-TachyonPlatform-Network-HostFileContent | |||||||||||||||||||||||||||||||||
Returns a list of established TCP connections.
| 1E-TachyonPlatform-Network-TcpConnections | |||||||||||||||||||||||||||||||||
Returns a list of processes which are listening for network connections.
| 1E-TachyonPlatform-Network-ListeningPorts | |||||||||||||||||||||||||||||||||
Returns a list of processes which are listening for network connections and also shows routing tables. | 1E-TachyonPlatform-Network-ArpCache 1E-TachyonPlatform-Network-RoutingTable | |||||||||||||||||||||||||||||||||
Shows a list of visible wifi networks, including basic network properties.
| 1E-TachyonPlatform-Network-WiFiNetworks | |||||||||||||||||||||||||||||||||
| Data from Guaranteed State | |||||||||||||||||||||||||||||||||
Shows (per-device) installed software.
| 1E-TachyonPlatform-Software-Installations | |||||||||||||||||||||||||||||||||
Shows list of installed Windows services and their current state.
| 1E-TachyonPlatform-Software-Services | |||||||||||||||||||||||||||||||||
Shows operating system environment variables. | 1E-TachyonPlatform-Software-EnvironmentVariables | |||||||||||||||||||||||||||||||||
Shows detailed information about all running processes.
| 1E-TachyonPlatform-Software-Processes | |||||||||||||||||||||||||||||||||
Shows a list of the binary files in the executable folder of the 1E Client.
| 1E-TachyonPlatform-Client-Binaries | |||||||||||||||||||||||||||||||||
Shows the full content of the 1E Client configuration file, including:
| 1E-TachyonPlatform-Client-ConfigFileContent | |||||||||||||||||||||||||||||||||
Shows extensibility objects (modules and providers) loaded by the 1E Client.
| 1E-TachyonPlatform-Client-Extensibility | |||||||||||||||||||||||||||||||||
Shows Data Files and Client Inventory Database Use tiles that display the list of:
| 1E-TachyonPlatform-Client-DataFiles 1E-TachyonPlatform-Client-InventoryDatabaseUse |