Monitoring and investigating enterprise-wide experience
This scenario outlines a typical day for an end-user computing (EUC) manager. It shows how they use Tachyon Experience to monitor their overall Experience score, drill-down to view details and finally pinpoint the devices with the worst scores - so they can take action to improve their end-users' experience.
A typical day for the EUC Manager
The EUC Manager is concerned with how the network performs for their end-users. They are constantly looking to improve stability, responsiveness and performance so that their end users are happier with the IT Service they receive.
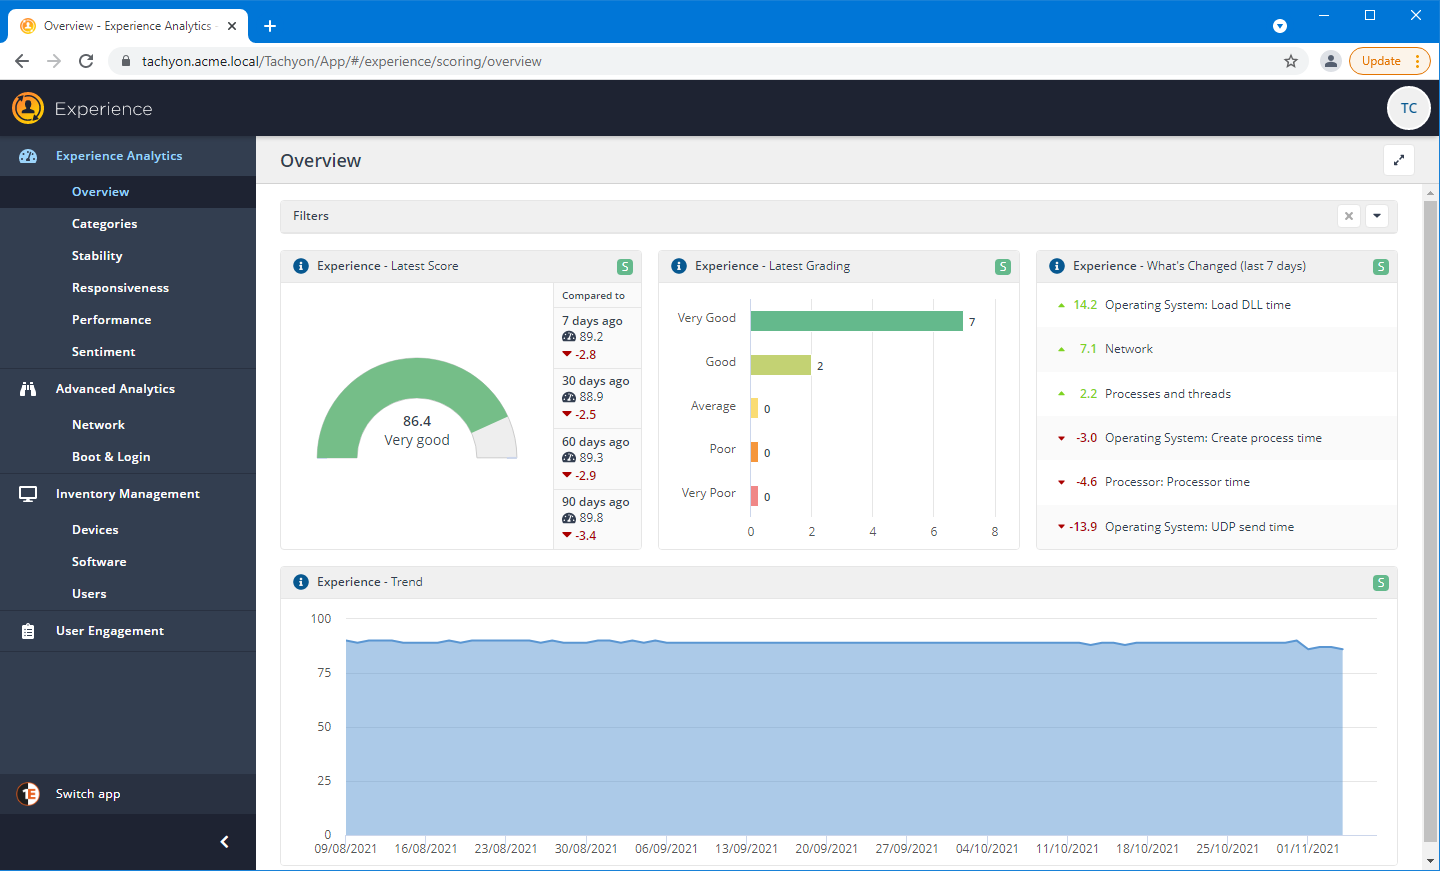
Looking at the Experience Overview page
To start their day, the EUC manager loads up their Experience application and looks at the Overview page. Here they check the latest Experience score to see how their network is doing overall right now. The score of 86.4 is looking good, but is there anything more they can do to improve service? Checking the Compared to section of the Experience Latest Score tile, they can see that in general the Latest Score is moderately down against the results from 7, 30, 60 and 90 days ago. The EUC manager is interested in how the scores changed, particularly if the scores are decreasing - since this may be indicative of a problem that needs action.
So is there anything in the makeup of the latest Experience score that merits investigation?
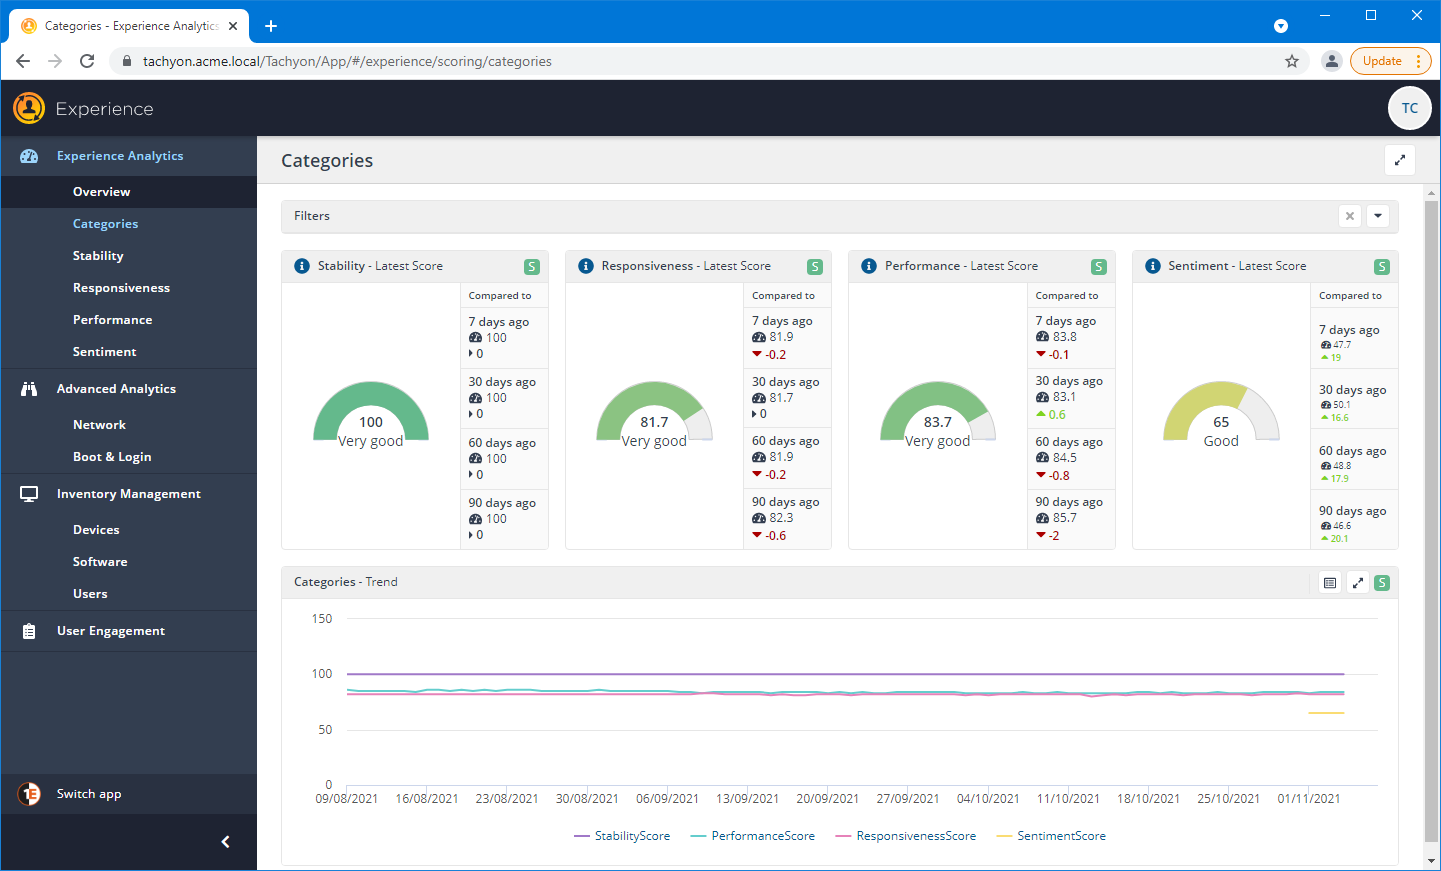
Looking at the constituent scores
Clicking on the Experience - Latest Score tile drills down to display the constituent scores on the Categories page. Here the EUC manager checks the Stability, Responsiveness, Performance and Sentiment scores. Scanning across, the Sentiment - Latest Score of 65 is good, but lower than the others. The comparisons with 7, 30, 60 and 90 days ago shows there has been an overall improvement - but the fact that the score is the lowest, is there still an issue that may be affecting end-user sentiment?
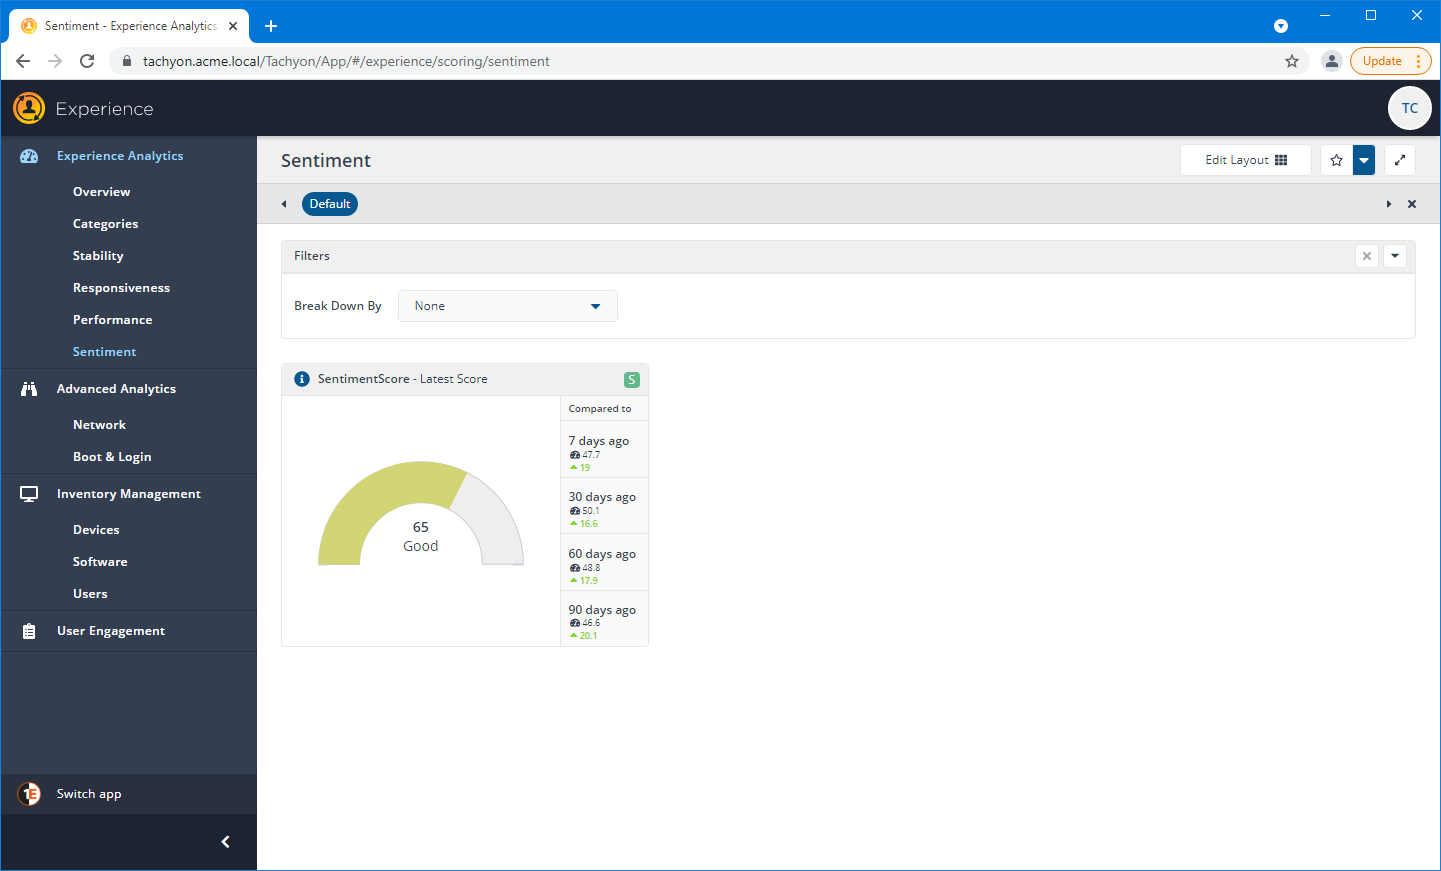
Investigating Sentiment
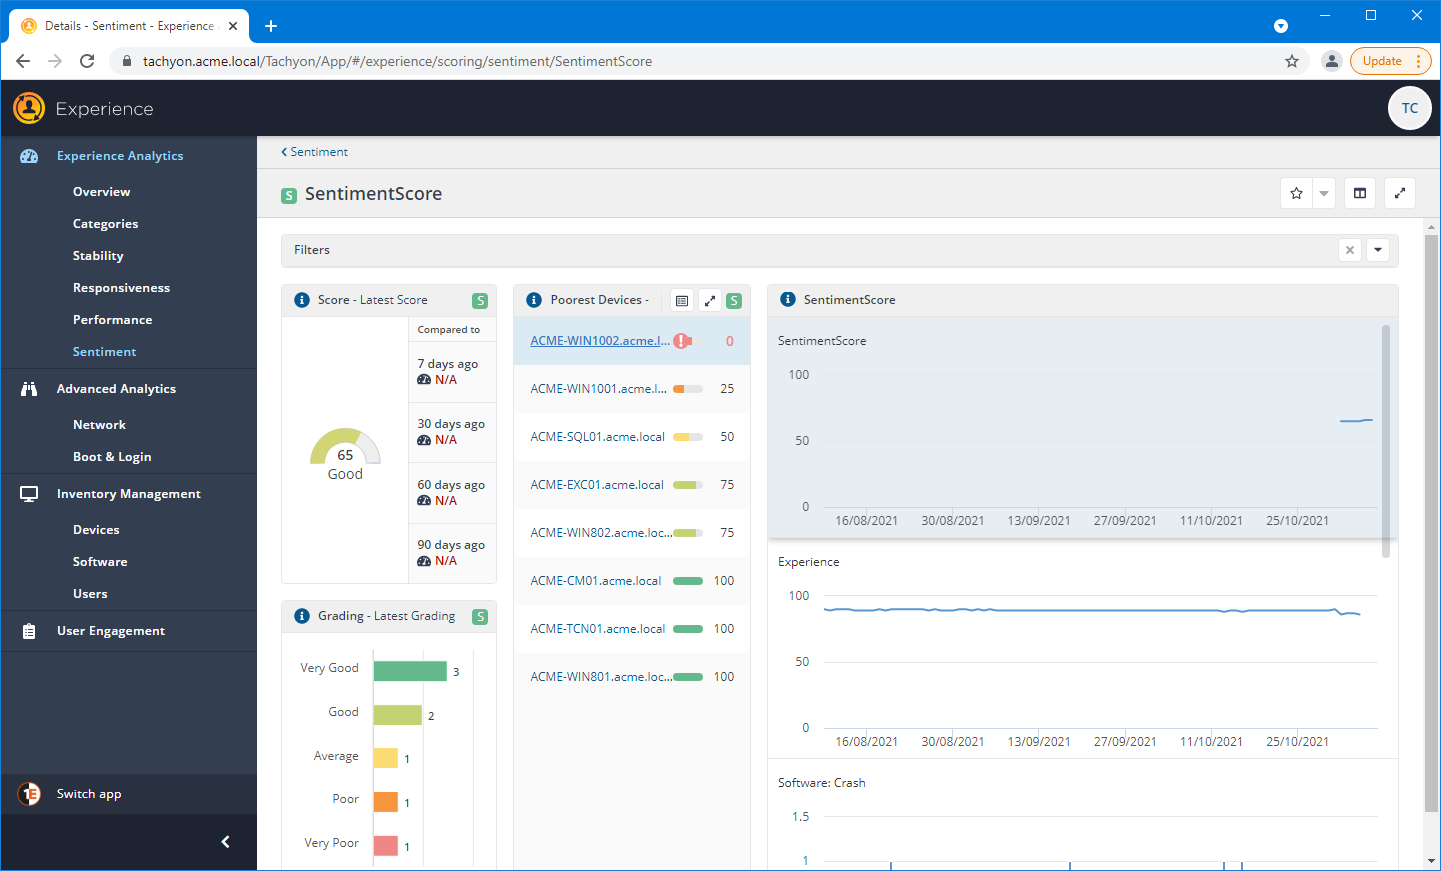
Clicking on the Sentiment - Latest Score tile drills down to the Sentiment page, here the EUC manager can drill down again by clicking on the same tile.
Reviewing the Poorest Devices
On the Sentiment page, the EUC manager scans the Poorest Devices tile. The items in the Poorest Devices tile are ordered from the poorest to the best performance. They see that the topmost item seems to have a much lower score than the others, so they decide to take a closer look.
Zooming in on the lowest score
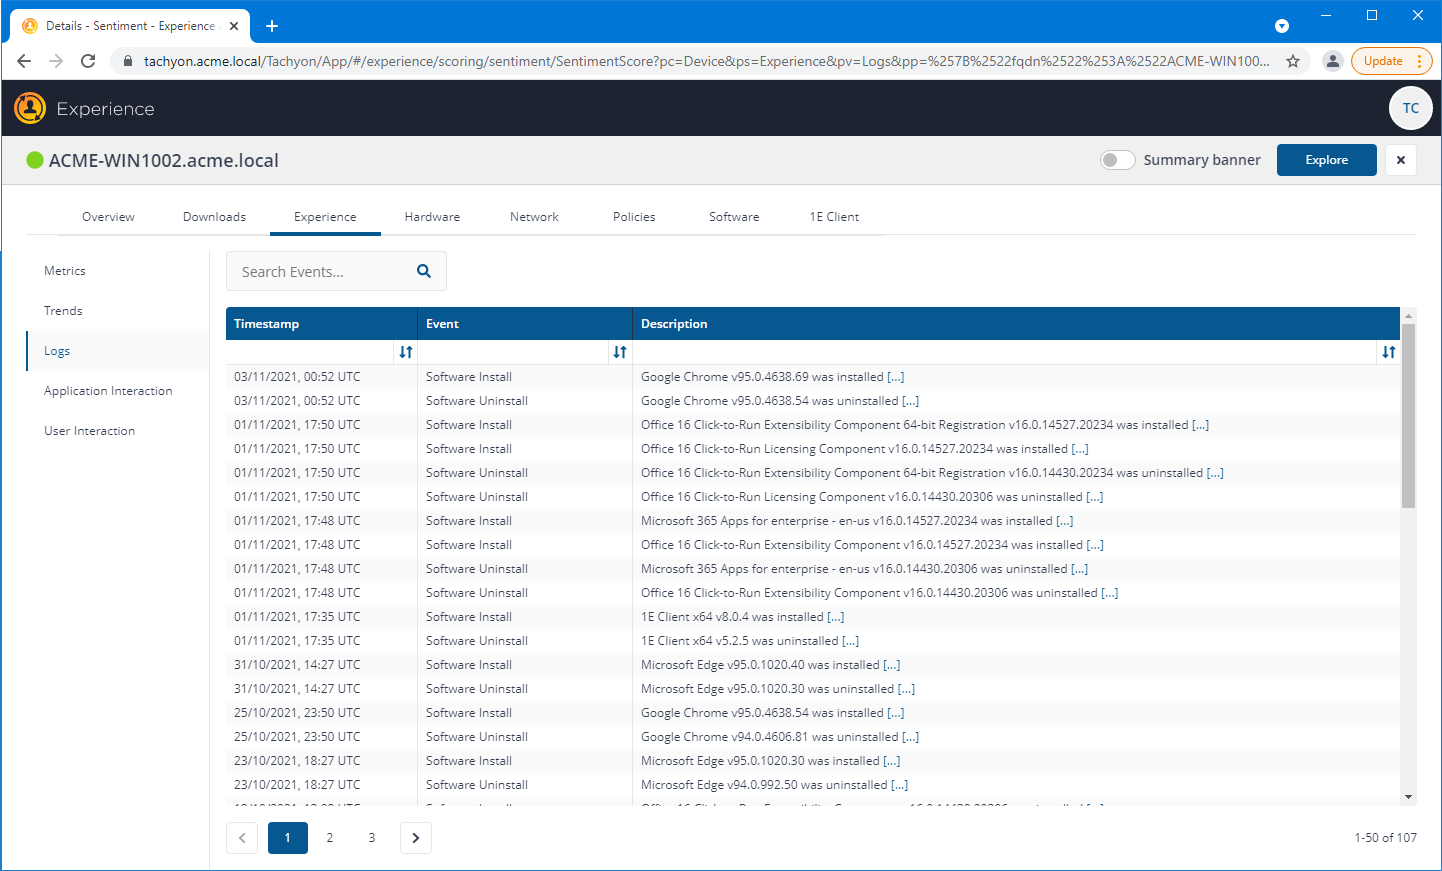
Clicking on the name link for the device in the Poorest Devices tile, displays the Device Details for the selected device. This view displays information for the device that is derived from all the Tachyon applications you are licensed for, as well as displaying real-time information that is gathered immediately from the device. This information is gathered by instructions that are automatically triggered when displaying a tab or chart and show you the current status for the device.
When navigating from the Poorest Devices tile, Device Details initially opens on the Logs panel, as seen in the picture. Here, the EUC manager can view information about the device that is retrieved from the device logs.
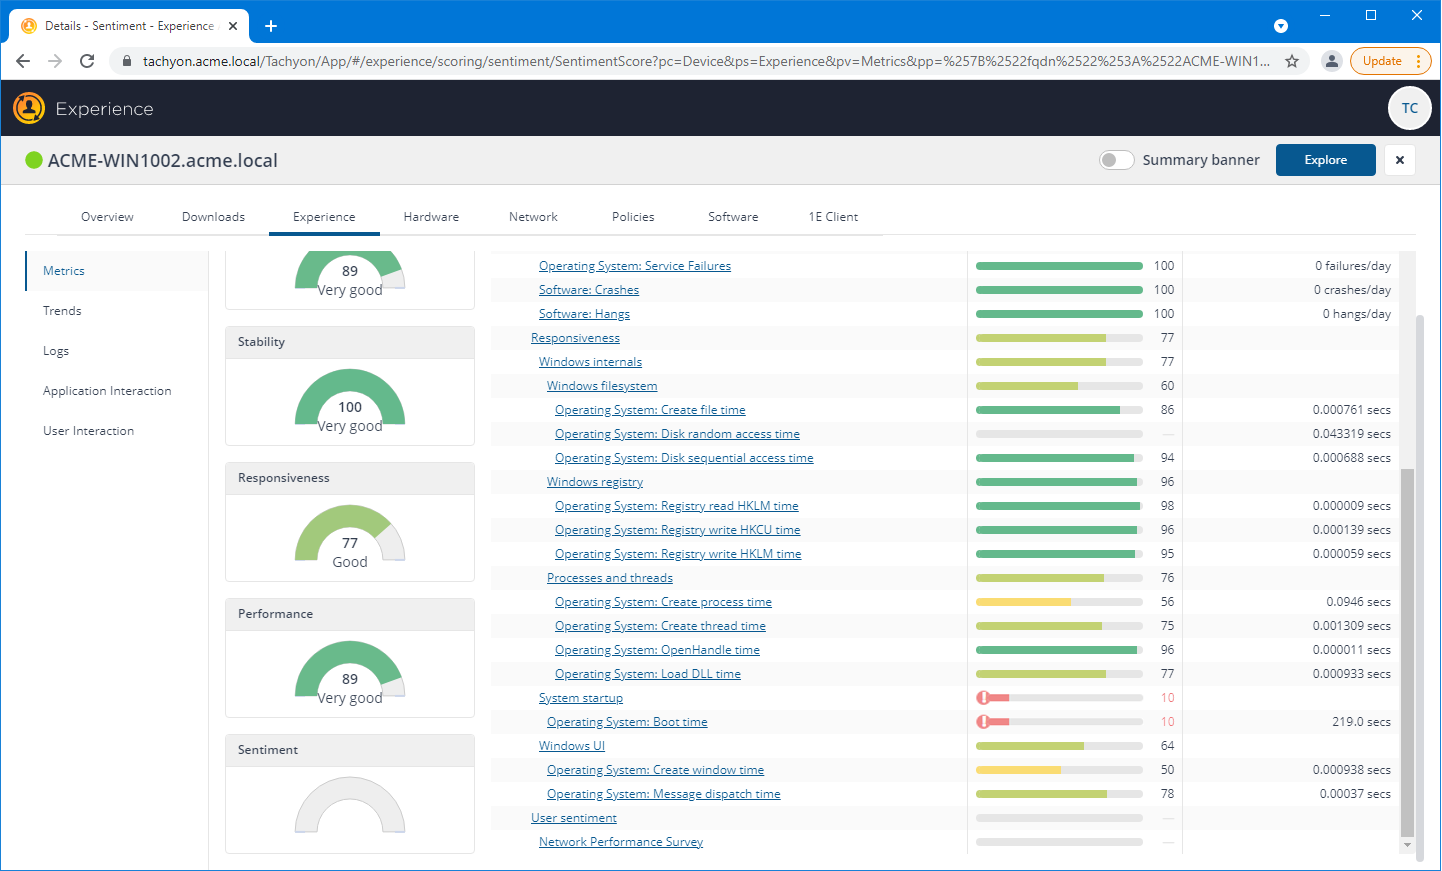
Investigating the Metrics for a particular device
Clicking on the Metrics table the EUC manager scrolls down and sees that there are issues reported for the device related to the System startup, specifically the Operating System Boot time - where the score is only 10. They can also see that this is affecting the User sentiment for the device. At this point they could click the Explore button and investigate the issue further using Tachyon's real-time system, or assign the task to one of their IT team. Whichever they choose, they are now ready to take action.