Page reference
A reference for the fields and tables on the pages in Dashboards.
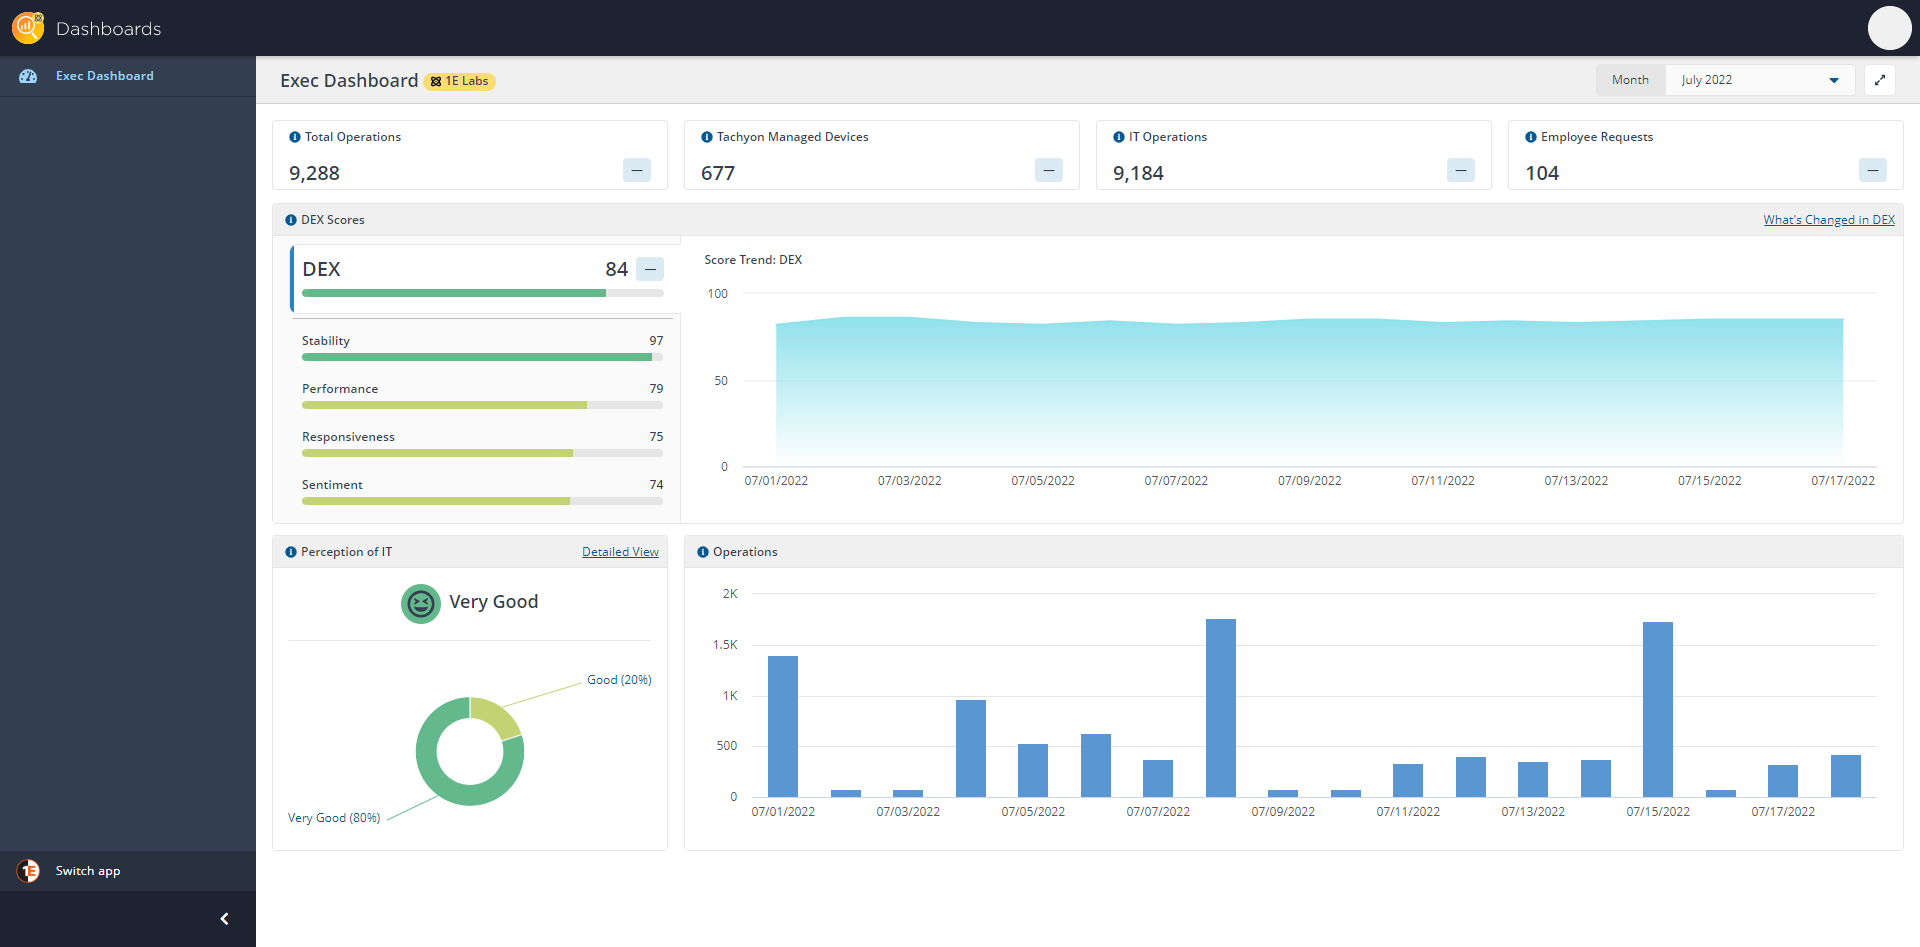
Exec Dashboard page
The Exec Dashboard is an overview page in the Tachyon Portal, mainly aimed at CIO executives, showing the benefits that Tachyon is providing and highlighting how the company has been performing in terms of DEX over the past few months.
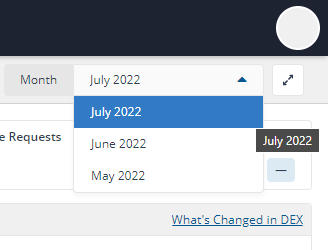
Time Period
Using the Time period filter at the top of the page, you can narrow down the results by date. You can choose from the current month's DEX score report, or one of the previous two months.
For the current month, the graph will show data from the 1st date of the calendar month to yesterday’s date, for example:
July 2022 (current month until yesterday, so data doesn’t change every second)
June 2022
May 2022
When the Time Period is set to a period, the setting you choose is retained when you:
Manually refresh the page
Switch between Tachyon Platform apps
Close and reopen the app.
Exec Dashboard tiles
Thetilesat the top of the Exec Dashboardpage. Each sectionallows you to quickly and easily view statistics based on the following categories.
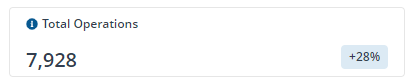
Tip
The Delta for your DEX scores are only displayed once a month is complete. The examples shown are from June 2022 in our environment. The Delta scores show the changes in the total category carried out in the selected calendar month.

Total Operations
Total number of issues resolved by manual actions, automated policy fixes, ITSM actions, Virtual Assistant actions, and other self-service requests. In our example, the total is 160 (Employee Requests) + 7,768 (IT Operations) = 7,928 (Total Operations).
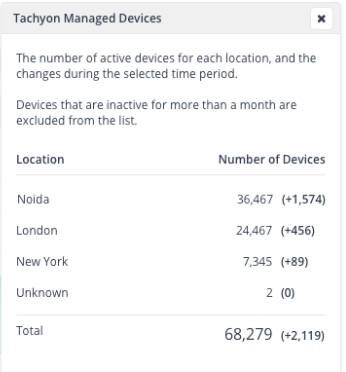
Tachyon Managed Devices
Number of devices managed by Tachyon. These are the devices where the installed 1E Client has contacted Tachyon.
IT Operations
Number of issues resolved by manual actions, and automated policy fixes.
Employee Requests
Number of issues resolved by ITSM actions, Virtual Assistant actions, and other self-service requests.
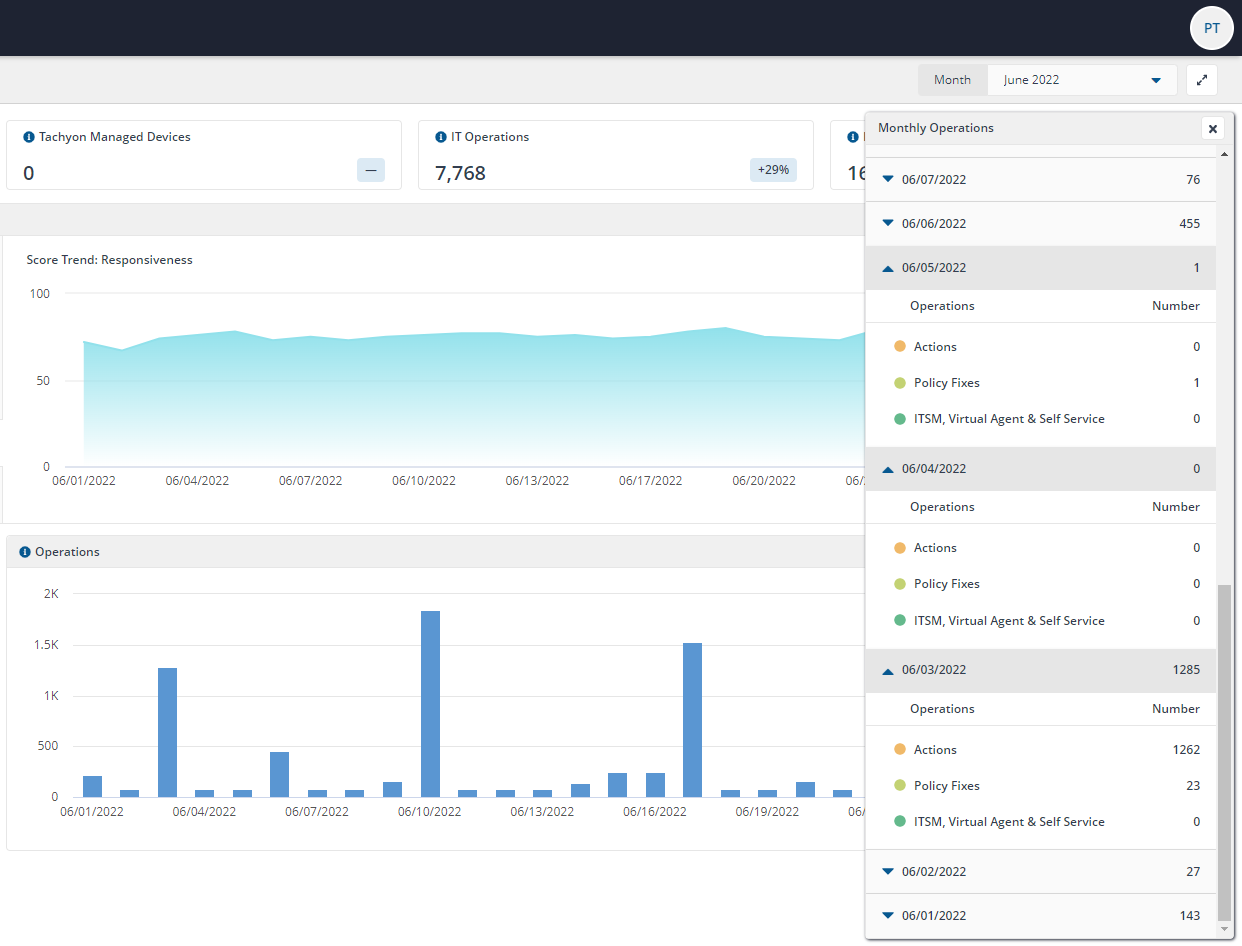
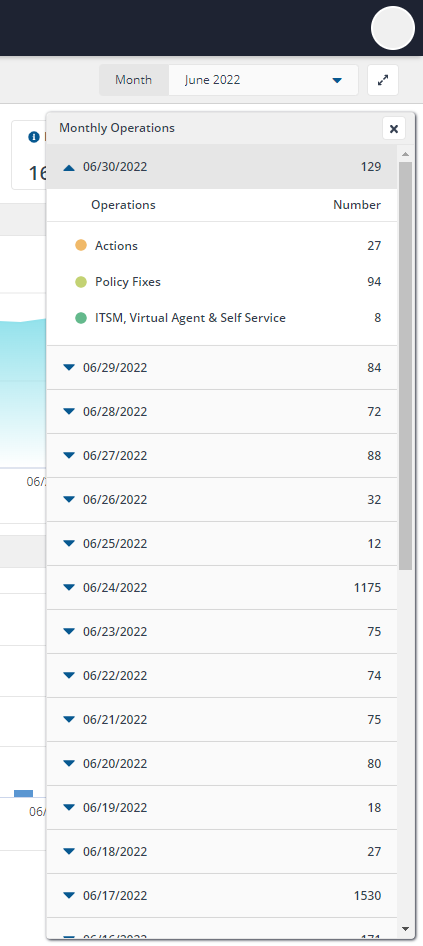
Monthly Operations drawer
The Monthly Operations drawer is displayed when you click on the following tiles:
Total Operations
IT Operations
Employee Requests.
The Monthly Operations drawer displays the number of Actions, Policy Fixes and ITSM, Virtual Agent & Self Service per day for the currently selected month.
Tachyon Managed Devices
Displays the number of active devices for each location, and the changes during the selected time period.
Devices that are inactive for more than a month are excluded from the list.
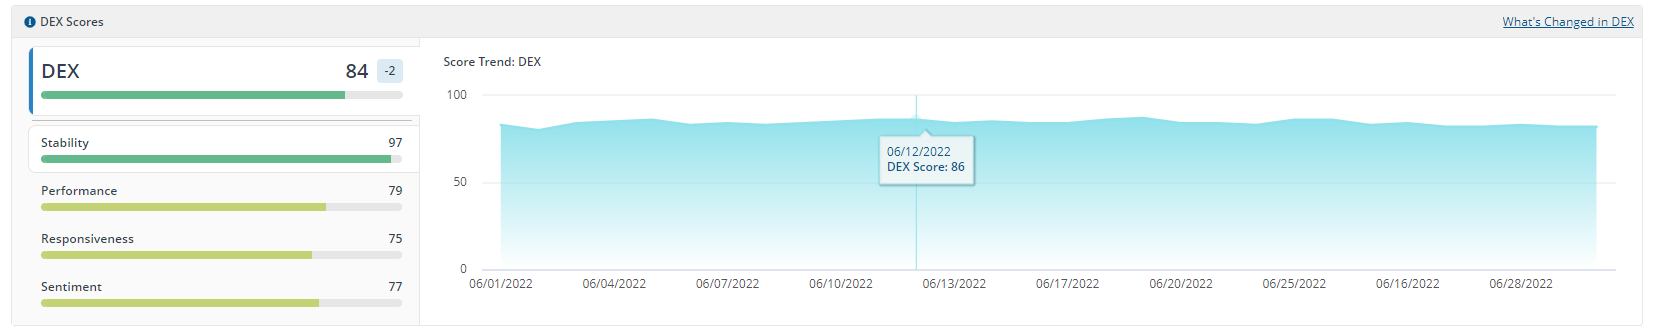
DEX Scores
Score Trend
Displays the DEX score trends for the currently selected month:
DEX
Stability
Performance
Responsiveness
Sentiment.
The DEX score includes a delta for changes in the average DEX score in the selected calendar month compared to the previous one.
The data shown is sourced from Tachyon Experience database and is aggregated for the selected time period. The DEX, Stability, Performance, Responsiveness, and Sentiment is not based on the latest score but is an average of the selected period. The DEX delta is taken from the difference between the selected time period and the previous time period.
Note
The Tachyon Instruction 1E-Experience-DexScores provides the data populating the DEX Scores tile.
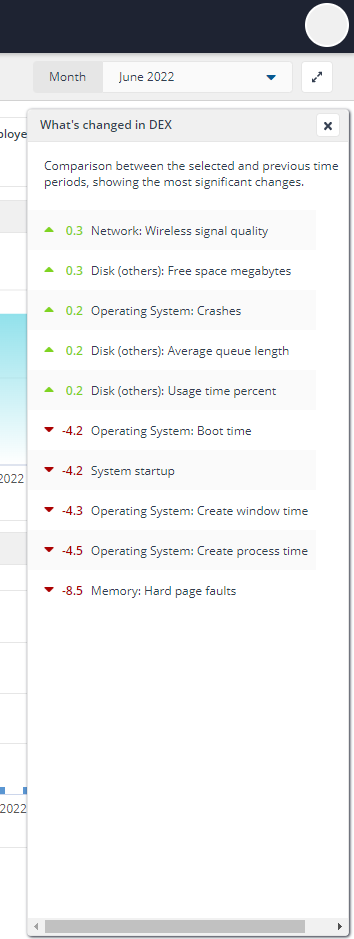
What's changed in DEX
Shows the comparison between the selected and previous time periods, showing the most significant changes that increased and decreased.
For details of all the different metrics and scores you may see here, please review The Scores.
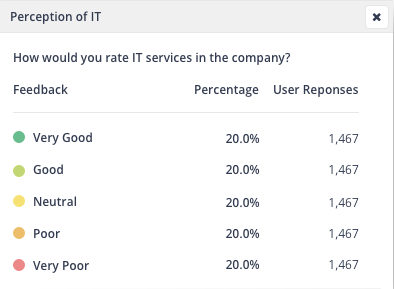
Perception of IT
The Perception of IT tile displays feedback given by end users about their experience of IT services.
Data is sourced from the Tachyon Experience database and is aggregated for your selected time period. The Perception of IT metric is not based on the latest score, but is based on an average of your selected period. To prevent bias in the results, multiple answers from the same user are averaged before the total scores are averaged. This ensures no single answer contributes more to the final Perception of IT scores than any other.
Note
The Tachyon Instruction 1E-Experience-SurveyResponses provides the data populating the Perception of IT tile.
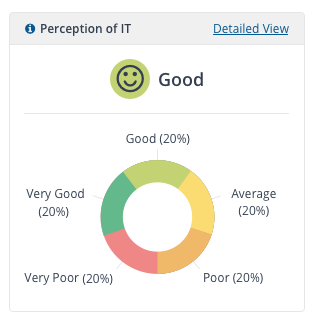
You can see a breakdown of the percentages by clicking on Detailed View.
Note
The numbers show individual user responses, which can be more than one response from the same user, across multiple devices. The responses from each user are averaged.
Operations
Number of issues resolved by manual actions, automated policy fixes, ITSM actions, Virtual Assistant actions, and other self-service requests. Hovering your mouse pointer over chart columns displays details for that time period.
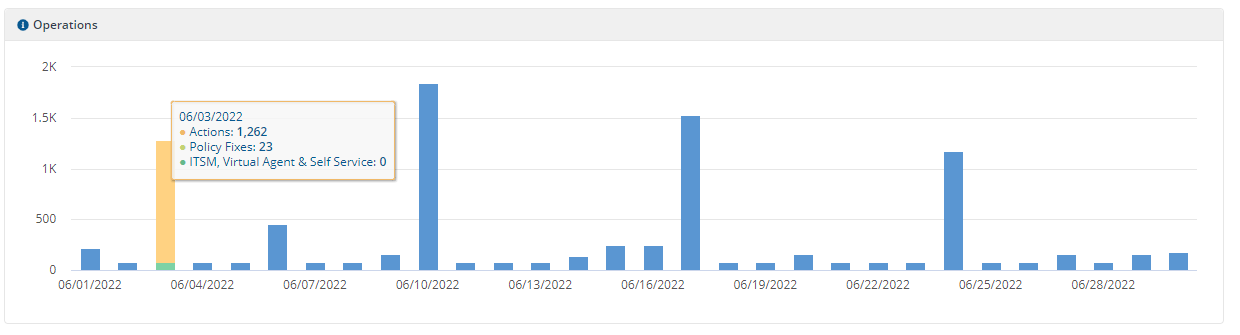
Monthly Operations drawer
Clicking on a chart column displays a drawer showing the Monthly Operations for the selected period.
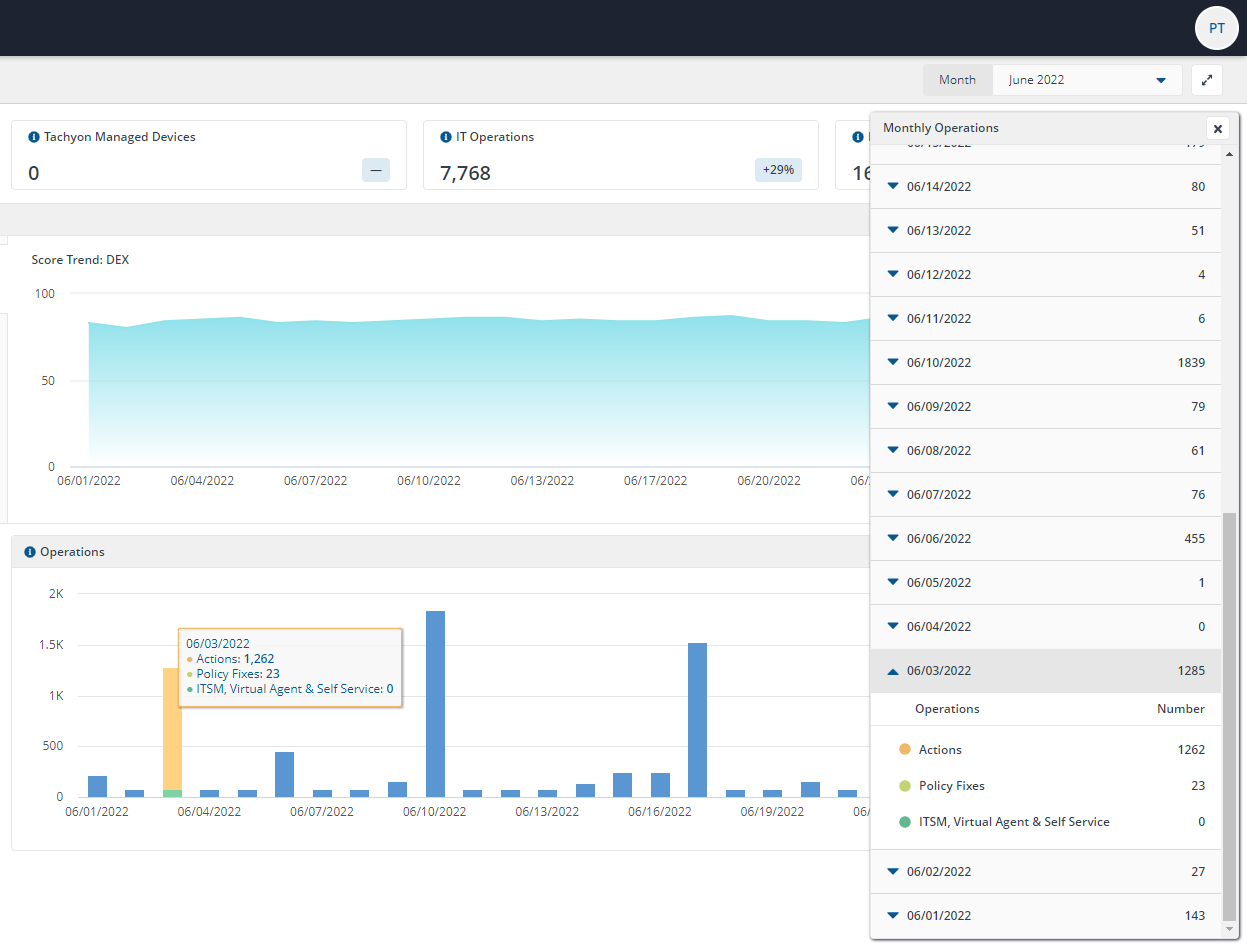
You can expand the Monthly Operations chart by day to compare specific days in your chosen time period.