Getting feedback via Sentiment Surveys
In this scenario the IT team have just completed some improvements to their network. The end-user computing (EUC) manager uses Experience to gather some continuous feedback to see if the improvements have made a difference to the end-user's experience of their service. This is done using a daily survey that gathers responses that contribute towards the Sentiment score, enabling progress and improvements to be monitored over time.
Creating a new Sentiment Survey
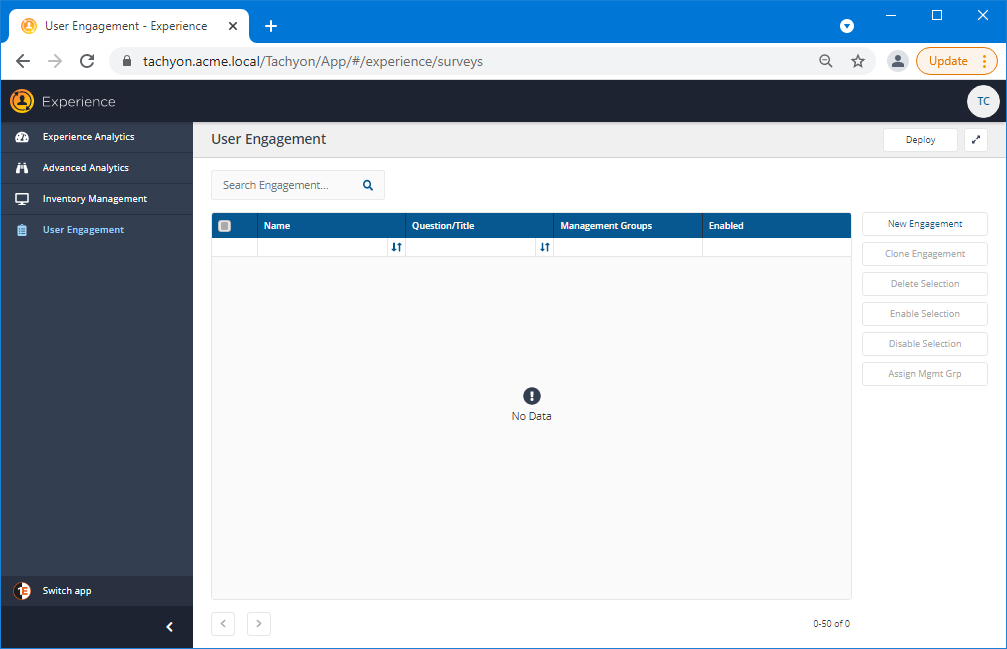
The Experience→User Engagements page is where you manage all the Sentiment, Info Surveys and Announcements that have been created in Experience. You can easily see for each Survey the Question and Options that it has been configured with, what Management Groups it has been assigned to and whether it's Enabled or not. In the picture, you can see the initial state where no Surveys are currently defined, as would be the case for a newly implemented Tachyon system.
Click the New Engagement button to begin.
Sentiment or Info Surveys?
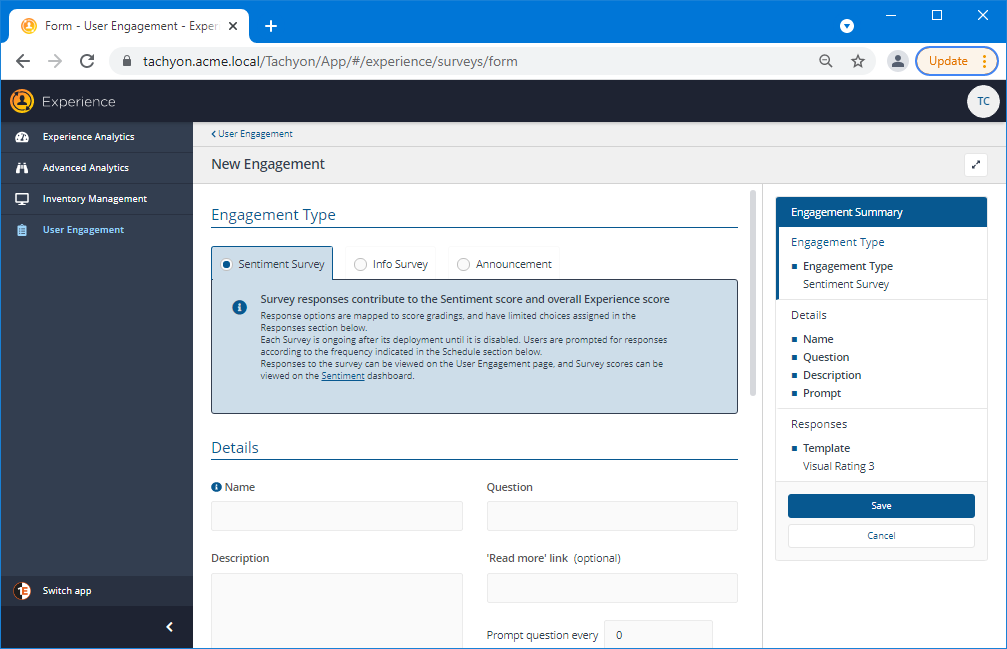
The first choice you face is whether to create a Sentiment Survey, an Info Survey or an Announcement. Announcements expect no response from users.
If the EUC manager wanted to create a one-off survey to gather some user feedback due to a particular event without wanting to monitor the results as part of an ongoing assessment of user experience, they would likely choose an Info Survey. The responses for Info Surveys can be modified to a larger extent than Sentiment Surveys, making them great for doing an arbitrary quick poll, but they don't contribute to the Sentiment Score and therefore cannot be monitored over time. For more information on Info Surveys please refer to Getting feedback via Info Surveys.
Sentiment Surveys are more limited than Info Surveys in the range of possible responses you can select from, but this also means they can be consistently measured and reported on. In our scenario, the EUC manager wants to create a survey that contributes towards the Sentiment score they'll be able to monitor from the Experience Overview page, this means they need to create a Sentiment Survey.
Names, Questions, Descriptions and Frequency
Having selected the Sentiment Survey type the next steps are to set a Name for the survey, the Question and Description that will frame the purpose of the survey and the range of Responses that will be allowed.
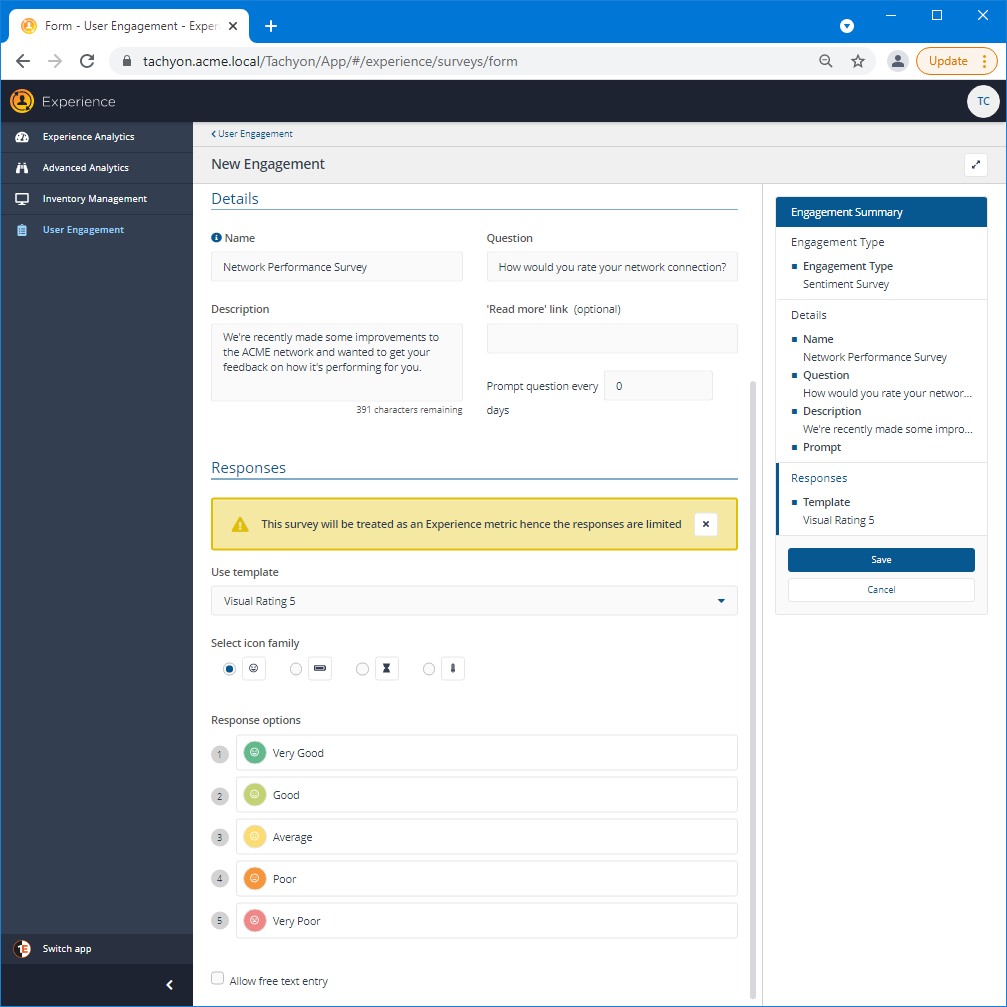
The Name for the survey will be stored as a metric that Experience can then report on. This Name must be unique amongst all the metrics that are used by, or have been defined for Experience. In this scenario this is set to Network Performance Survey. But, be aware that Network on its own could not have been used as the Name, as this is already a metric that Experience reports on.
The Question frames the meaning and purpose of the survey, if the question you choose has not been thought through carefully you will likely confuse your end-users and skew the results. You should also consider the responses you are setting for the survey as they should relate directly to the question. For example, if, like in our scenario, you choose Visual Rating 5 - which gives you five options ranging from Very Good to Very Poor - you would have problems if your question was: Is your network performing badly? How would you map that question onto the range of chosen responses? Here the question text has been defined as: How would you rate your network connection? You can see how each of the possible responses could be a suitable answer, so this seems an appropriate question.
The Description lets you provide some additional context for the question, and can be used to engage the end-user and provide some guidance as to how the question should be considered. Here the Description is defined as: We've recently made some improvements to the ACME network and wanted to get your feedback on how it's performing for you. This sets the scene for why the question is being asked and gives a small indication on how it could benefit the end-user. The survey is part of a process for improving the performance of the network, and the user's response could help in that process and encourages them to work with the IT department. This aspect of the survey is subtler than determining the question but can still be important in terms of encouraging the maximum number of responses possible.
The Description is limited to 512 characters, if you have a site where you can provide additional information with more context for the survey question you can add a link in the 'Read more' link (optional) field.
Prompt question every x days lets you select how often the survey will be presented to the end-users. We've mentioned that Sentiment Surveys are a way of assessing progress or change from the perspective of the end-users. They are part of a continuous process, and the frequency determines how often data points are taken in order to measure the process. By repeating the question, end-users get the chance to change their responses according to the ongoing performance. But timing is critical, set a schedule that is too often and the end-users may get tired and not respond as often as you would like. Set a schedule that is too seldom, and you may miss out on some changes that occur between polls.
In our scenario, the IT department has just made the improvements to the network, and they are keen to get immediate feedback on how those changes are working and how the systems are adjusting to the changes. So the EUC manager sets the most frequent Schedule of prompting the question every day with the view that as the changes mature the Schedule for the question can be adjusted to a larger interval.
Responses
As mentioned earlier, the Responses must be closely linked with the Question text, and you will likely need to adjust both before you get a suitable fit that is obvious, simple and effective.
For Sentiment Surveys, you can choose a range of 3 or 5 responses, and they can be displayed with several sets of icons or just numbers. You can't change the text of the Responses or the order. Limiting the Responses in this way enables the survey to be measured consistently and contribute to the Sentiment score and ultimately forms a part of the overall Experience score.
Info Surveys let you choose a greater range, edit the response text and select from a wider palette of colors and icons. But, because of that flexibility, they cannot be measured consistently and therefore cannot contribute towards the Sentiment score and have no bearing on the overall Experience score.
The Allow free text entry checkbox gives the end-users the opportunity to qualify their responses by typing in any text they feel would help clarify their choice. This does not contribute towards the score but can be invaluable in helping you to interpret the results of the survey. In our scenario, the EUC manager chooses to let the responses speak for themselves and leaves the box unchecked.
Saving the new survey
When you're happy with the settings you've made in the survey editor, you can click Save to commit the changes and continue to the next step.
Enabling surveys
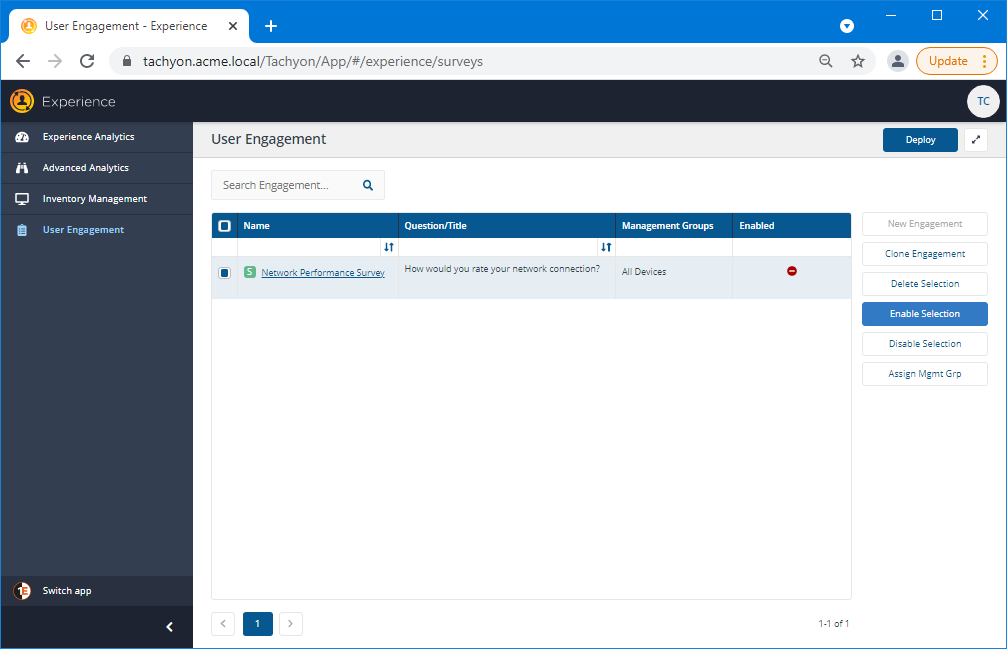
Before a new survey can be deployed, it must first be enabled - this is an extra gateway that prevents the survey being sent out too soon before it's ready.
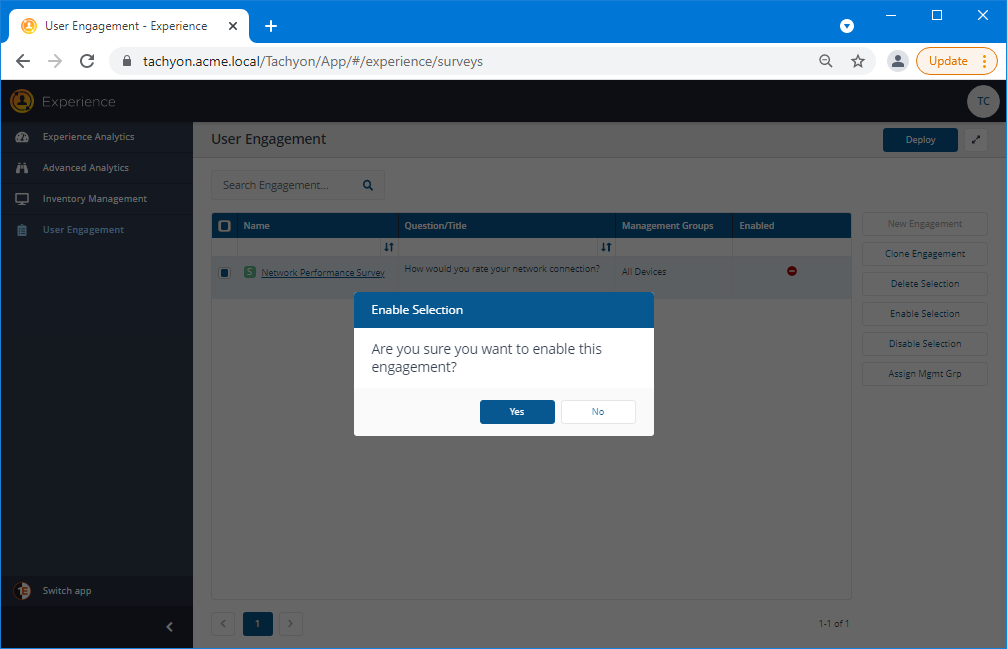
To enable one or more engagements, select the checkbox at the left-hand end of each engagement's entry in the Engagements table and then click the Enable Selection button.
Doing this displays an Enable Selection confirmation popup that you must acknowledge before the selected survey(s) are actually enabled. Click Yes to confirm the operation and No to cancel it.
Deploying surveys
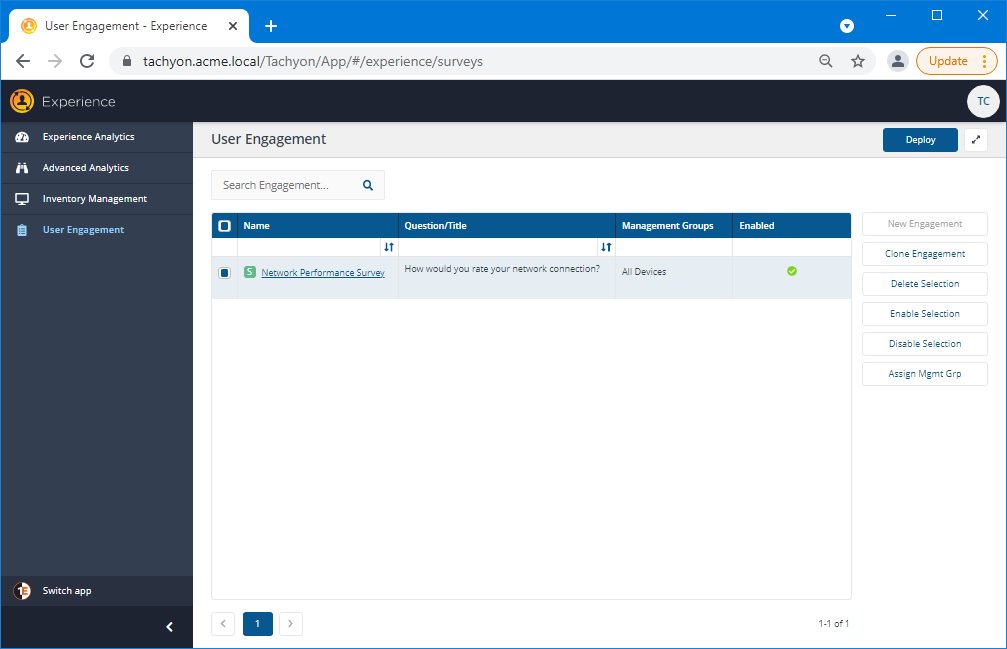
The new survey has been enabled, it can now be sent to the end-users' devices by clicking the Deploy button. When a survey is created, the Management Groups parameter defaults to All Devices. This means that clicking Deploy targets all the devices currently and subsequently connected to Tachyon.
Note
The Deploy button sends out any changes to the states of the surveys - meaning you can also use it to set previously deployed surveys to not Enabled, thereby preventing further responses without completely deleting the survey, or you can delete surveys when they are no longer needed. You should be aware that the Deploy button will also send any other User Engagement administrator's changes.
It's good practice to test the survey on a few machines first before deploying to All Devices. This lets you see how the survey will appear to your end-users and gives you the opportunity to debug the text and selections before deploying to a wider audience. Doing this involves assigning a different Management Group to the survey that targets the selected devices. The Assign Mgmt Grp button can be used to limit the survey's targeted devices to a specific Management Group.
In our example, which only involves a few devices anyway, to keep things simple we can get away with deploying the survey without testing, so the EUC manager clicks the Deploy button.
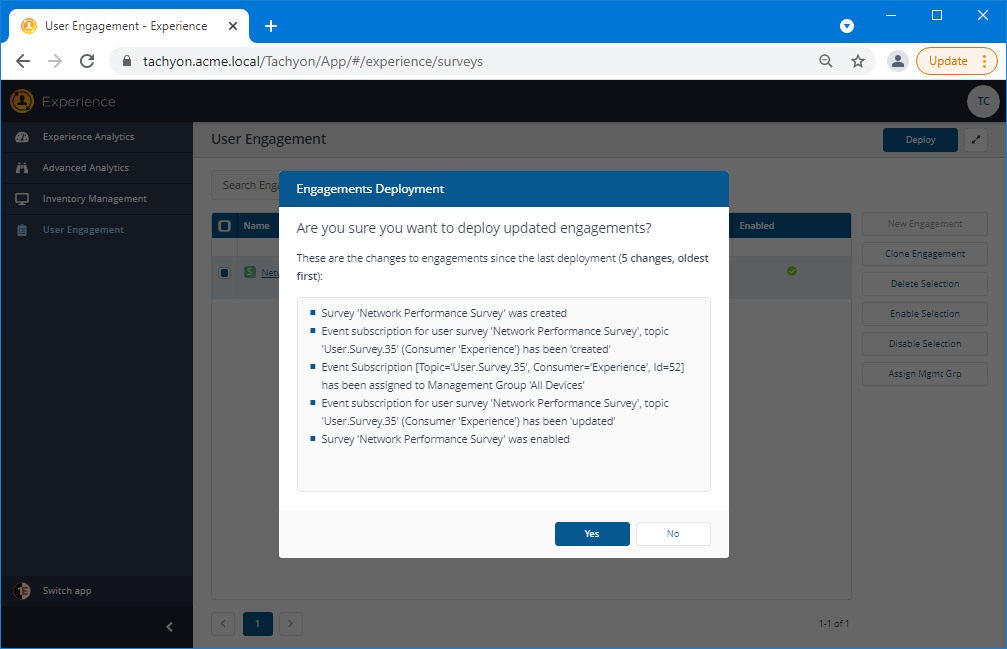
A Policies Deployment popup appears that shows the changes that will be deployed when the Yes button is clicked. The EUC manager reads the list carefully, sees that the only changes are the ones related to creating and enabling the Network Performance Survey and clicks Yes.
Monitoring surveys
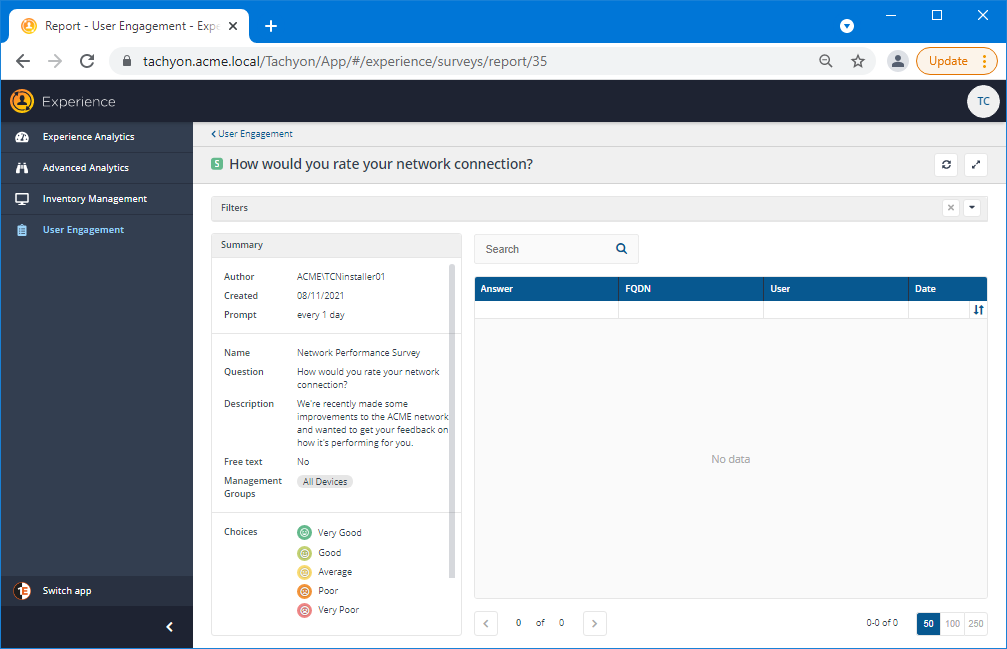
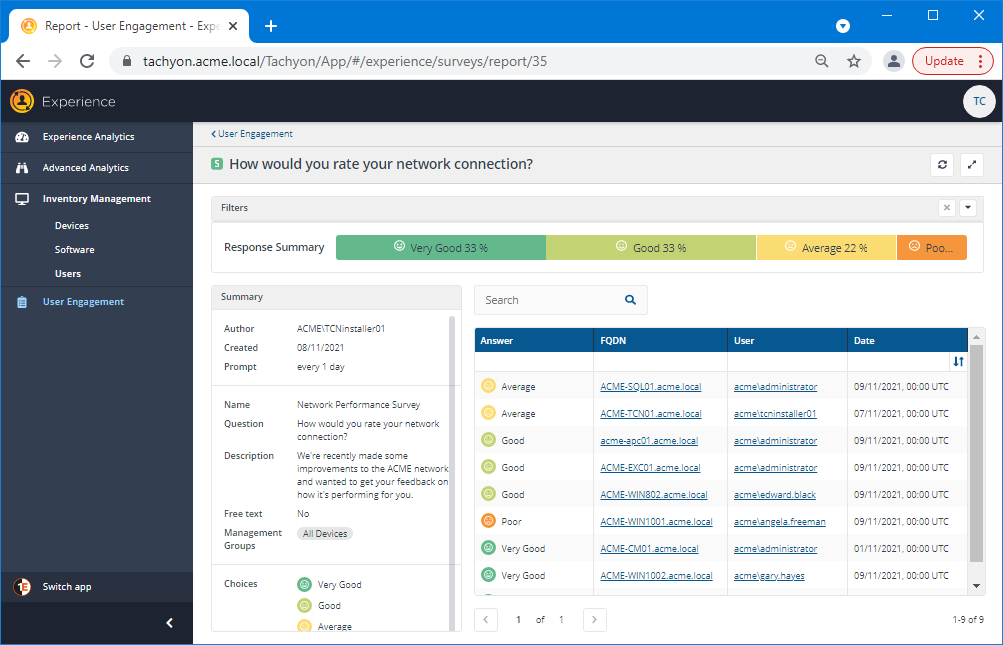
Now the survey has been deployed, you will likely want to monitor its responses as they occur. In our scenario, the EUC manager clicks on the Network Performance Survey link in the Name column for the survey in the Engagements table, to display the responses page for that survey.
What the end-user sees
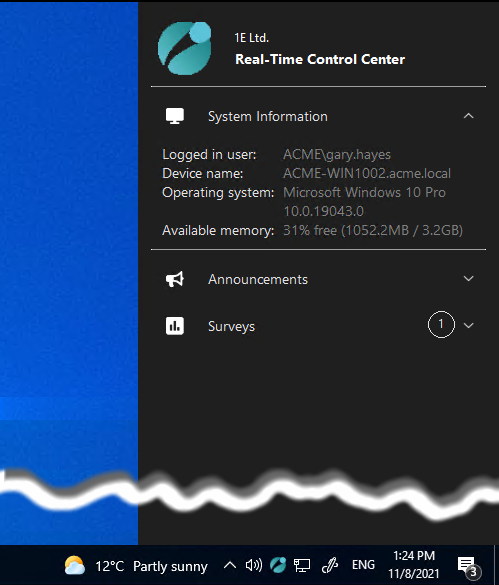
When the 1E Client is installed on a network device, by default it also adds an icon to the notification area that displays the Real-Time Control Center (RTCC). Initially this may be hidden, but can be dragged onto the taskbar to make it always visible. When an end-user clicks on the icon they will see an information bar with various section, as in the picture, that shows them:
Section | Description | ||||||||||
|---|---|---|---|---|---|---|---|---|---|---|---|
Icon and title | Displays an icon, a company name and title for the Real-Time Control Center. | ||||||||||
System Information | A collapsible section that provides information about the device and session where the RTCC is being displayed:
| ||||||||||
Announcements | A collapsible section that lists any current announcements targeted at the device. | ||||||||||
Surveys | A collapsible section that lists any current surveys targeted at the device. |
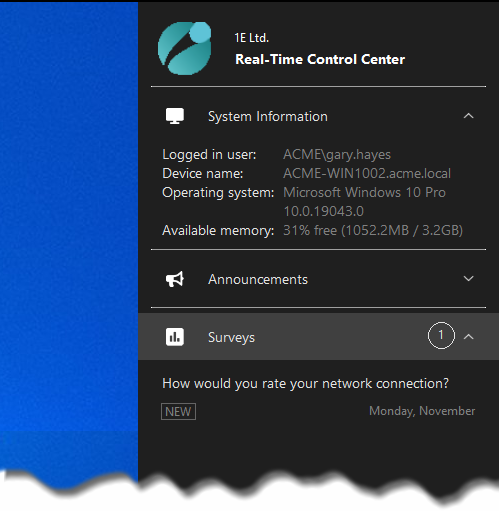
In our scenario the end-user Gary Hayes clicks on the notification icon to open the RTCC. They then expand the Surveys section to see survey question text for the newly deployed survey waiting to be answered, as shown in the picture.
Note
Surveys will also automatically popup to prompt the user without them having to manually select the item from the RTCC. This happens at what the 1E Client assesses to be the best moment according to the user's interaction with the device and whether they have chosen to allow the 1E Client to disturb them or not.
Note
The following 1E Client settings are used to configure the behavior of the Real-Time Control Center. If you click on a link, it will take you to the 1E Client documentation space.
Module.Interaction.Enabled | Module.Interaction.ActiveSessionThresholdSeconds | Module.Interaction.CompanyName | Module.Interaction.DoNotDisturb | Module.Interaction.IdleSessionThresholdMinutes | Module.Interaction.ITSM.ServiceNow.CreateIncidents | Module.Interaction.ITSM.ServiceNow.Enabled | Module.Interaction.ITSM.ServiceNow.GoBackDays | Module.Interaction.ITSM.ServiceNow.Url | Module.Interaction.LogSessionNotificationReadiness | Module.Interaction.MinimumMinutesAfterLogonBeforePrompt | Module.Interaction.MinimumMinutesAfterSessionActivationBeforePrompt | Module.Interaction.MinimumMinutesBetweenPrompts | Module.Interaction.NotificationIcon | Module.Interaction.PeriodsBeforeUiLaunch | Module.Interaction.PeriodsBeforeUiLaunchTimeout | Module.Interaction.Port | Module.Interaction.ResponseAuditsBeforeTidy | Module.Interaction.ResponseRetentionRows | Module.Interaction.SampleExclusionList | Module.Interaction.SampleUserInteraction | Module.Interaction.SnoozeTimeMinutes | Module.Interaction.Theme
Submitting a response to the survey
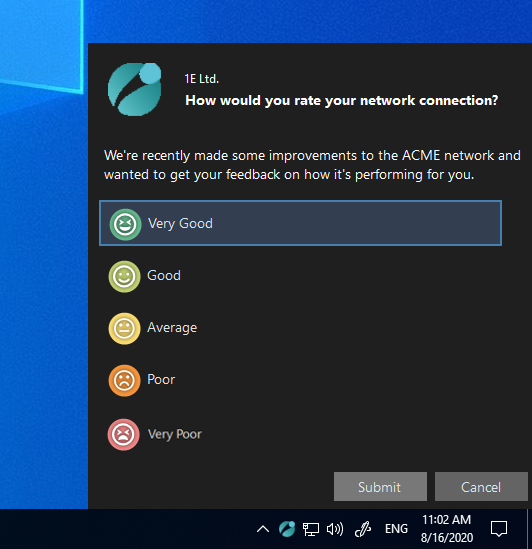
Clicking on the text of the survey question in the Surveys section displays the survey, showing the range of responses that can be made, as seen in the picture opposite.
Gary Hayes is happy with the way that the network is currently performing, so he clicks on the Very Good response and then clicks Submit.
Viewing survey responses
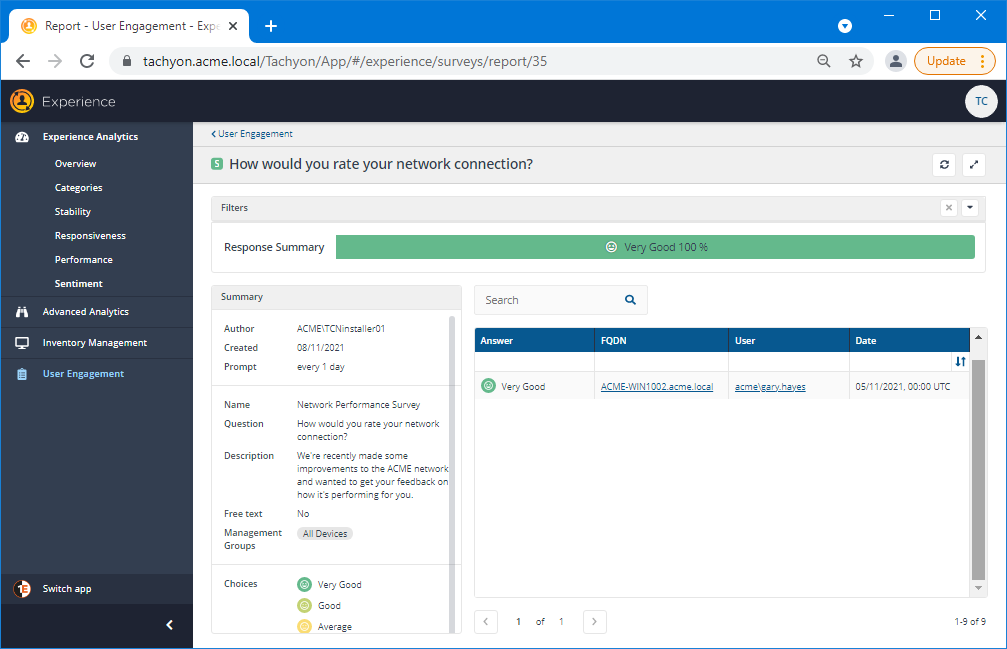
Pretty soon after Gary Hayes has submitted his response, the EUC manager sees it appear in the Experience interface.
After a number of responses have been made, a clearer picture of the current user sentiment emerges. Here the EUC manager can see that overall the responses have been positive, with 33% being Very Good and another 33% being Good. There are a couple of outlying responses though that might merit some additional investigation.
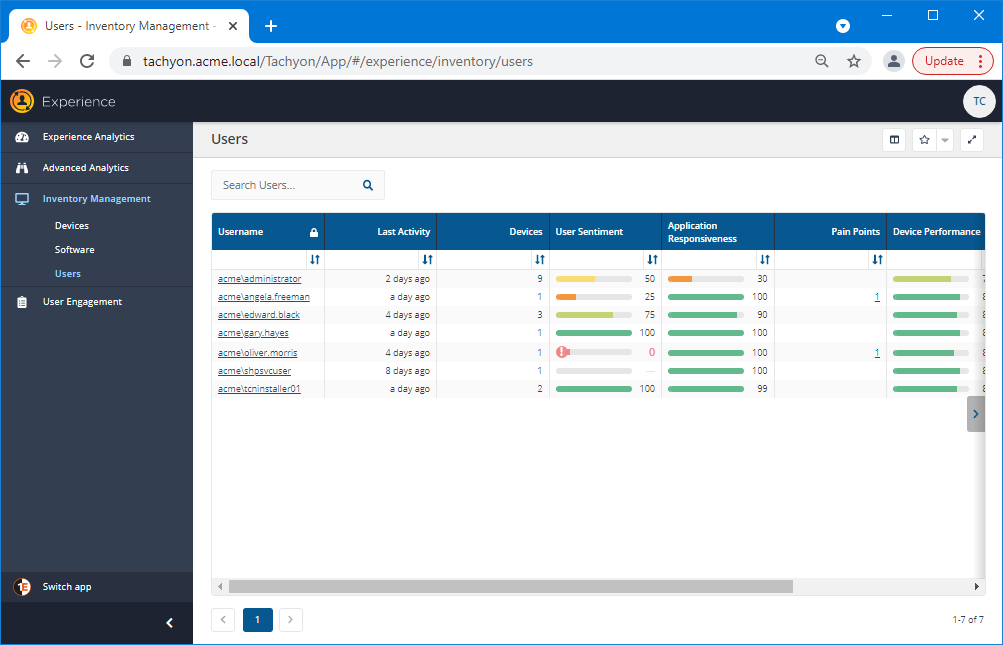
Viewing the Users page
Now the current set of responses are in, the EUC manager clicks on the Experience→Users page to view how Experience has rated their scores across a range of measurements. Here they notice that one of the users, Oliver Morris, has an exclamation mark showing in the User Sentiment column.
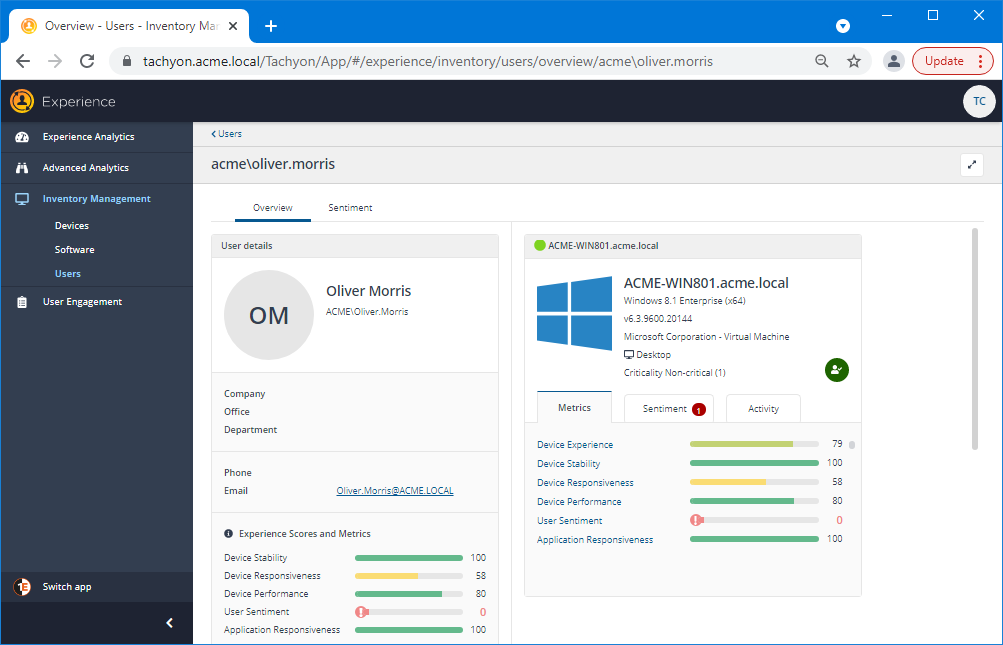
Clicking on the Username link for a user navigates to a page that displays information related solely to that user. Here the EUC manager has clicked on the link to view the page for oliver.morris. A number of details related to the user are displayed, the Metrics tab and the User Sentiment score are of interest here - particularly the exclamation mark displayed.
Viewing the user's Sentiment Survey responses
Clicking on the Sentiment tab displays the history of survey responses made by the user. For Oliver.Morris their response to the How would you rate your network connection? survey was to rate it as Very Poor. This is an interesting outlier for the survey responses and warrants further investigation, especially given that the other Experience scores for this user are coming back as good.
The EUC manager could click on the user's email and request some clarification directly. Perhaps there was some other cause for the Very Poor rating, such as an accidental response - or perhaps there were other environmental issues that haven't yet come to light. Nonetheless, the manager has been able to investigate the response and is empowered to do something to resolve the user's issue.

Adding the new survey to the Sentiment page
Now that the EUC manager has seen that the survey is returning the type of information that helps assess how the ACME network changes are affecting users, they would like to have those results figure more prominently and be easier to access. To do this they can add a tile for the survey to the Sentiment page. By default, the Sentiment page just shows the User sentiment - Latest Score tile, so there's plenty of space available for you to add your own Sentiment Survey tiles.
Editing the page layout to add the new Sentiment Survey
You can change the tiles that are displayed on the page by clicking on the Edit Layout button in the page header.

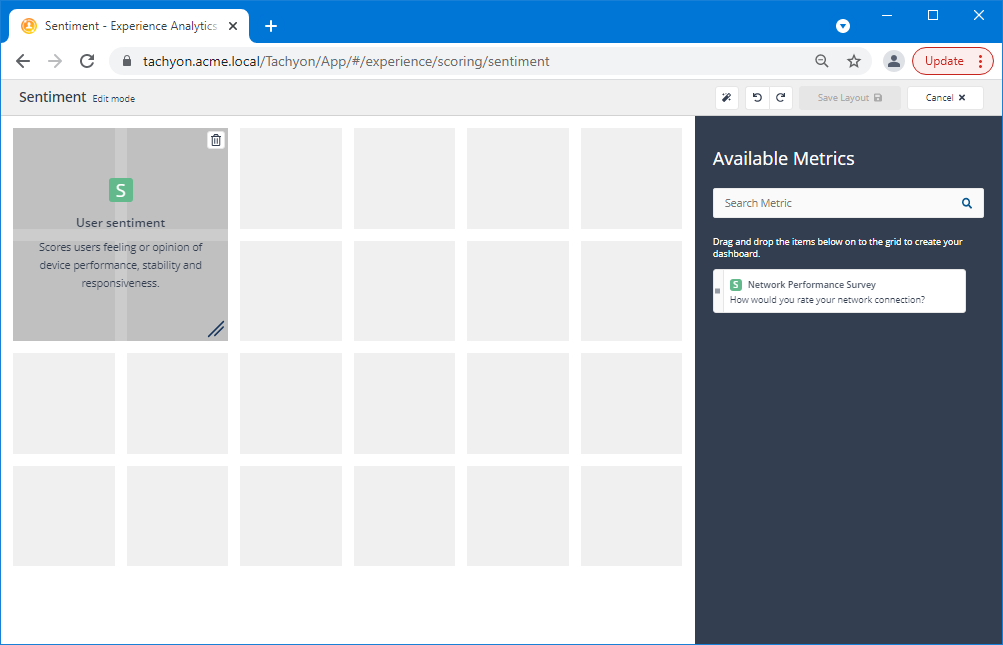
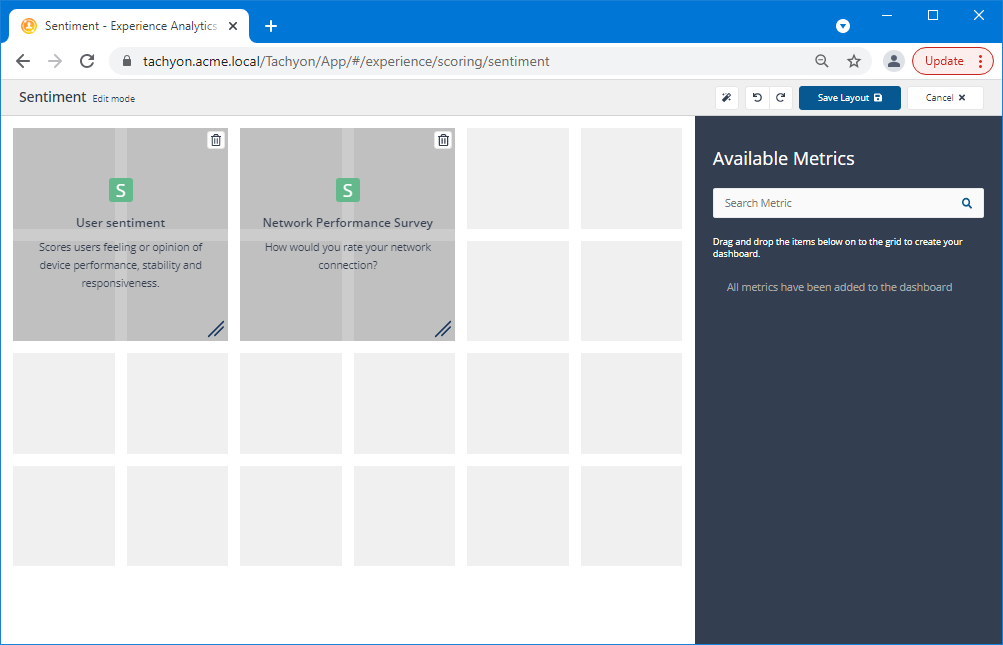
Clicking on Edit Layout opens up the Sentiment Edit mode. Here they can see the tiles that are already displayed on the page as well as the Available Metrics, that is the metrics that can be added to the page. As mentioned earlier the metric that gets added to the system for Sentiment Surveys is the same as the name set for the survey when it was created.
The EUC manager can see the Sentiment tile on the left-hand page layout pane, which is the default tile for the Sentiment page, and also the Network Performance Survey entry in the Available Metrics section. To add the new tile they click and drag it from the Available Metrics over on to the layout pane.
There are different options for the location of the tile and its dimensions, as described in Adding metrics to a dashboard, here the EUC manager just places the new tile next to the existing one and keeps it at the default size of four squares.
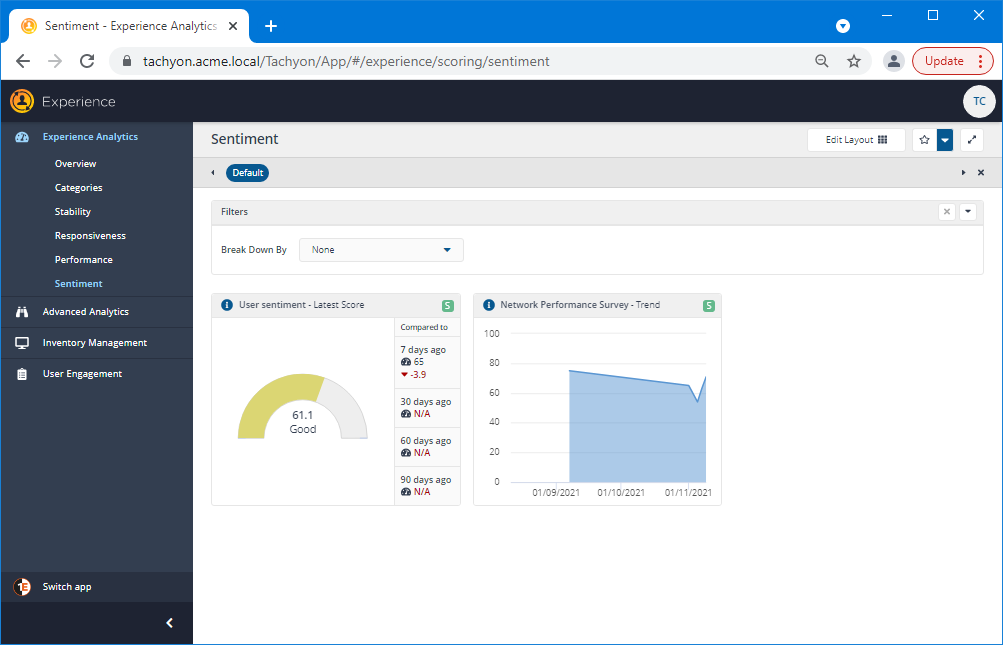
Clicking Save Layout applies the layout to the Sentiment page.
Changing the tile display
The EUC manager has added the Network Performance Survey tile to the Sentiment page, but it's still not quite displaying the information the way they want to see it. Instead of a line graph, they want to see the latest score for all the 5 possible responses.
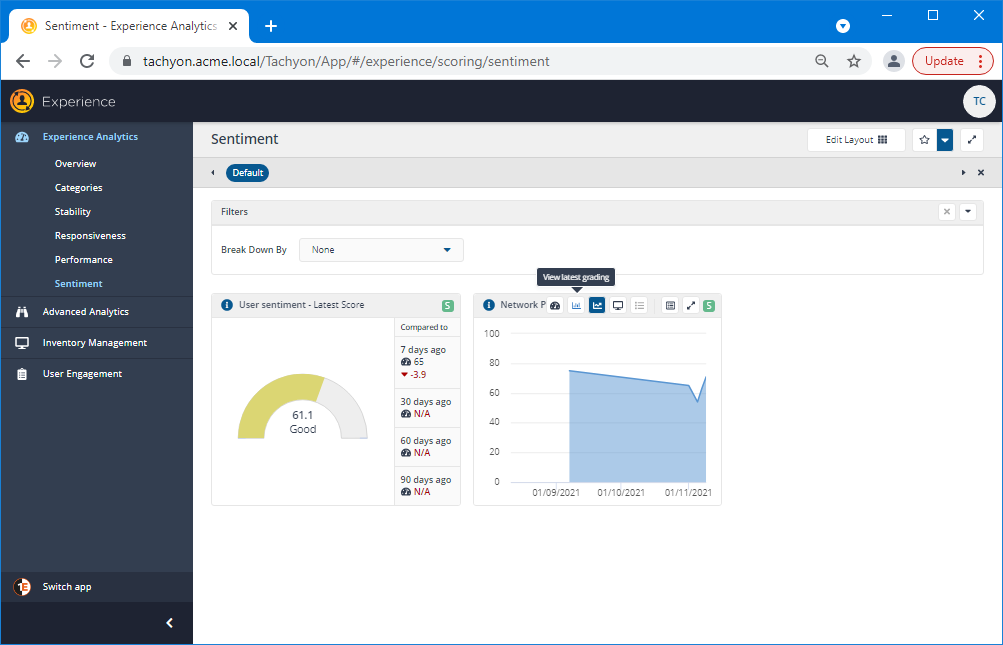
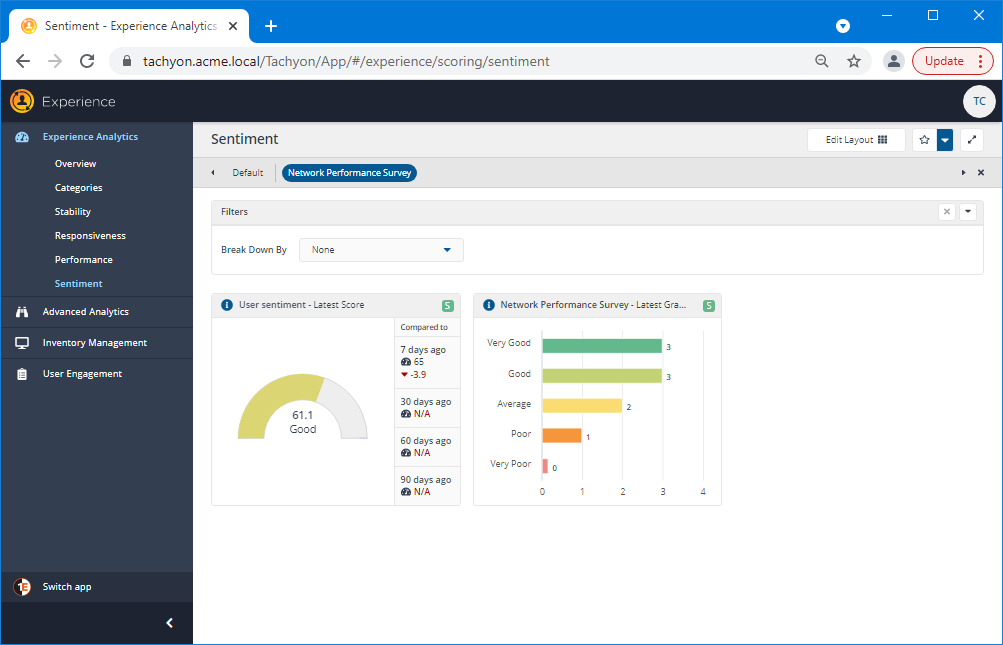
Clicking on the View latest grading button in the tile heading will provide the graphic needed.
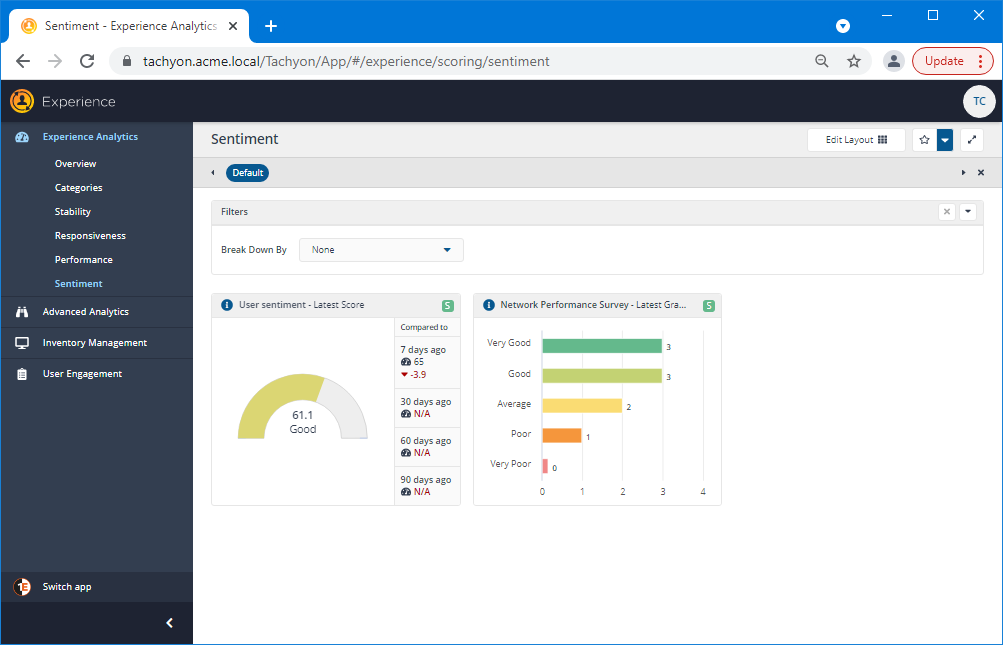
So this is the view the EUC manager wanted. Now they need to make it easily accessible after a page refresh or revisiting the site at a later date. To do that they need to save the layout as a Preset, which is done by clicking on the star button in the page header.
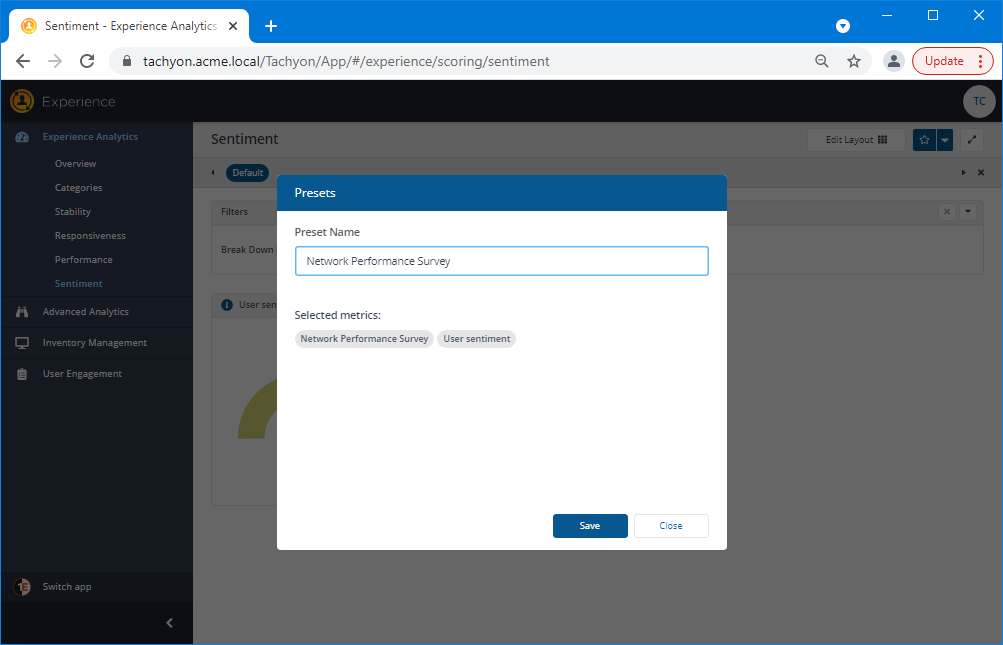
In the Presets popup they add a suitable name for the Preset and click Save.
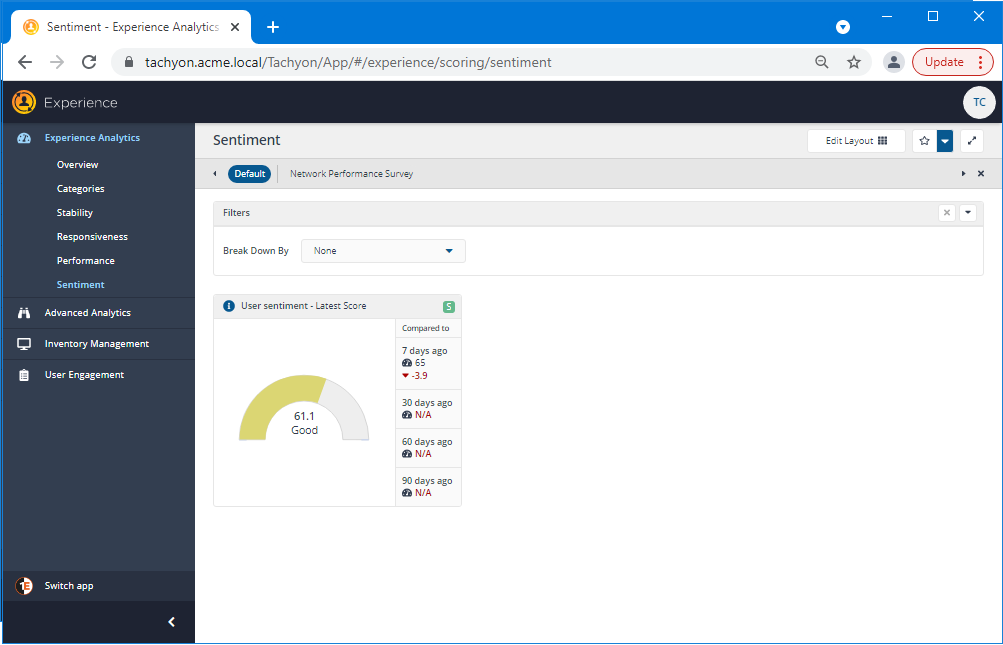
The new Network Performance Survey Preset is added to the page.
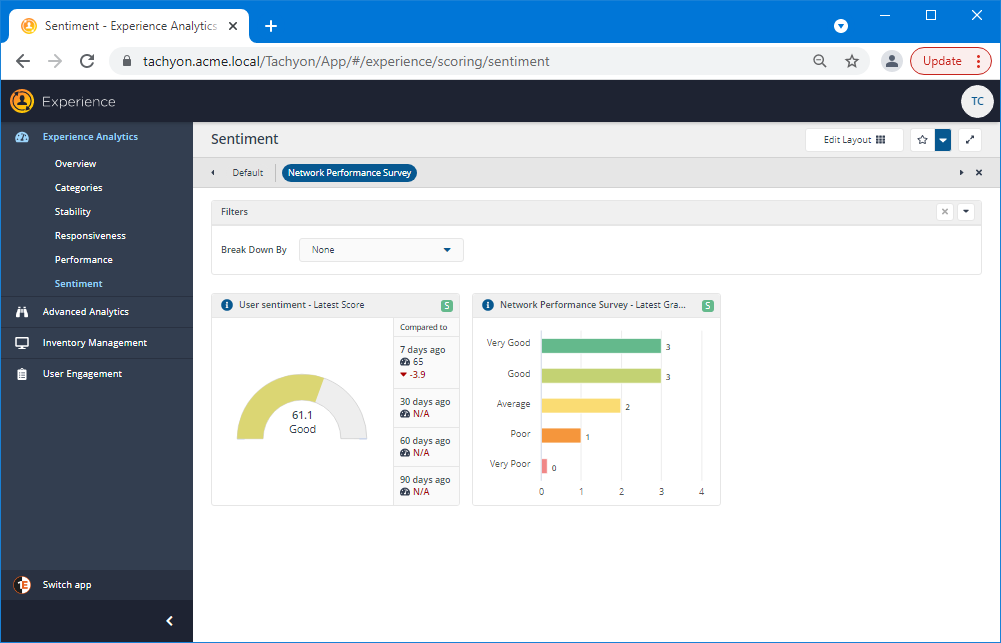
Now when they refresh the page it will revert to the default as normal, but they can easily get back to their tailored view by clicking on the Network Performance Survey Preset.
As they create new Sentiment Surveys, further tiles can be added to this view and stored in the same way, so the EUC manager can keep track of how their users are responding.
Next steps
Now that you've seen a possible way of using Sentiment Surveys for capturing ongoing feedback from end-users, you might want to take a look at Getting feedback via Info Surveys to see how one-off Surveys can be created, deployed and monitored in the Experience application.