Device View
The Device View is a shared page accessible from many applications.
The Overview and 1E Client tabs are always present in the Device View. Other tabs are visible if an app has been installed and is licensed.
Each tab has one or more panels with tiles populated with data from various sources, some by instructions that are run instantly, with results cached for 3 minutes. An appropriate error message is displayed instead of a tile in the following circumstances:
If the device is offline, as indicated by the color of the icon in the top left
The user does not have at least Viewer permission to view use the license the tab or panel
The user does not have questioner permission to run the instruction
An instruction has not been uploaded.
The Device View tabs and panels page lists the names of tabs and their panels, and a description of each tile indicating how the tile is populated.
The Device view in other Tachyon platform applications
The Device View is a common view used in multiple apps to present device details. The aim of the Device view is to provide a combined overview of all the information known about a device along with the ability to retrieve information about the device in real-time. Each application displays a different default tab (see below), other tabs are visible if an application has been installed and licensed, and the user has permission to use the application.
Tachyon application | Device page | Device page default tab | Device view | |
|---|---|---|---|---|
Clicking on one of the links in the FQDN column of the Experience Devices page displays the Device view for the selected device. When displaying the Device view from a Experience page the view defaults to the Experience tab. The Experience tab contains information derived from and useful for Experience. |
| |||
Clicking on the information icon next to the device name in the Device Name column of the Devices Table page displays the Device view for the selected device. When displaying the Device view from the Explorer Devices Table page, the view defaults to the Overview tab. |
| |||
Clicking on one of the links in the Device Name column of the Explorer Devices page displays the Device view for the selected device. When displaying the Device view from a Explorer page the view defaults to the Policies tab. The Policies tab contains information derived from and useful for using Explorer. |
| |||
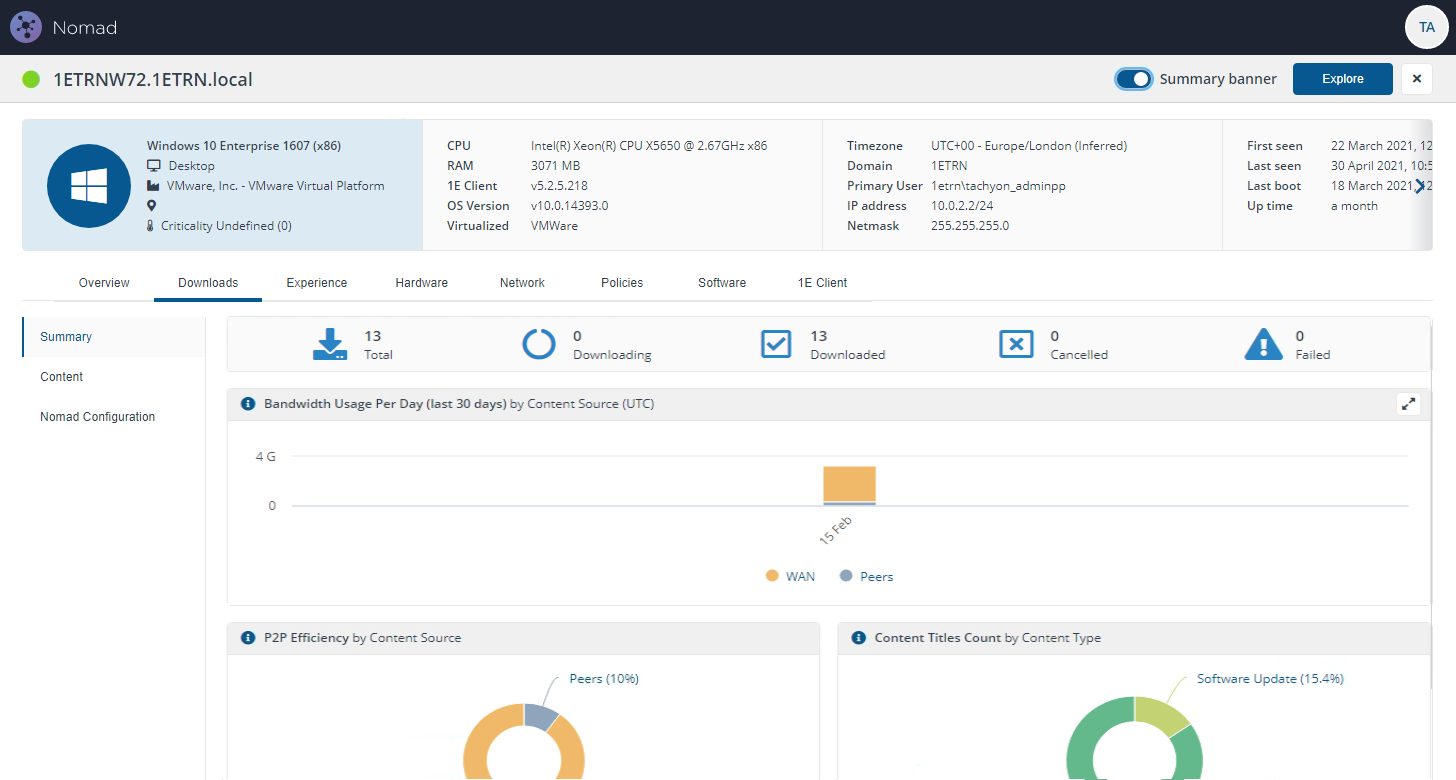
Clicking on one of the links in the FQDN column of the Nomad Devices page displays the Device view for the selected device. The default view in the Nomad devices view is Downloads. |
|
Summary banner
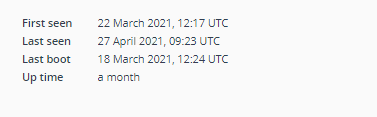
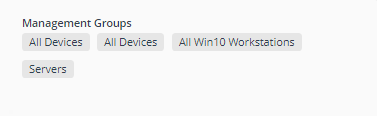
The Summary banner displays a quick summary of the information provided in the various tabs displayed in the Device View. It can be viewed by toggling the Summary banner switch to on.
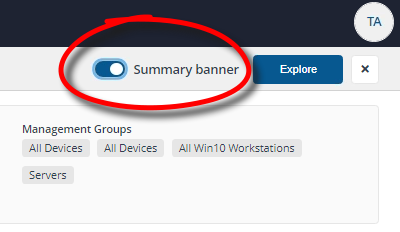
The following picture shows the Summary banner displayed for a particular device.

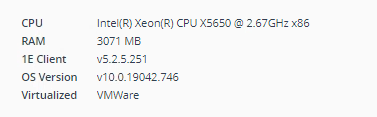
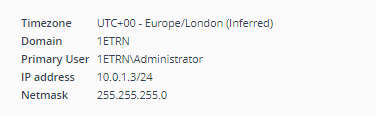
Summary banner panels
The following table describes the information provided in the Summary banner.
Panel | Description | Data source | ||||||||||||||||||||||||||||||||
|---|---|---|---|---|---|---|---|---|---|---|---|---|---|---|---|---|---|---|---|---|---|---|---|---|---|---|---|---|---|---|---|---|---|---|
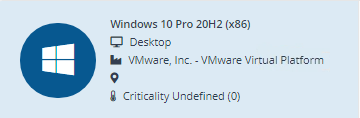 | Shows details equivalent to the following tiles:
| Data from Tachyon Master (the latest online status message) | ||||||||||||||||||||||||||||||||
 | Shows details equivalent to the following tiles:
| |||||||||||||||||||||||||||||||||
 | Shows details equivalent to the following tiles:
| |||||||||||||||||||||||||||||||||
 | Shows details equivalent to the following tiles:
| |||||||||||||||||||||||||||||||||
 | Shows details equivalent to the following tiles:
|
Exploring a device from the Device View
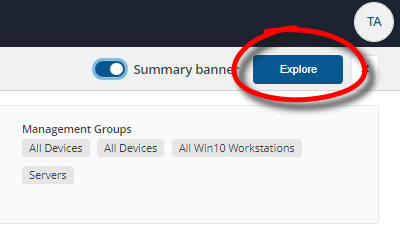
You can click on the Explore button in the Device View to launch Explorer with the current device set as the scope.
Closing the Device View
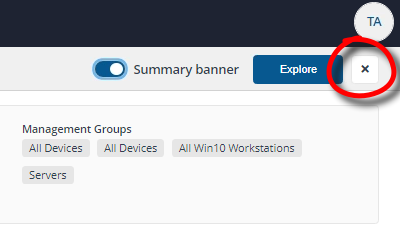
The Device View is a popup that is displayed when clicking on the name of a device on a page where devices are displayed. To return to the page you came from you need to click the x button.
 |
The Device View tabs and panels
Tab | Panel | Description | Data source | |||||||||||||||||||||||||||||||
|---|---|---|---|---|---|---|---|---|---|---|---|---|---|---|---|---|---|---|---|---|---|---|---|---|---|---|---|---|---|---|---|---|---|---|
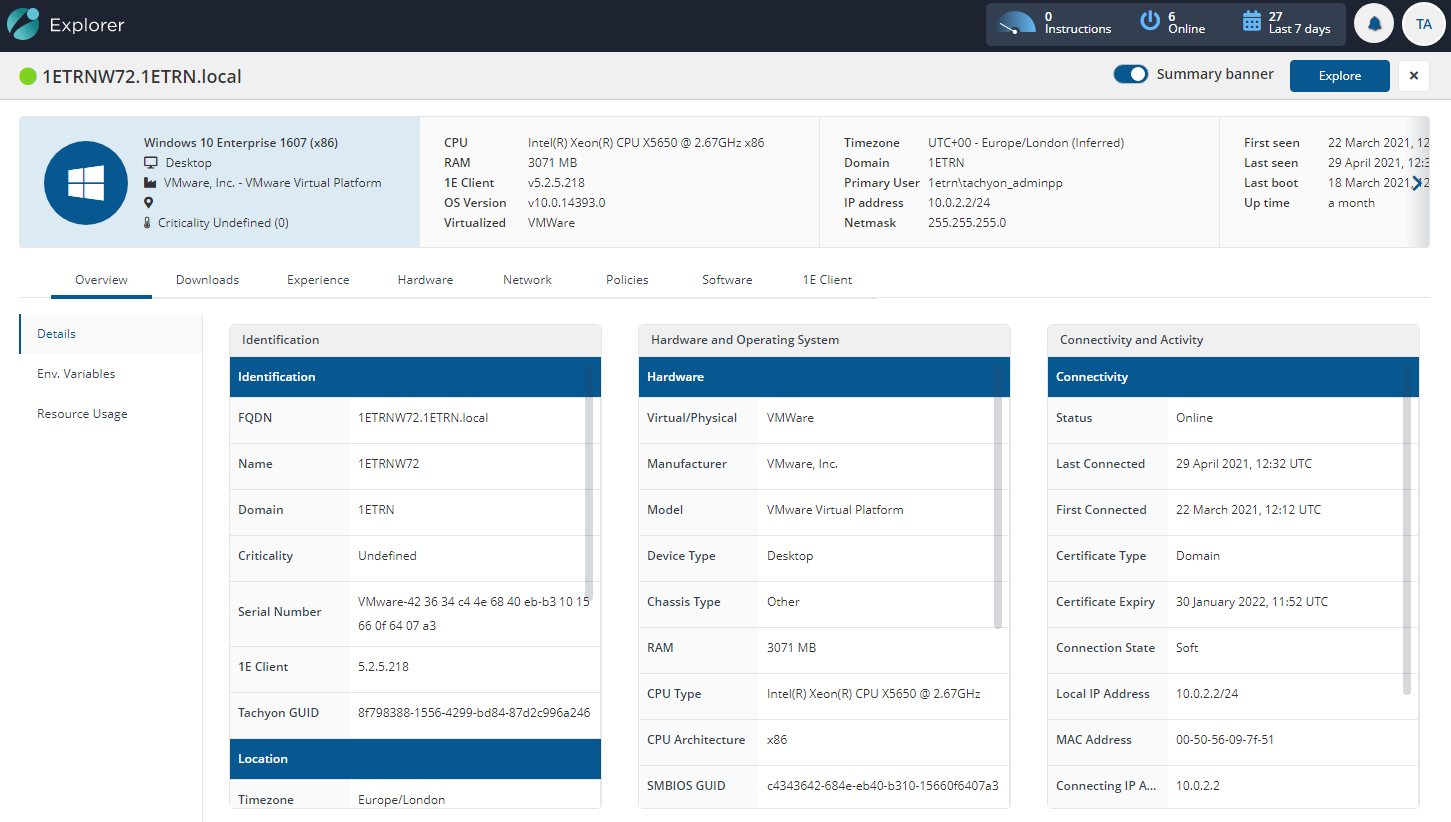
Overview | Details | Displays a number of tiles sorted into Identification, Hardware and Operating System and Connectivity and Activity columns that show information for the selected device retrieved from the online status information stored in the TachyonMaster database. The columns and tiles are shown in the following table:
| Data from Tachyon Master (the latest online status message) | |||||||||||||||||||||||||||||||
Env. Variables | Shows a list of the environment variables set on the device. | |||||||||||||||||||||||||||||||||
Resource Usage | Two panels:
| |||||||||||||||||||||||||||||||||
Downloads | Summary | Download activity and status for the device. Whenever you click on an FQDN on any of the Nomad pages then the Device View will be displayed with the Downloads tab selected. | Data from Nomad. | |||||||||||||||||||||||||||||||
Content | Content Titles on the selected device, the default view is from All Sources, All Types and All Status. NoteYou may see a difference in the number of items in a device’s Nomad cache versus that displayed in the Nomad app Device View. This is because if downloaded content has been deleted from Configuration Manager, the content titles cannot be resolved in the Nomad app and are not displayed. This is under consideration for re-design and may be revised in future versions of Nomad. | Data from Nomad. | ||||||||||||||||||||||||||||||||
Nomad Configuration | 1E Nomad Branch Settings . | |||||||||||||||||||||||||||||||||
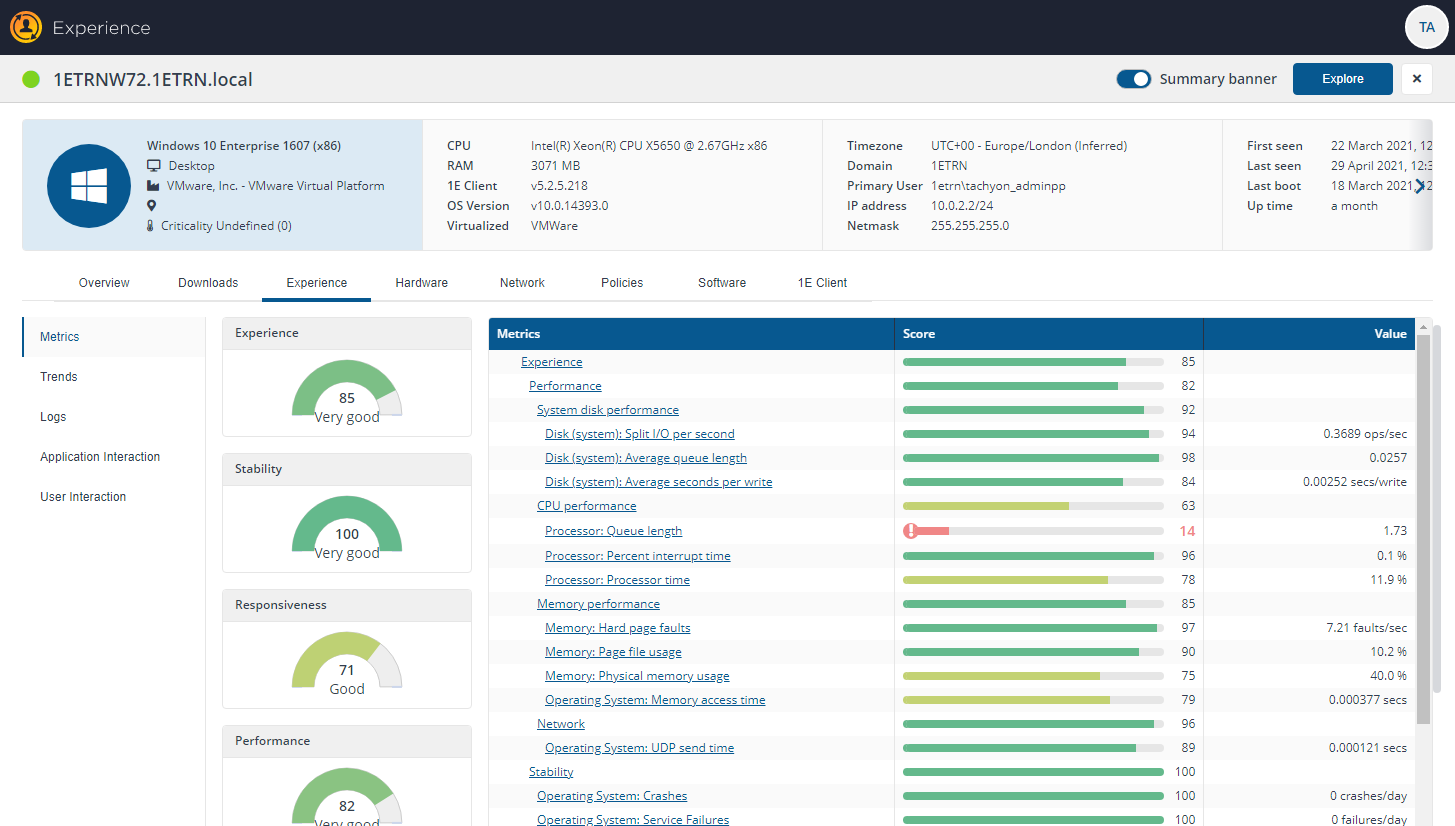
Experience | Metrics | Metrics are the data points that are collected by the 1E Client and sent to the Tachyon server. They are collected at different intervals depending on the type of data that is being collected. | Data from Experience metrics | |||||||||||||||||||||||||||||||
Trends | The Trends tab shows the changes in the scores over time. Hovering over any of the bars shows the details for that time and event. If the user viewing the device details also has the ability to at least ask a question in Explorer the Explore button will be visible. | Data from Experience metrics | ||||||||||||||||||||||||||||||||
Logs | The Event Logs tab gives you a listing of the Windows Event log entries for that device. This brings that data to this view and is very useful when determining the root cause of an issue that has been reported on the device. | Data from Experience metrics | ||||||||||||||||||||||||||||||||
Application Interactions | Shows user interaction times and ratios across applications measured over the last 30 days | |||||||||||||||||||||||||||||||||
User interactions | Shows user interactive sessions with activity over last 30 days. | |||||||||||||||||||||||||||||||||
Hardware | Disk drives | Shows disk drives, including hardware and usage information.
| ||||||||||||||||||||||||||||||||
Peripherals | Shows the list of plug and play hardware devices (Windows only).
| |||||||||||||||||||||||||||||||||
Network | Throughput | Shows network throughput on all adapters for the last hour, represented by the following tiles:
| ||||||||||||||||||||||||||||||||
Interface configuration | Returns the output from the native network interface configuration command (e.g. ipconfig or ifconfig). | |||||||||||||||||||||||||||||||||
DNS | Shows the Cache and Host file tiles:
| |||||||||||||||||||||||||||||||||
TCP connections | Returns a list of established TCP connections.
| |||||||||||||||||||||||||||||||||
Listening ports | Returns a list of processes which are listening for network connections.
| |||||||||||||||||||||||||||||||||
ARP Cache | Returns a list of processes which are listening for network connections and also shows routing tables. | |||||||||||||||||||||||||||||||||
WIFI | Shows a list of visible wifi networks, including basic network properties.
| |||||||||||||||||||||||||||||||||
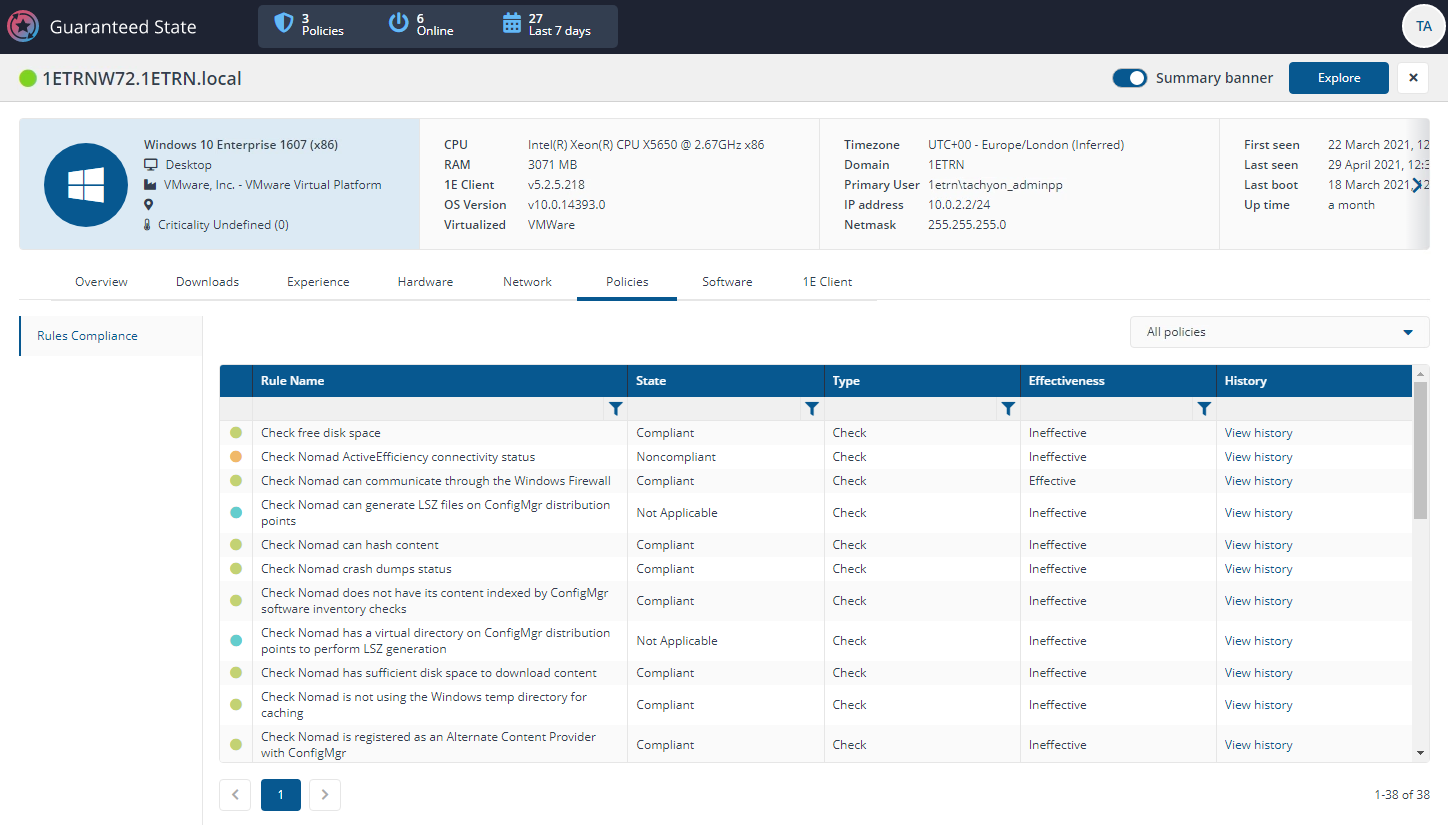
Policies | Rules Compliance |
| Data from Guaranteed State | |||||||||||||||||||||||||||||||
Software | Installations | Shows (per-device) installed software.
| ||||||||||||||||||||||||||||||||
Windows services | Shows list of installed Windows services and their current state.
| |||||||||||||||||||||||||||||||||
Env. Variables | Shows operating system environment variables. | |||||||||||||||||||||||||||||||||
Processes | Shows detailed information about all running processes.
| |||||||||||||||||||||||||||||||||
1E Client | Binaries | Shows a list of the binary files in the executable folder of the 1E Client.
| ||||||||||||||||||||||||||||||||
Configuration file | Shows the full content of the 1E Client configuration file, including:
| |||||||||||||||||||||||||||||||||
Extensibility | Shows extensibility objects (modules and providers) loaded by the 1E Client.
| |||||||||||||||||||||||||||||||||
Local Storage | Shows Data Files and Client Inventory Database Use tiles that display the list of:
|
Product Pack references
The Device View page requires the following feature-related Product Packs that contain instructions used by the page.
Product Pack name | Instruction name | Device View panel | Readable Payload |
|---|---|---|---|
1E-Experience | 1E-Experience-ApplicationInteraction | Experience\Application Interaction | User interaction across applications |
1E-Experience | 1E-Experience-LogonSessions | n/a | Current user logon sessions |
1E-Experience | 1E-Experience-UserInteractionHistory | Experience\User Interaction | Get user interaction history over last 30 days |
1E-Nomad | 1E-Nomad-NomadBranchSettings | Downloads\Nomad Configuration | Nomad Branch service settings |
1E-Tachyon-Platform | 1E-TachyonPlatform-Client-Binaries | 1E Client\Binaries | List deployed 1E Client binary files |
1E-Tachyon-Platform | 1E-TachyonPlatform-Client-ConfigFileContent | 1E Client\Configuration File | Show 1E Client configuration file content |
1E-Tachyon-Platform | 1E-TachyonPlatform-Client-DataFiles | 1E Client\Local Storage | List 1E Client data files |
1E-Tachyon-Platform | 1E-TachyonPlatform-Client-Extensibility | 1E Client\Extensibility | Show 1E Client extensibility (modules and providers) |
1E-Tachyon-Platform | 1E-TachyonPlatform-Client-InventoryDatabaseUse | 1E Client\Local Storage | List of inventory database tables |
1E-Tachyon-Platform | 1E-TachyonPlatform-Hardware-Devices | Hardware\Peripherals | List of hardware devices |
1E-Tachyon-Platform | 1E-TachyonPlatform-Hardware-DiskDrives | Hardware\Disk Drives | List disk drives |
1E-Tachyon-Platform | 1E-TachyonPlatform-Hardware-ResourceUsage | Overview\Resource Usage | Hardware resource usage over time |
1E-Tachyon-Platform | 1E-TachyonPlatform-Hardware-ResourceUsageByMinute | Overview\Resource Usage | Resource usage by executable for %minute% |
1E-Tachyon-Platform | 1E-TachyonPlatform-Network-ArpCache | Network\ARP and Routing | List entries in ARP cache |
1E-Tachyon-Platform | 1E-TachyonPlatform-Network-AverageThroughput | Network\Throughput | Network throughput for last 60 minutes |
1E-Tachyon-Platform | 1E-TachyonPlatform-Network-DnsCache | Network\DNS | DNS cache entries |
1E-Tachyon-Platform | 1E-TachyonPlatform-Network-HostFileContent | Network\DNS | Host file content (for DNS overrides) |
1E-Tachyon-Platform | 1E-TachyonPlatform-Network-InterfaceConfiguration | Network\Interface configuration | Network interface configuration |
1E-Tachyon-Platform | 1E-TachyonPlatform-Network-ListeningPorts | Network\Listening ports | Processes listening on TCP and UDP ports |
1E-Tachyon-Platform | 1E-TachyonPlatform-Network-RoutingTable | Network\ARP and Routing | Routing table information |
1E-Tachyon-Platform | 1E-TachyonPlatform-Network-TcpConnections | Network\TCP connections | Established TCP connections |
1E-Tachyon-Platform | 1E-TachyonPlatform-Network-WiFiNetworks | Network\WiFi | List visible WiFi networks |
1E-Tachyon-Platform | 1E-TachyonPlatform-Software-EnvironmentVariables | Software\Env. Vars | List environment variables |
1E-Tachyon-Platform | 1E-TachyonPlatform-Software-Installations | Software\Installations | List software installations |
1E-Tachyon-Platform | 1E-TachyonPlatform-Software-Processes | Software\Processes | List running process details |
1E-Tachyon-Platform | 1E-TachyonPlatform-Software-Services | Software\Windows Services | List Windows Services |