Nomad Sites page
The Nomad Sites page is primarily designed to show how the network is being used for content distribution in different locations. It focuses on the volume of content downloaded from peers vs over the WAN, rather than the status of specific Content titles in a given site. You can see what content is available by looking at the Content tab for that site.
Note
A Nomad Site corresponds to Nomad Single Site Download (SSD) site. Customers that have implemented SSD and upgraded ActiveEfficiency to the Nomad app and Content Distribution will see their defined SSD locations displayed as Nomad Sites in the app.
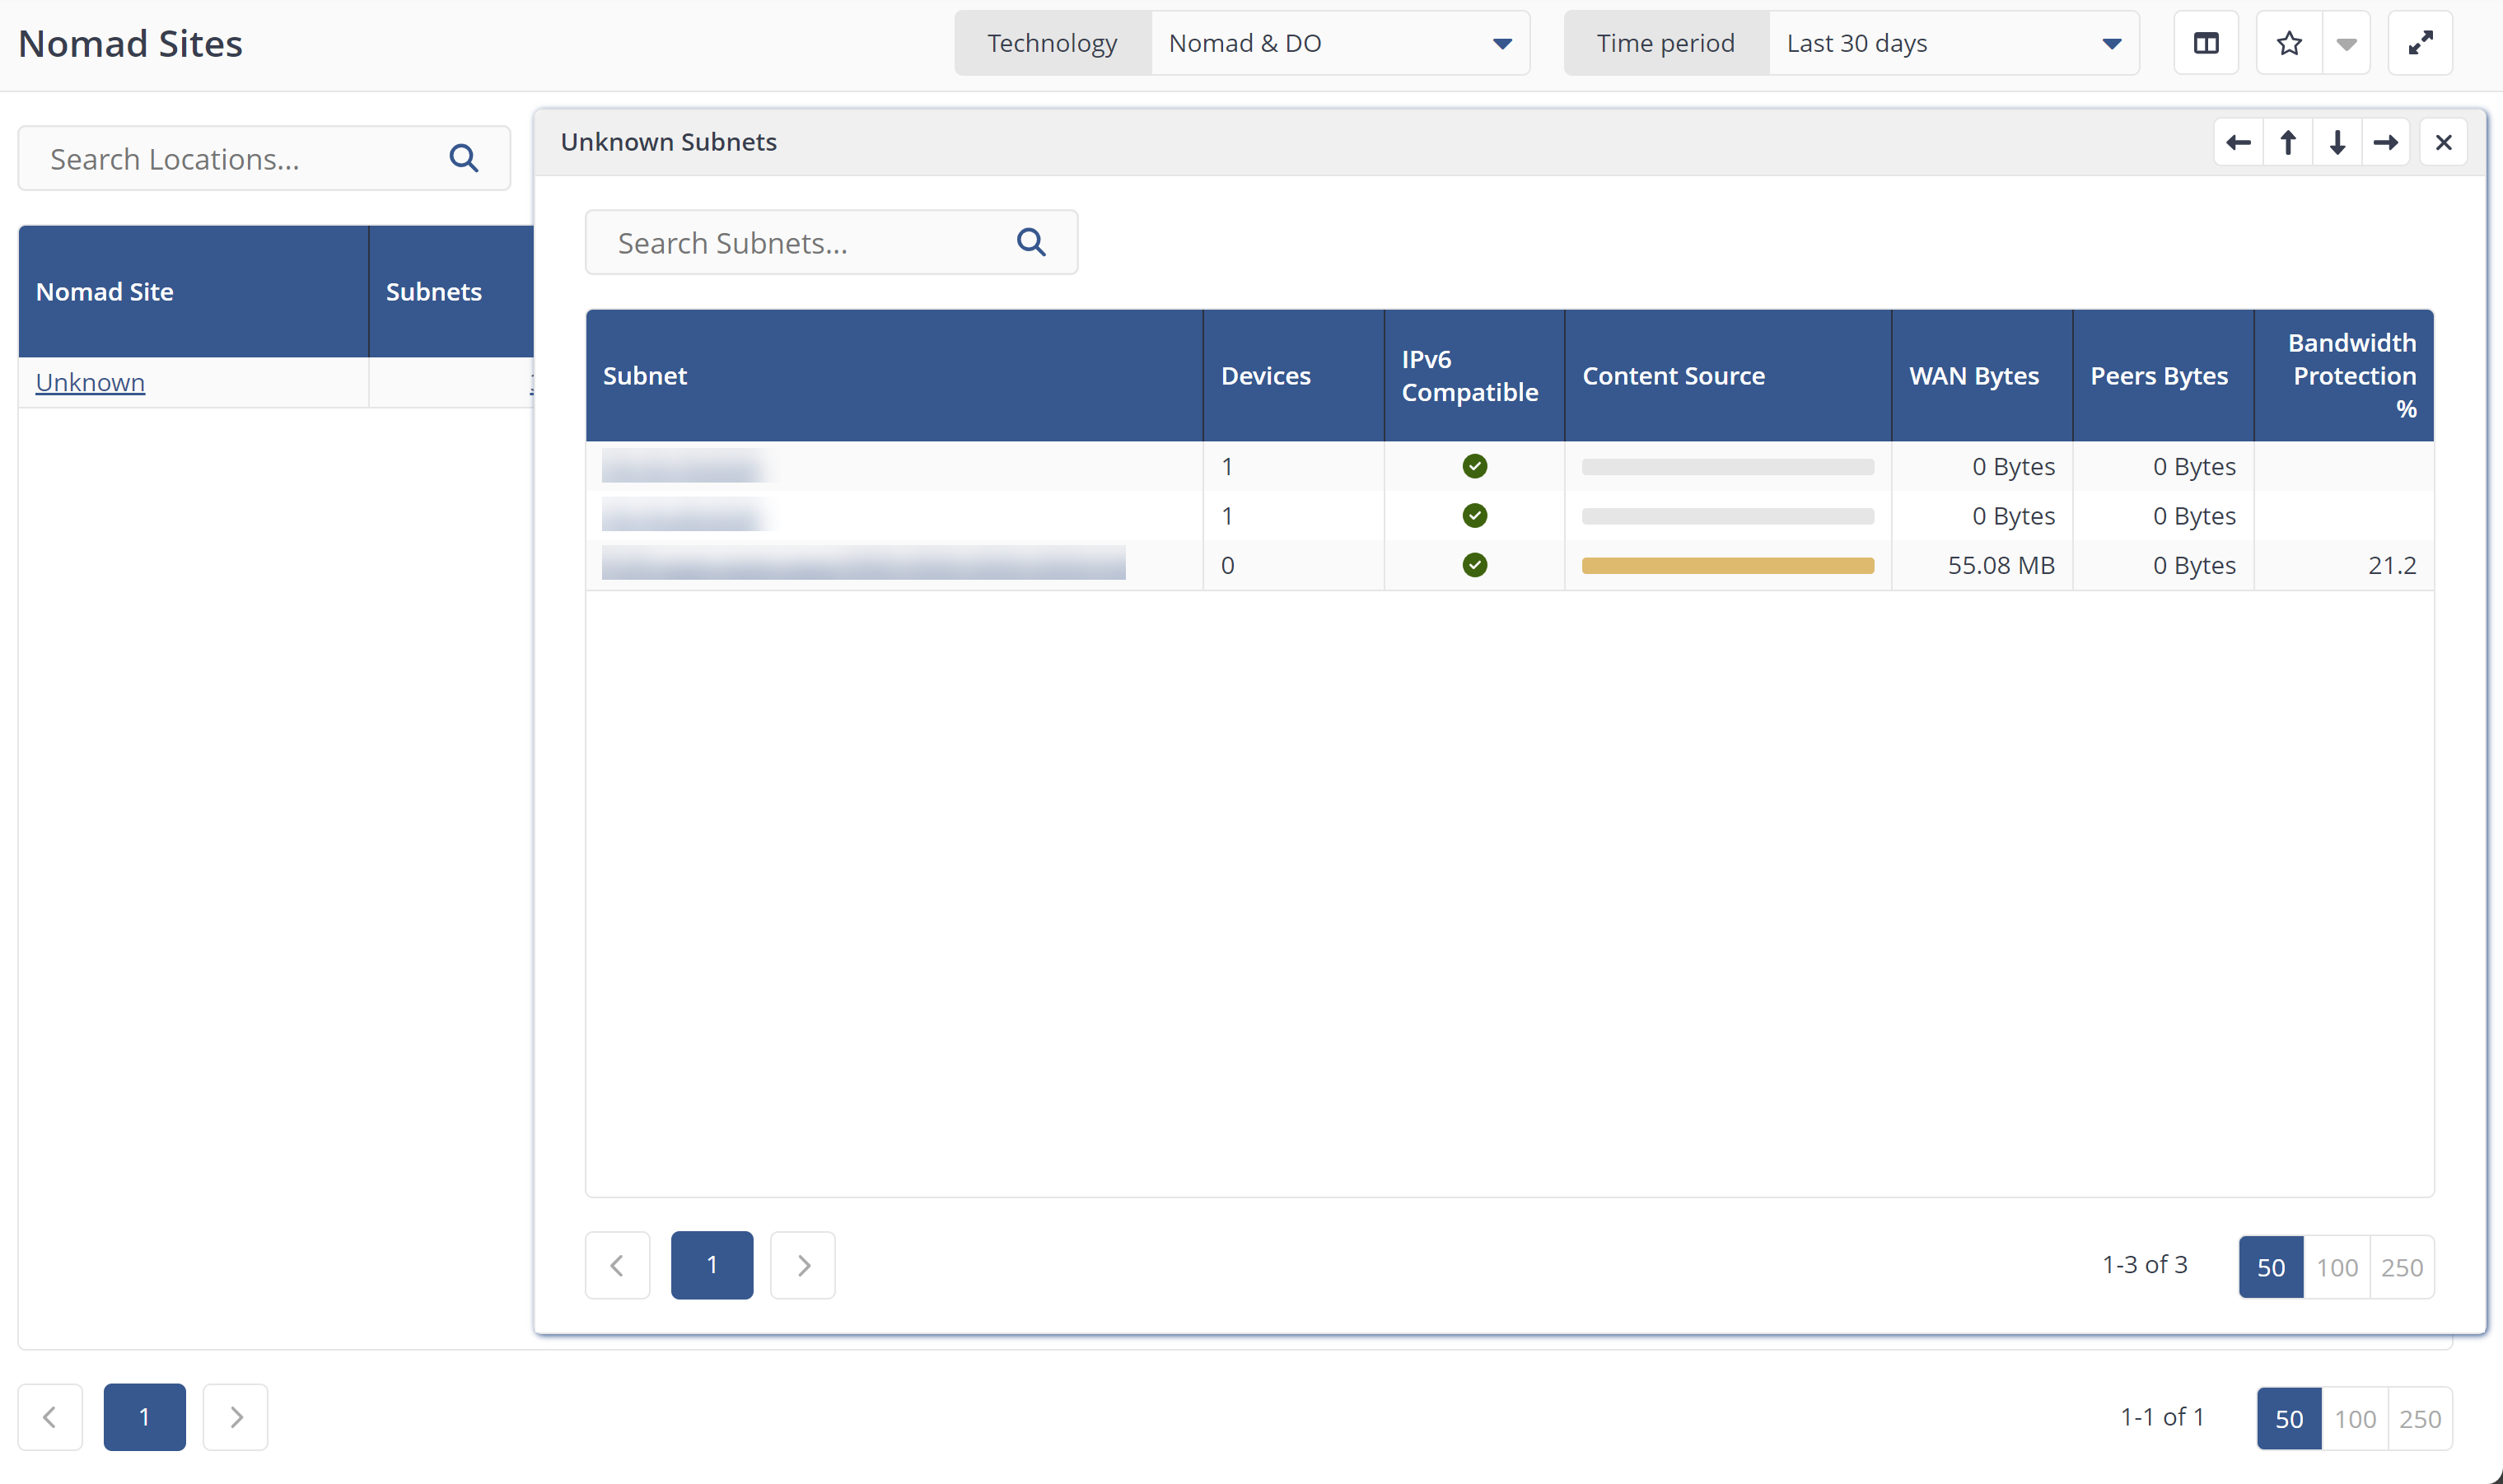
Any subnets that are not included in a Nomad SSD Site definition will be represented in a site named Unknown. If no SSD sites have been defined, all subnets will be included in the 'Unknown' site.
Navigation and filtering
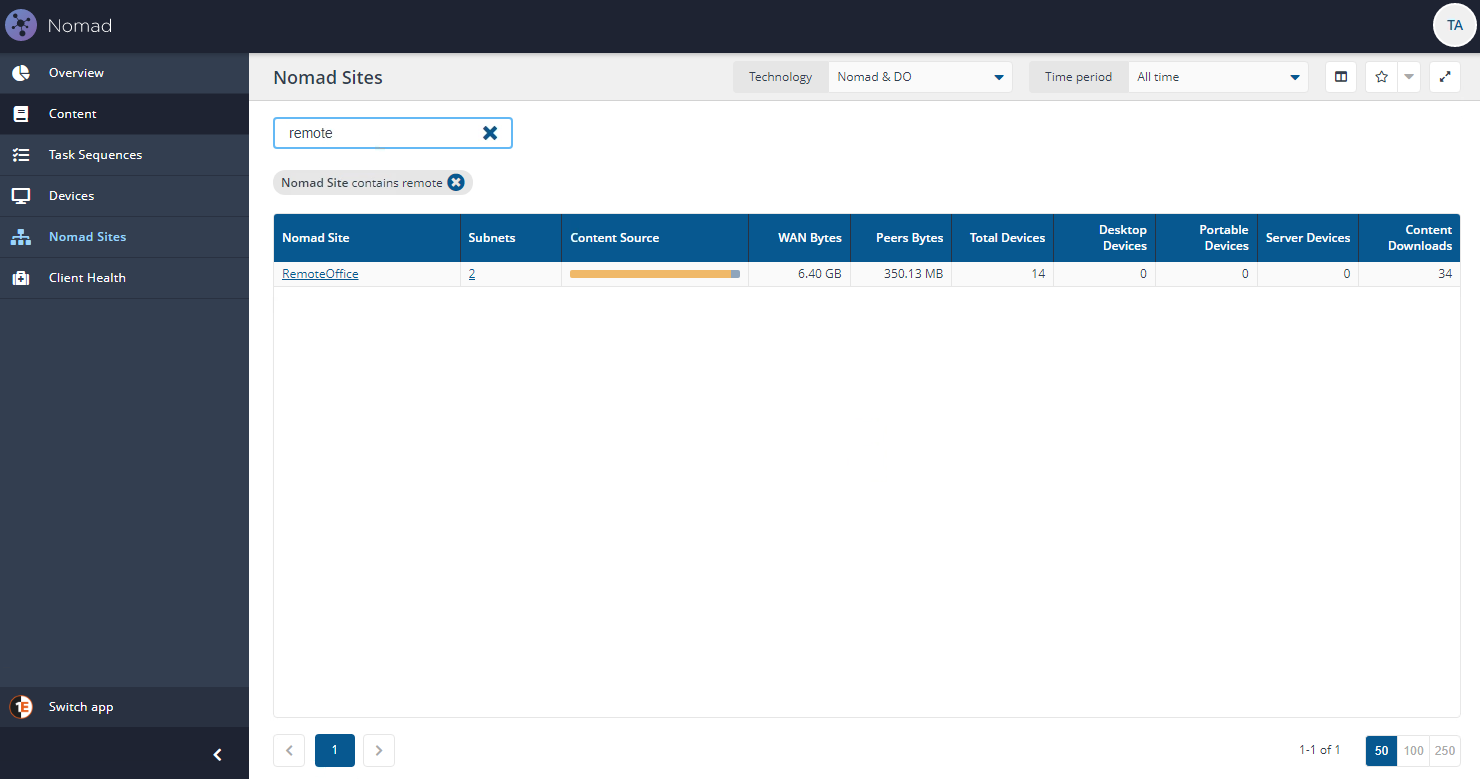
By default, the table lists Nomad Sites from which download activity has been reported within the selected Time period. These defaults can be modified using the Technology filter (to show Nomad or DO activity only) and the Time period filter.
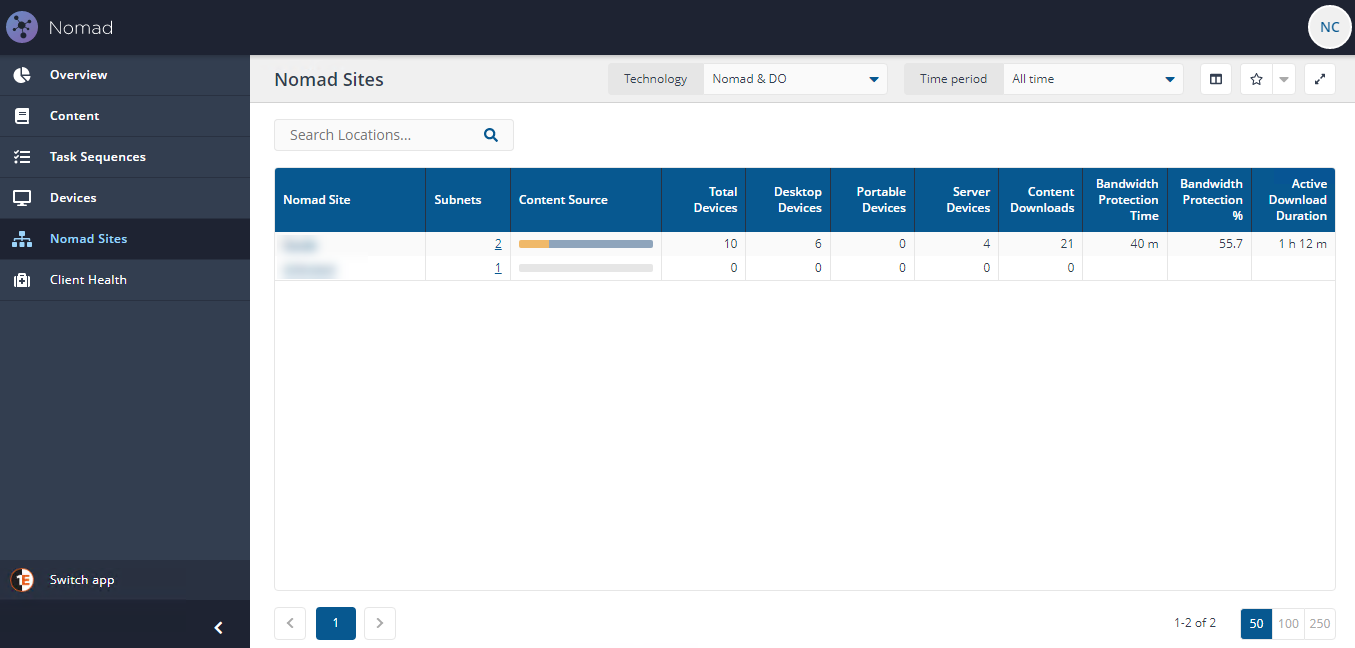
The Network Sites page has the following columns, displayed by default in the order shown in the table.
Column | Description |
|---|---|
Nomad Site | The name of the site as defined in the Content Distribution database. Nomad sites are typically defined using a script that imports site definition from another source, such as Active Directory Sites and Subnets, in which case the site name will be derived from that original source (e.g. AD Site Name). |
Subnets | The count of subnets included in the Nomad site. Clicking on the number opens a 'drawer' that shows the peer-to-peer efficiency for each subnet in the site. Clicking on the subnet in this drawer shows the devices in that subnet reporting download activity within the selected Time period. |
Content Source | A bar representing the volume of content downloaded in that site from peers (gray) and from the WAN (orange) within the selected Time period. |
Bandwidth Protection Time | Duration the client backed off from downloading to save download bandwidth. |
Bandwidth Protection % | Bandwidth Protection shown as a percentage of downloads. This is the result of the Bandwidth Protection Time column dived by the Active Download Duration and multiplied by 100. |
Active Download Duration | Duration for which client actively downloaded the content, this excludes any kind of interruption while downloading, for example network issues. |
Total Devices | Representing the number of devices in the site that have reported download activity within the selected Time period. |
Desktop Devices | A subset of Total Devices that are desktop devices (based on chassis type) and therefore most likely 'fixed' to the site. |
Portable Devices | A subset of Total Devices that are portable devices (based on chassis type) and therefore may move from site to site. |
Server Devices | A subset of Total Devices that are running a Server Operating System and therefore most likely 'fixed' to the site. |
Content Downloads | Representing the total number of downloads at the site for which activity has been reported within the selected Time period. |
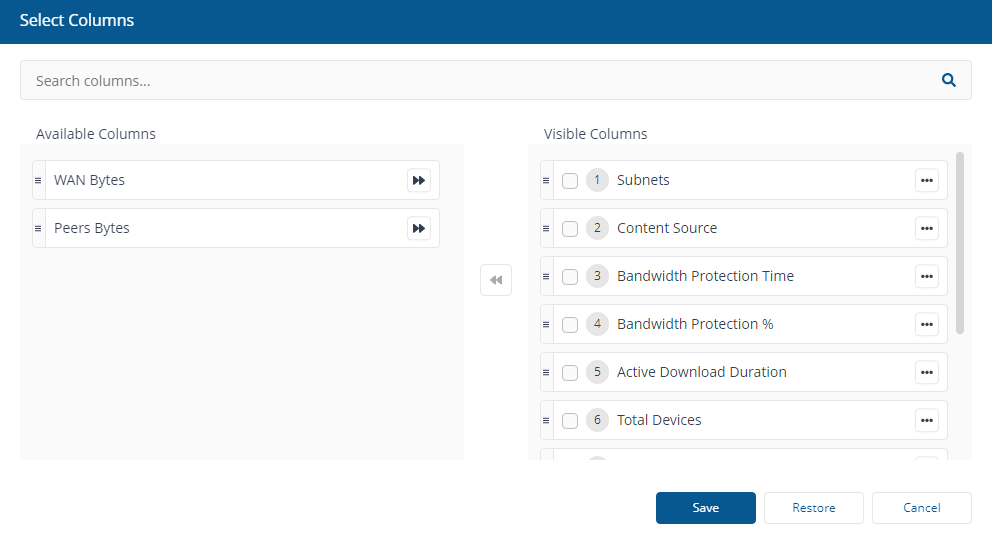
WAN Bytes | Representing the total volume of content that has been downloaded by devices in that site from the WAN. The number is represented in units of Bytes, KB, MB or GB as appropriate to fit in the column. NoteThis metric is not visible by default, you can select it using Select Columns. |
Peers Bytes | Representing the total volume of content that has been downloaded by devices in that site from peers. The number is represented in units of Bytes, KB, MB or GB as appropriate to fit in the column. NoteThis metric is not visible by default, you can select it using Select Columns. |
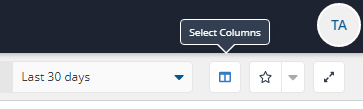
Select Columns
On the pages where you can pick the displayed columns, you'll see the following Select Columns control.
When you click on the Select columnscontrol it opens a popup displaying the columns shown on the current screen and any additional columns you can select, the controls are:
Control | Explanation |
|---|---|
Available Columns | Columns, which are by default hidden from display on screen. You can still include any of them to display on screen. |
Visible Columns | Displays the list of columns displayed on screen. Mandatory Columns cannot be excluded, the selection controls for these items are disabled. They can still be moved up or down. |
Arrow buttons | To move up or move down, exclude or include any column, clicking on the ellipsis displays these additional controls. |
Drag and drop | You can drag and drop columns to change how they are displayed. |
Exclude columns | Exclude column button allows you to select columns to exclude from the current display. |
Set page configuration as preset
If you have amended the displayed columns using the Choose columns control, you can then save the view as a preset which will be available later.
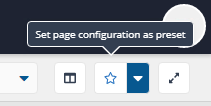
Clicking Set page configuration as preset displays the Presets popup. Here, you can give the view a name, in the shown example this is called All columns displayed as we have chosen to display every available column.
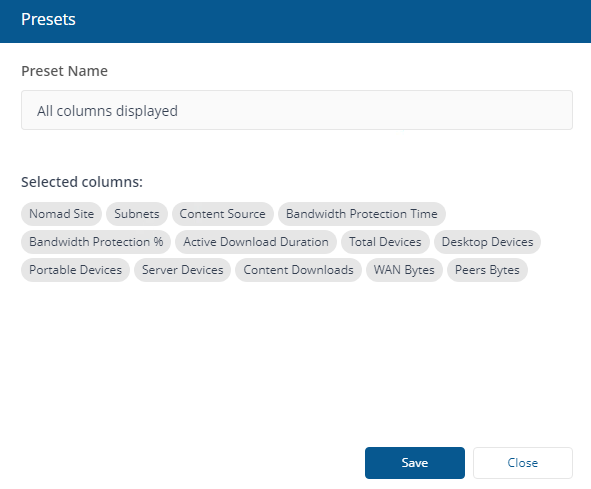
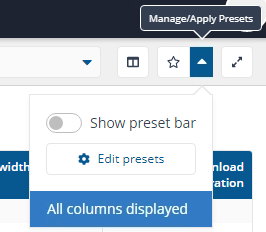
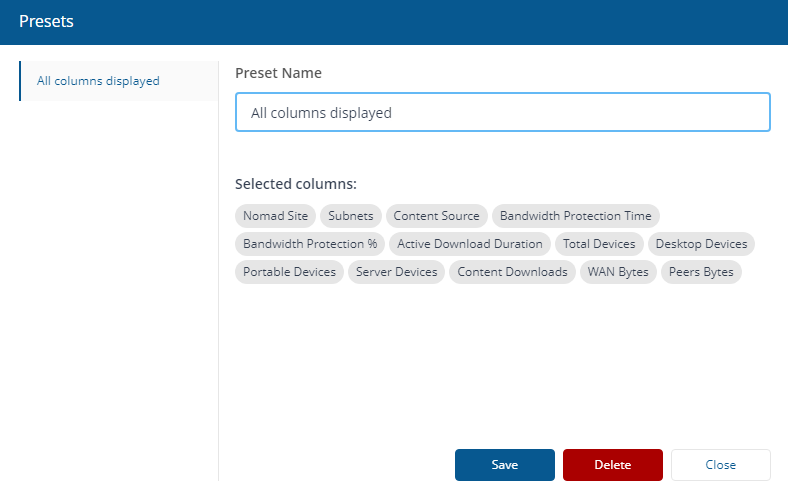
Once saved, you can select your saved views using the Manage/Apply Presets control or edit them by clicking Edit presets.
Technology filter
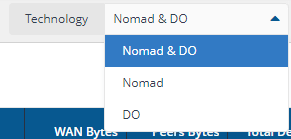
You can use the technology filter to differentiate between downloads through Nomad or Delivery Optimization (DO).
The following options are available:
Nomad & DO (Default)
Nomad
DO.
Note
If this filter is applied to any page, it is reflected on all other pages in the Nomad App.
Time period filter
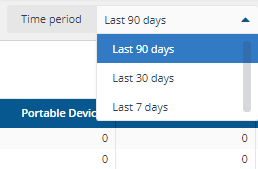
Using the Time periodfilter at the top of the page, you can narrow down the results by date. You can choose from the following options:
Last 90 days
Last 30 days (Default)
Last 7 days.
Note
If these filters are applied to any app page, it is reflected on all other pages in the Nomad App.
Search...
Use the search box at the top left of the page to filter by specific criteria, for example in the picture opposite the default view has been filtered by Network Sites containing remote in their title.
Note
Navigating away from this view resets the table to its default view.
Subnets drawer
A drawer that opens up when you click on Subnets, Content Source, WAN Bytes etc. except Network Location. It shows a list of all Subnets falling under that location, with the following purpose:
Column | Description |
|---|---|
Subnet | Subnet address (Clicking on this column takes you to the Network Location details page with selection based on this subnet). |
Devices | Count of devices under this subnet. |
Content Source | Percentage of downloads by WAN or Peers and content size. Hovering your mouse over the Content Source bar shows the percentage and download size per Content Type. |
WAN Bytes | Representing the total volume of content that has been downloaded by devices in that site from the WAN. The number is represented in units of Bytes, KB, MB or GB as appropriate to fit in the column. |
Peers Bytes | Representing the total volume of content that has been downloaded by devices in that site from the Peers. The number is represented in units of Bytes, KB, MB or GB as appropriate to fit in the column. |
Bandwidth Protection % | Bandwidth Protection shown as a percentage of downloads. This is the result of the Bandwidth Protection Time column dived by the Active Download Duration andmultiplied by 100. |
Nomad Site details
Clicking a Nomad Site takes you to the Nomad Site details page and shows information for a specific site. It includes two tabs:
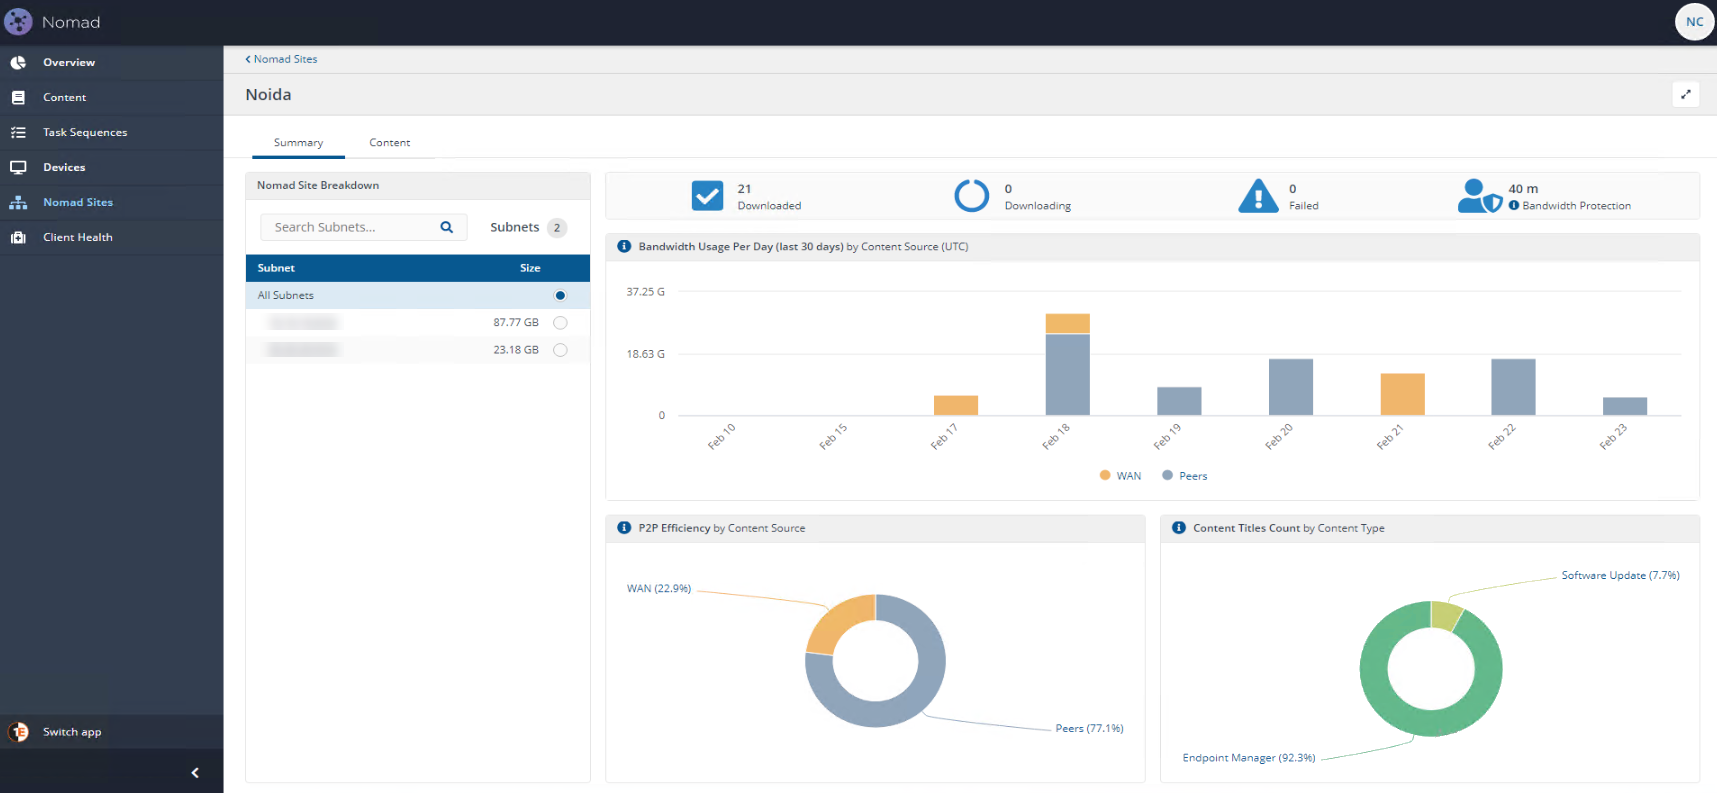
Summary tab
The Summary tab shows summary information about the site.
Top Status Bar
The top status bar shows high-level statistics similar to the one on the Overview page:
Status | Description |
|---|---|
Total | Number of downloads on devices that are currently in the site. |
Downloading | Number of downloads currently in progress in the site. |
Downloaded | Number of downloads on devices that are currently in the site that have successfully completed. |
Cancelled | Number of downloads on devices that are currently in the site, whose latest status was Cancelled. |
Bandwidth Protection | Bandwidth Protection allows Nomad to adjust the speed of ongoing downloads to save bandwidth for other business use. Bandwidth Protection ensures Nomad doesn't consume excess bandwidth and hinder other business activity. NoteWhen viewing individual Nomad sites, all data is displayed on the details page, irrespective of any time duration filter you have set on the Nomad Sites page. As a result, if you have set the Time period filter on the Nomad Sites page to, for example, Last 7 days, you may see a different result for all data except Bandwidth Usage Per Day (Last 30 days) by Content Source (UTC), which displays data only for the previous 30 days. |
Clicking on any of the icons will take you to the Content tab filtered according to the clicked status icon.

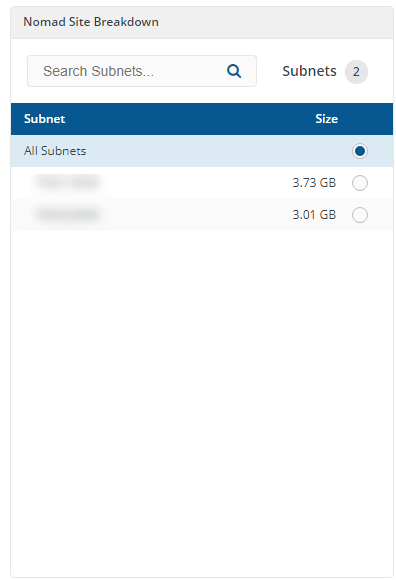
Subnet Side Panel
The Subnet list in the left panel shows every subnet in the selected site. By default, the page shows aggregated data for the entire site. You can filter page to examine a specific subnet within the site.
Panel item | Description |
|---|---|
Search Subnets... | In large sites you can search for a subnet using the search box. |
Subnets | The total number of subnets in the site is shown in the Subnets 'badge'. in our example the total number is 3. |
Subnet | A list of subnet detected for that Network Site. |
Size | The Size column in this list indicates the total volume of content downloaded in that subnet. |
Bandwidth Usage Per Day (Last 30 days) by Content Source (UTC)
The Bandwidth Usage Per Day (Last 30 days) by Content Source (UTC) tile represents daily download activity in this site over the last 30 days.
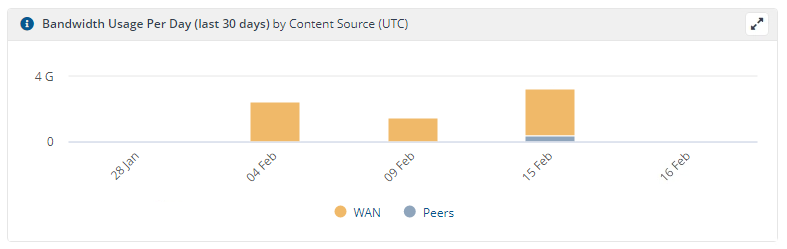
A column is displayed for each day where download activity was reported from devices that were in the site on that day. If a device moves into another site, this chart will still show content that it downloaded while it was in this site.
Each column indicates the volume of content that was downloaded over the WAN (in orange) or from Peers (in grey). Hovering over a segment of the column displays the volume of content downloaded on that day.
This view demonstrates the value that Nomad and Delivery Optimization provide through reduced WAN traffic. If the majority of content is being downloaded over the WAN, it could indicate that peers are simply not available (e.g. users working from home) or it could be an indication that Nomad or Delivery Optimization are not correctly configured to optimize content from peers.
Note
The columns on this chart are not clickable - they are for data visualization only and do not navigate to another view of the data.
P2P Efficiency by Content Source
The P2P Efficiency by Content Source tile represents the overall peer-to-peer efficiency across the site.
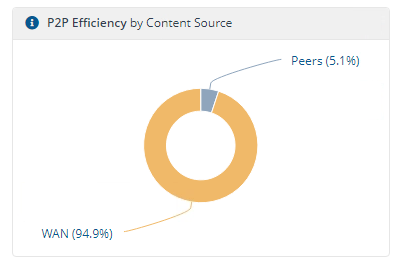
The data is grouped by source (Peers and WAN) and displayed as a donut chart showing the volume of content downloaded from Peers (in grey) and from the source over the WAN (in orange).
This gives an indication of the overall value of Nomad and Delivery Optimization within the site. Ideally, more content will be downloaded from peers than from the source over the WAN, thereby saving network bandwidth.
Where this is not the case, it could be due to many users working remotely without any local peers, or it could be due to configuration settings on the client that are not optimized for peer-to-peer caching and availability.
Note
Clicking on the chart navigates to the Content tab filtered by either Peers or WAN, for that subnet.
Content Titles Count by Content Type
The Content Title Count by Content Type tile shows the total number of unique Content Titles where there is download activity reported for the latest version of the content within the site. The data is grouped by Content Type.

The app reports on two Content Types:
Endpoint Manager - in this release this includes CM Applications and Packages.
Software Updates - includes any Microsoft Software Updates deployed through CM or Windows Update.
In a future release these will be expanded to include other content types such as Endpoint Manager Intune applications, Microsoft Store apps.
Hovering over a Content Type segment of the chart displays the count of Content Titles of that type, also represented as a percentage of all Content Titles.
Note
Clicking on a Content Type segment of the chart will navigate to the Content tab, filtered to show Content Titles of the selected segment.
Content tab
A table showing all content downloaded in a Network Location and optionally filtered on the Subnet selected from the Summary tab.
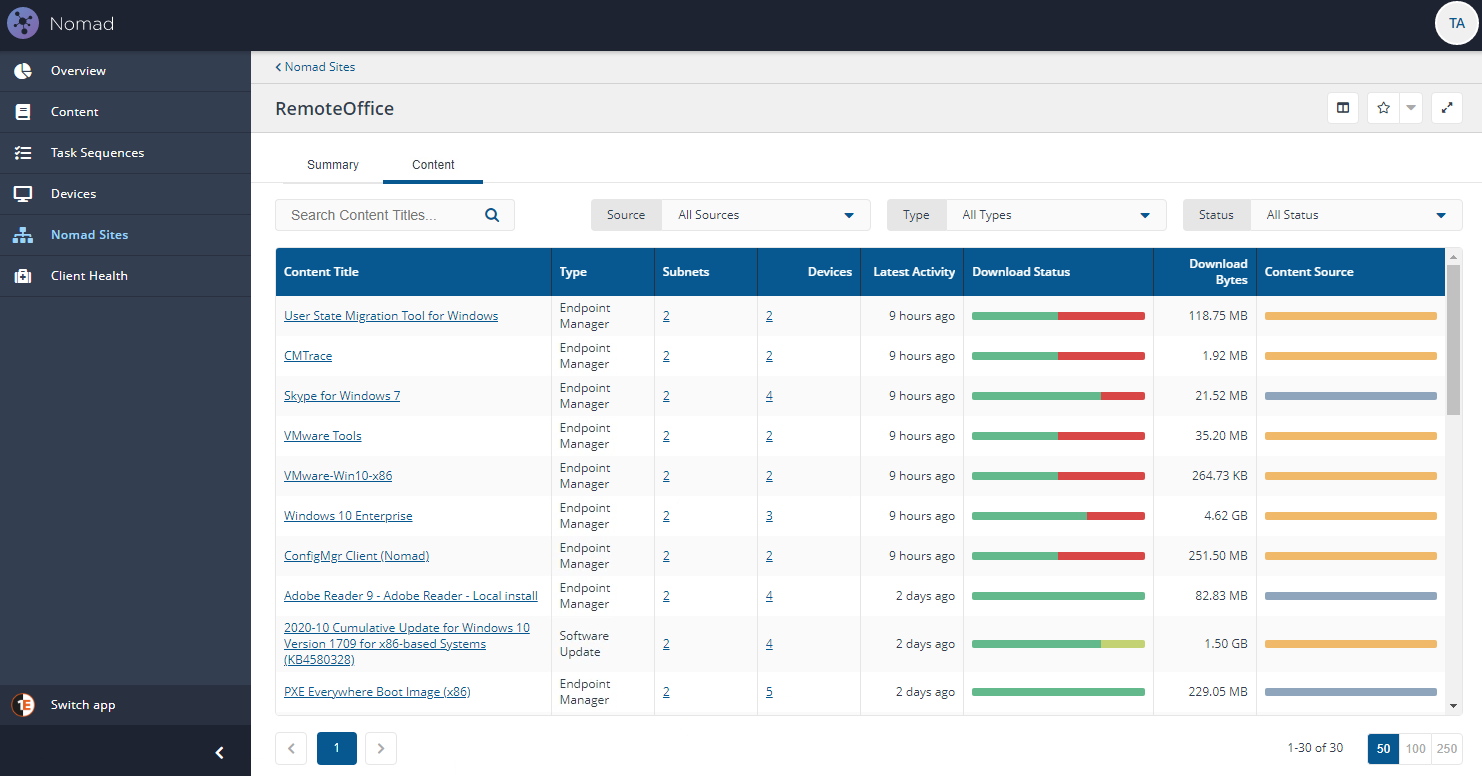
Columns | Description |
|---|---|
Content Title | Name of the content (Clicking on this column takes you to the details of the content). |
Type | Type of content. |
Subnets | Count of subnets this content is downloaded to (Clicking on this column opens a drawer that expands on the list of subnets). |
Devices | Count of devices this content is downloaded to (Clicking on this column opens a drawer that expands on the list of devices). |
Latest Activity | Time when most recent activity happened. |
Download Status | Flexible chart showing distribution of download statuses. |
Download Bytes | Representing the total size of downloads for this content for this Location and Subnet. The number is represented in units of Bytes, KB, MB or GB as appropriate to fit in the column. |
Content Source | Same chart as on Main page but for this Content only. |
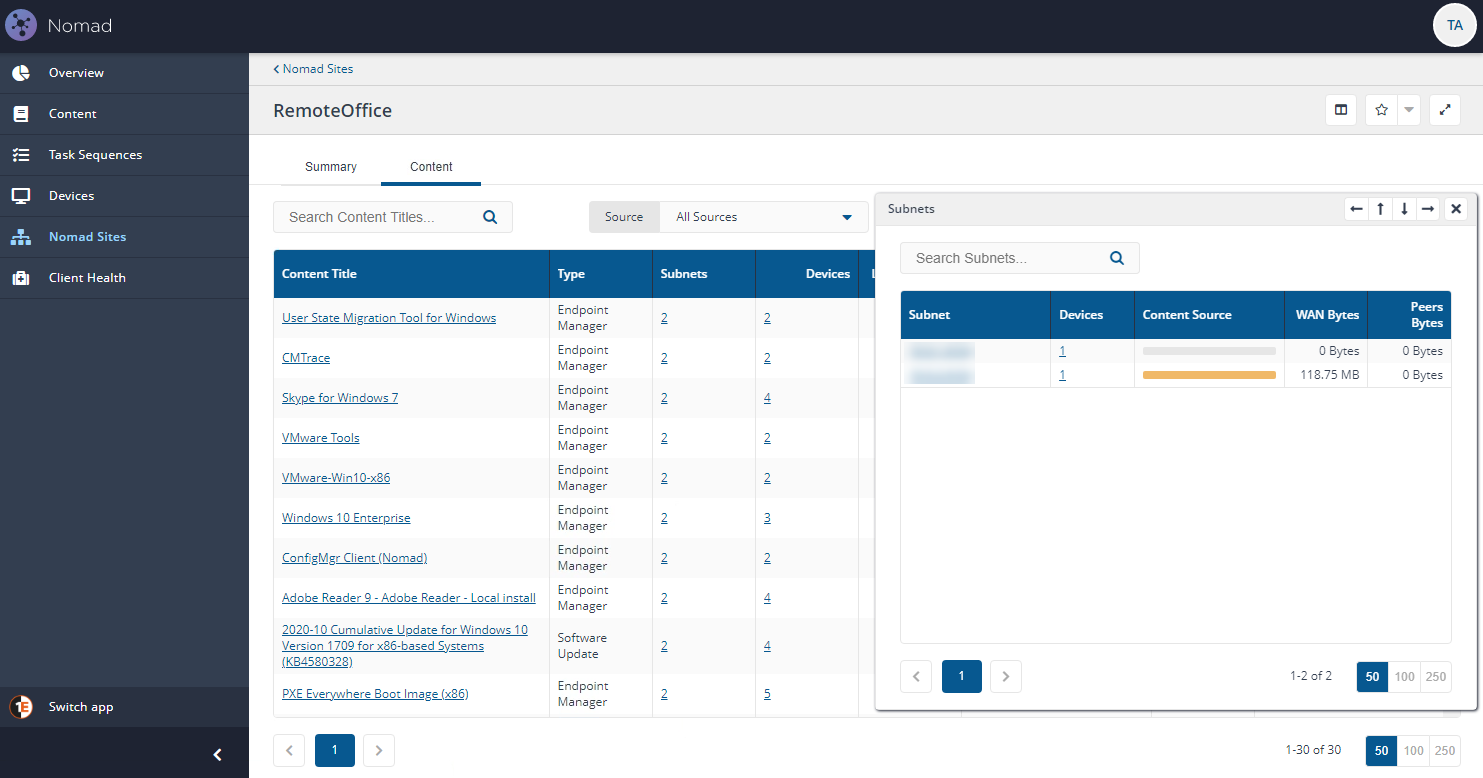
Subnet draw
A drawer that opens up when you click on the subnets count. It shows a list of all subnets falling under that location and have downloaded the specified content, with the following functionality:
Columns | Description |
|---|---|
Subnet | Takes you to Devices drawer with filter on this subnet. |
Devices | Number of devices in this subnet, clicking it will take you to Devices drawer with filter on this subnet. |
Content Source | A flex bar chart showing distribution across WAN and Peers. |
WAN Bytes | Representing the total size of downloads for this content for this Location and Subnet. The number is represented in units of Bytes, KB, MB or GB as appropriate to fit in the column. |
Peers Bytes | Representing the total size of downloads for this content for this Location and Subnet. The number is represented in units of Bytes, KB, MB or GB as appropriate to fit in the column. |
Devices drawer
A drawer that opens up when you click on the device count. It shows a list of all devices falling under that location and have downloaded the specified content.
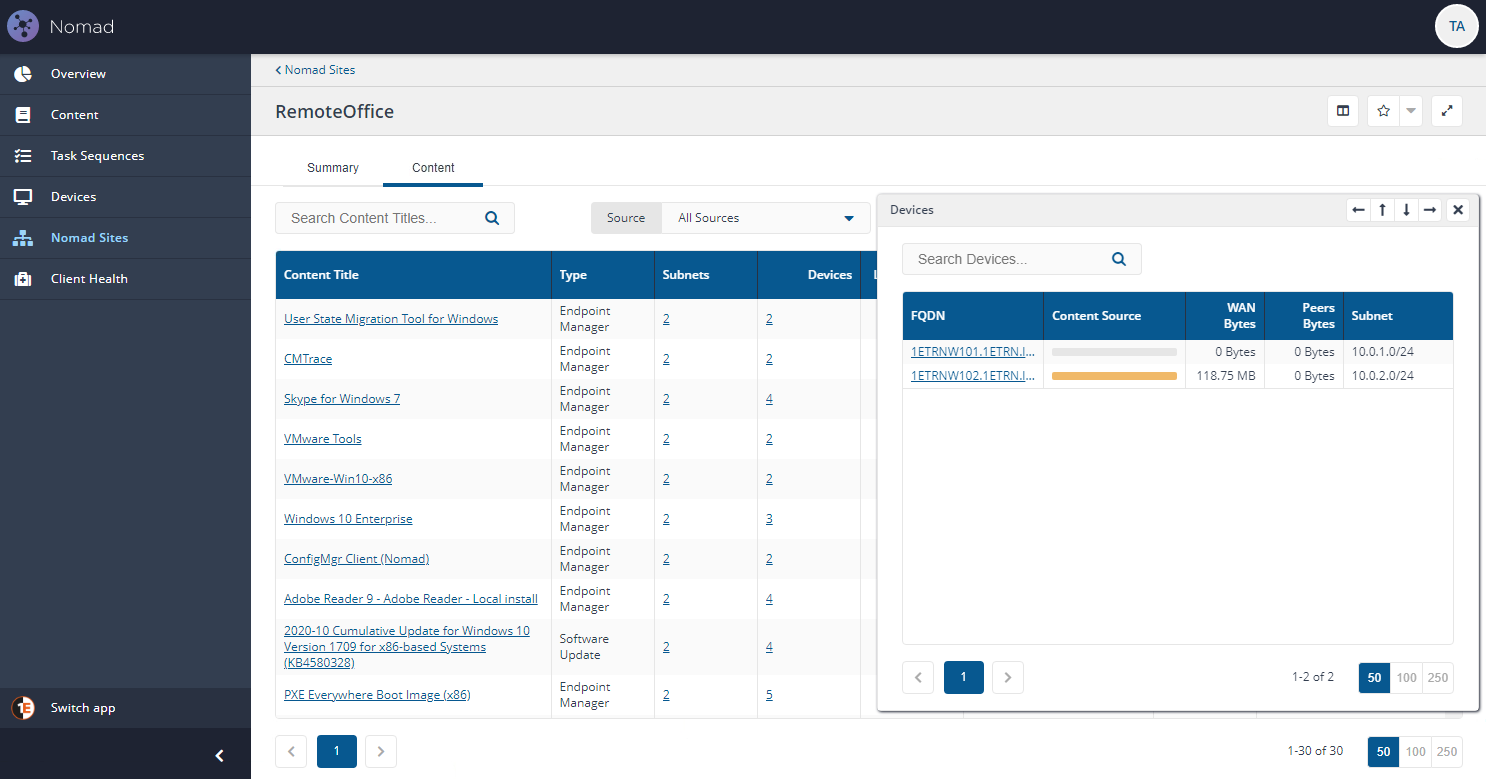
Columns | Description |
|---|---|
FQDN | FQDN of the device (Clicking on it will take you to the device details). |
Content Source | A flex bar chart showing distribution across WAN and Peers. |
WAN Bytes | Representing the total size of downloads for this content for this Location and Subnet. The number is represented in units of Bytes, KB, MB or GB as appropriate to fit in the column. |
Peers Bytes | Representing the total size of downloads for this content for this Location and Subnet. The number is represented in units of Bytes, KB, MB or GB as appropriate to fit in the column. |