Filters
Information about how to use the Filters bar that appears at the top of Experience pages.
Experience Filters
The Filters bar appears at the top of most of the pages in Experience. Each section in the Filters bar allows a user to quickly and easily filter based on different categories. When a filter is set it applies to all the tiles on the page.
On the Stability, Responsiveness, Performance and Sentiment pages there is also a Break Down By selector that reconfigures the charts to show the data divided up into the selected category.
On the Overview, Categories, Devices, and Software pages there is no option for Break Down By.
On the Users and Surveys pages the Filters bar is not available.
The Filters bar
The following sections are displayed on the Filters bar:
Section | Description |
|---|---|
Applicable Devices | This section shows the total number of devices that have been selected for the current view and the percentage of the environment those devices comprise. If no filtering is selected, the applicable devices will be 100% of the environment and will display the total number. |
Operating System | This section will allow you to create a filter based on the Operating System. The bars represent the different operating systems that make up the environment. |
Device Model | This section will allow you to create a filter based on the Model. The bars represent all the models that are in the environment. |
Criticality | This section will allow you to create a filter based on the Criticality setting of the devices. Criticality is set using a Tachyon instruction. The details on setting Criticality can be found here Using Device Criticality. |
Location | This section will allow you to create a filter based on the Location setting of the devices. Location is set using a Tachyon instruction. The details on setting Location can be found here Using Location. |
Management Group | This section will allow you to create a filter based on the Management Group membership(s) of the devices. Each bar represents a Management Group in Tachyon. The details on Management Groups can be found here Management Groups page page. |
Collapse/Expand | The Up or Down Arrow on the far right of the Filters and Breakdown bar allows you to collapse or expand the bar. Collapsing removes the details from view and leaves only the title of the bar. This allows you to focus on the details of the data when you have the filter of your choice created. |
Using the Filters Bar
The Filters bar can be used to immediately apply filters and, on some pages, to also apply a break down to the data that is displayed.
Using the Break Down By selector
We'll first take a look at the Break Down By selector, which is available on the Stability, Responsiveness, Performance and Sentiment pages.
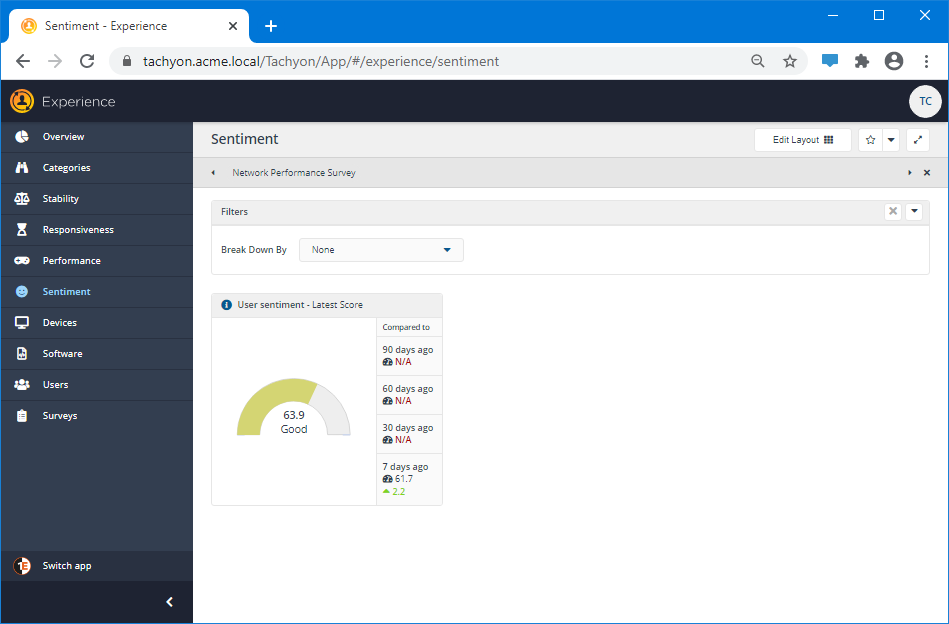
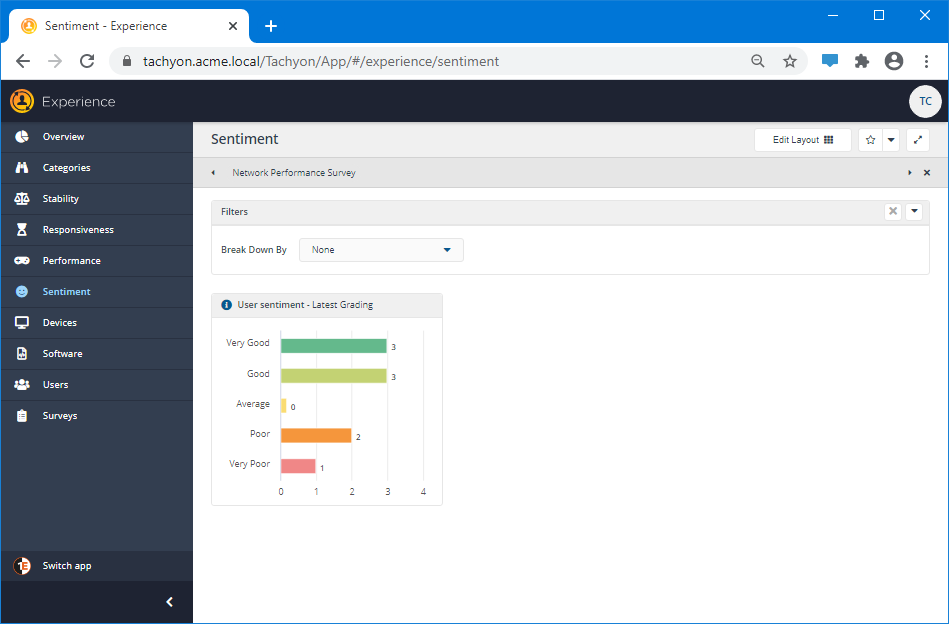
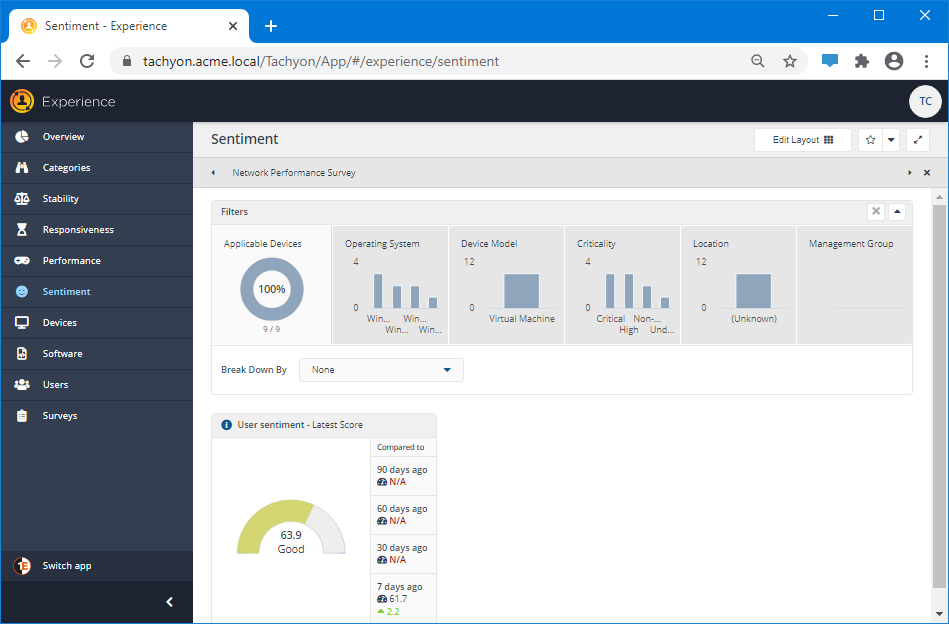
The picture opposite shows the Sentiment page with the Break Down By selector visible.
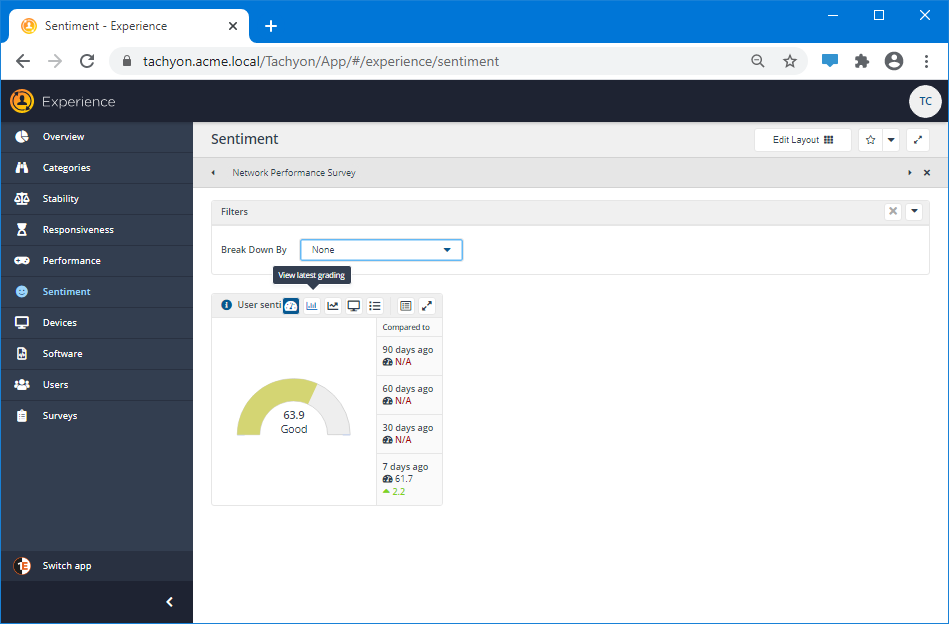
To show the effects of the Break Down By selector we are going to change the chart to View latest grading, which is done from the title bar of the chart - as shown in the picture opposite.
The picture opposite shows the User sentiment - Latest Grading chart before the Break Down By has been applied.
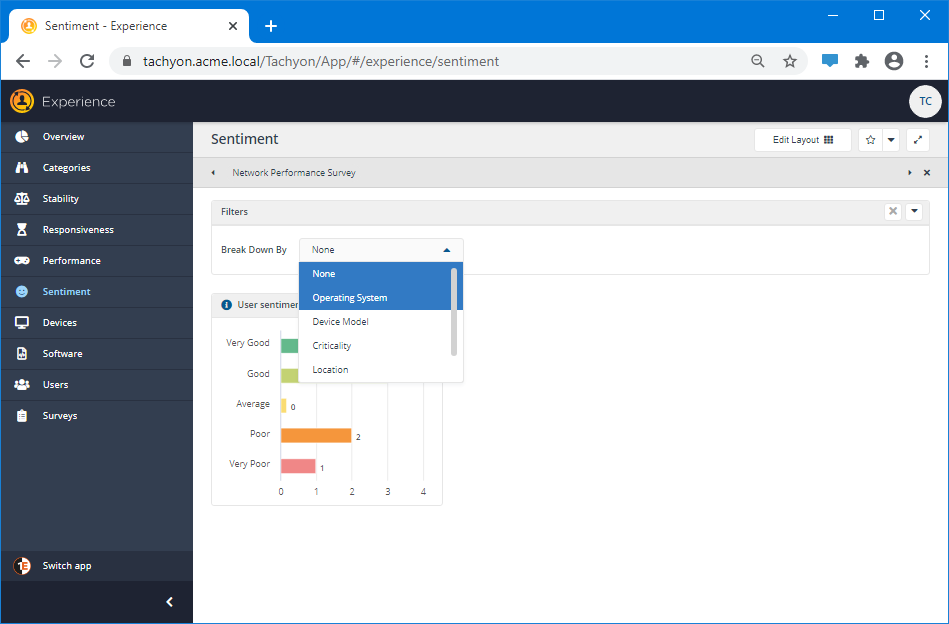
The Break Down By selector lets you choose from:
Operating System
Device Model
Criticality
Location
Management Group
In our example we're going to use the Operating System break down.
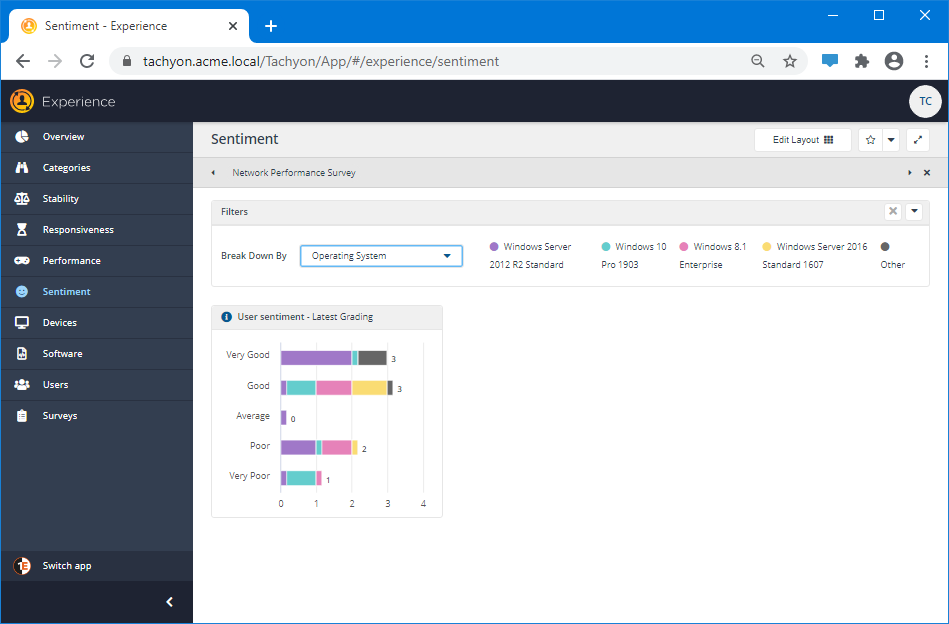
The picture opposite shows how the individual categories for the User sentiment break down according to the Operating System. The color for each different detected type of OS is displayed in the Filters bar and can be used as a key for the information displayed in the chart.
So here you can see that the Good grading is broken down into Windows 10, Windows 8.1 and Windows Server 2016 Operating Systems.
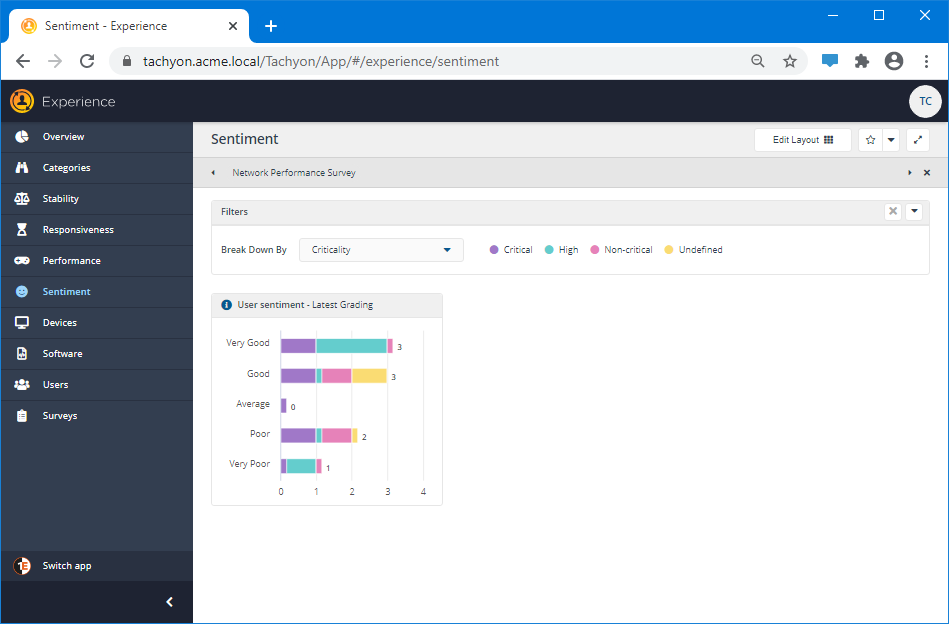
It's easy to change the parameter you break down by to see different aspects of the grading. Here the picture opposite shows the User sentiment chart broken down by the Criticality set for the devices. Here you can see the Very Good grading consists of Critical and High devices.
Applying filters with the Filters bar
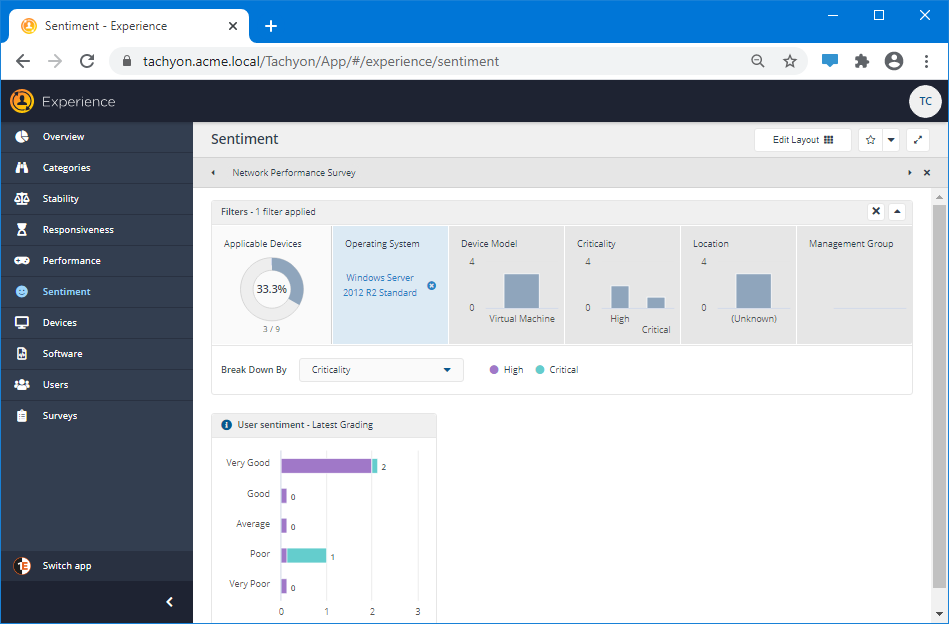
It is possible to create filters for multiple categories using the Filters bar. The filters are applied as you make selections and additional sections can be selected in order to further refine your dataset. You can also combine filters with the break down, on pages where that option is available. The picture opposite shows the Sentiment page with the Filters bar displayed.
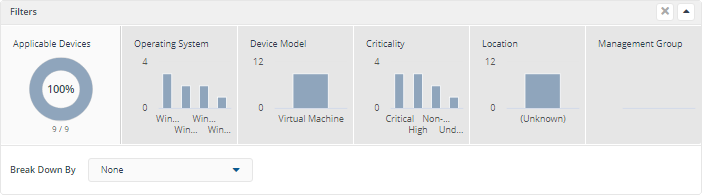
Each section in the bar provides a different way of instantly filtering the data that is displayed on the page and shows the different values available to choose from within that heading. The Operating System section, for example, shows a bar chart with all the different Operating Systems represented in the data being displayed. In the picture opposite this shows four values.
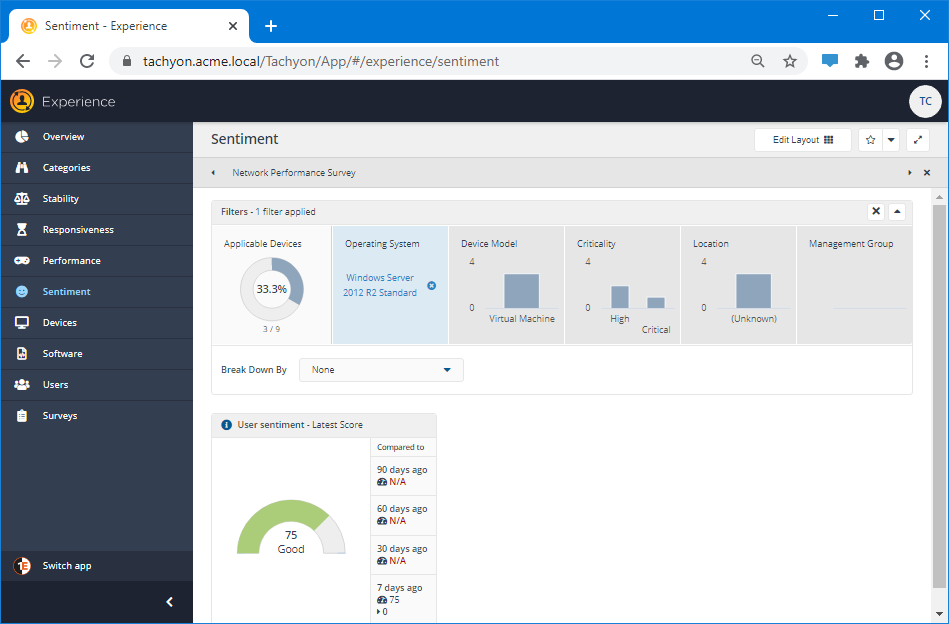
You can see what each of the columns in the bar chart represent by hovering over it with the mouse. In the picture opposite you can see that the first column is for the Windows Server 2012 R2 Standard OS and there are 3 instances of that type in the data.

Clicking on a bar filters the data to just show those devices that have that value. For example, the picture opposite shows the result of filtering on the Windows 2012 R2 Standard OS. The Applicable Devices section of the bar changes to show how much of the overall data is being displayed as a result of filtering, here you can see that the selected OS forms 33.3% of the overall data. The User sentiment - Latest Score chart changes to show the score for just those devices.
You can combine the filter with a break down using the Break Down By selector. The picture opposite shows the Criticality break down for Windows Server 2012 R2 Standard OS across the 5 grades.