Summary Report page
A description of the fields on the Summary Report page.
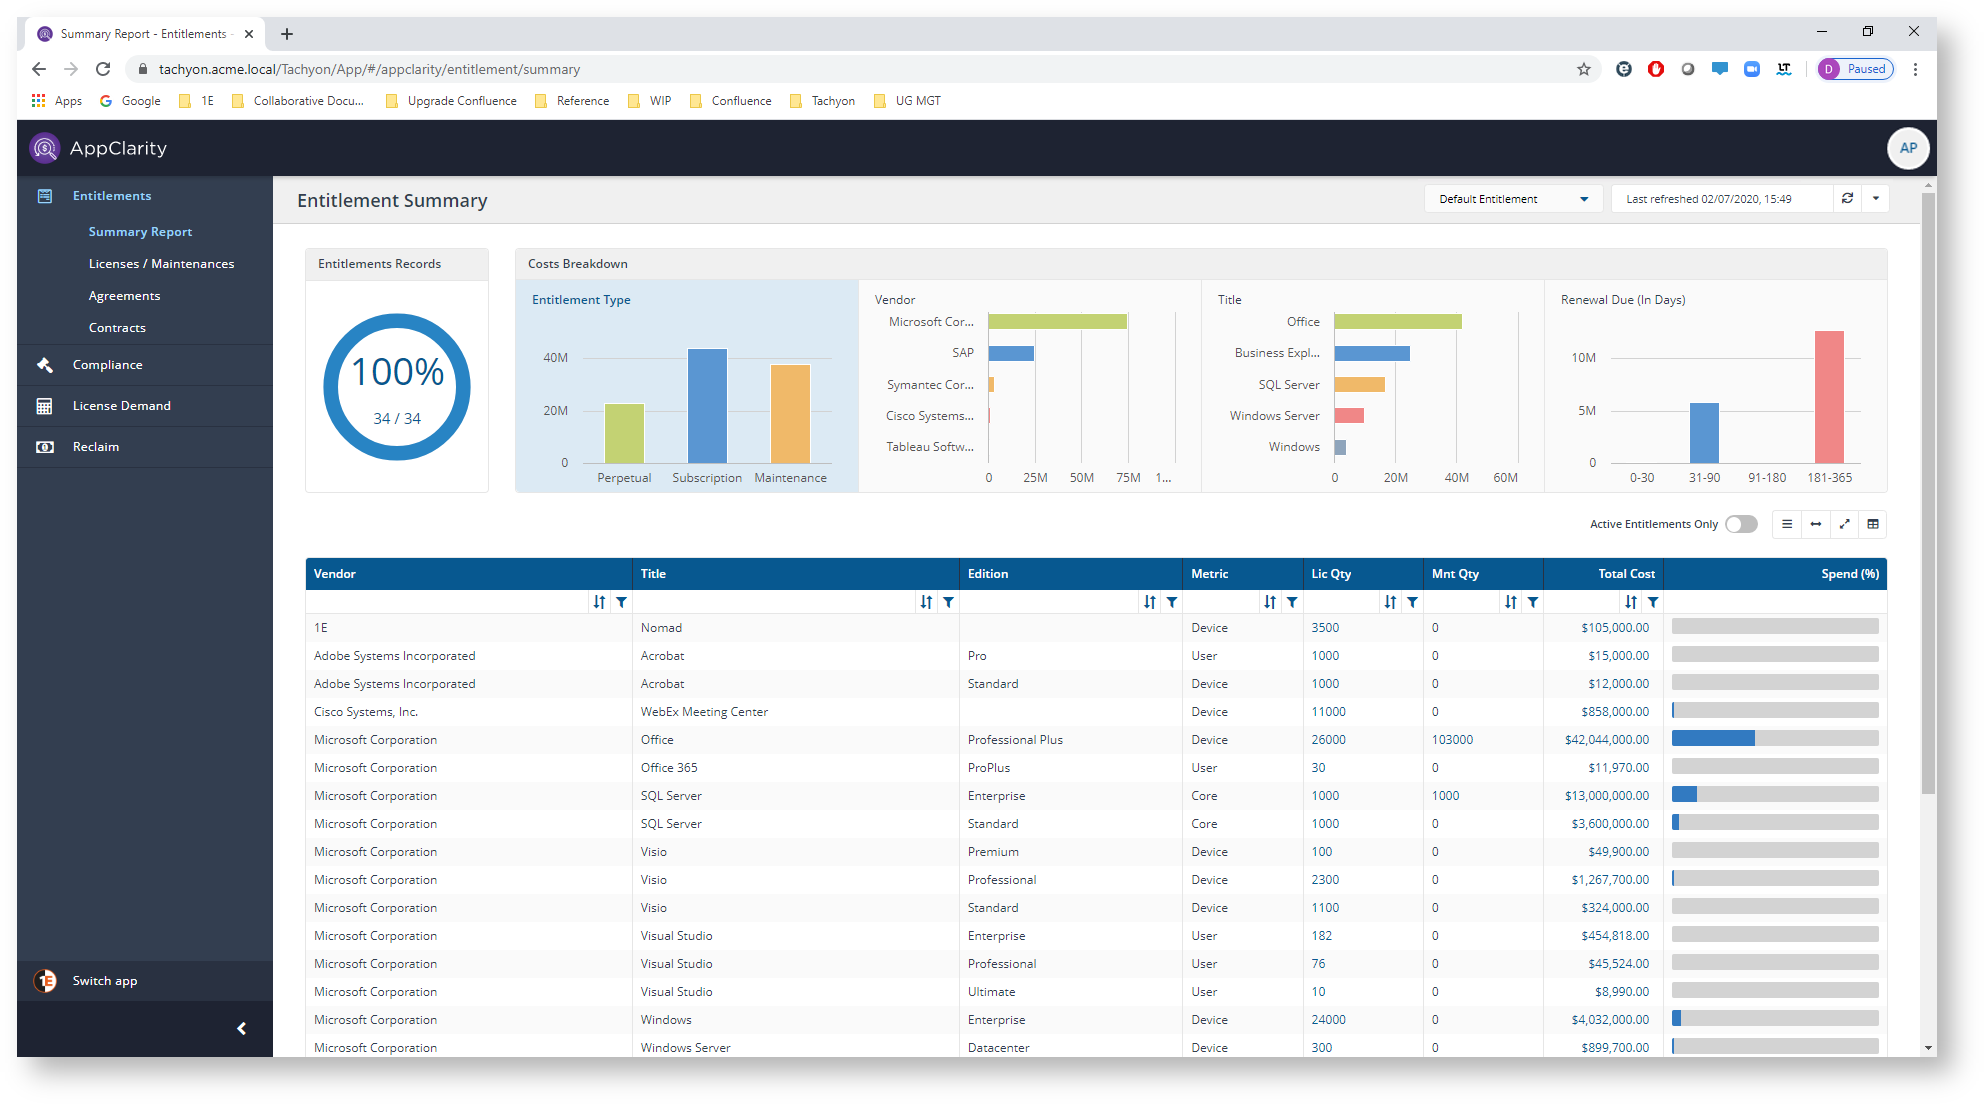
Here you can view the entitlements for a selected entitlements repository. You get to this page by clicking the AppClarity→Entitlements→Summary Report node in the navigation panel.
The fields on the Summary Report page are:
Entitlements repository selector
Entitlements Records
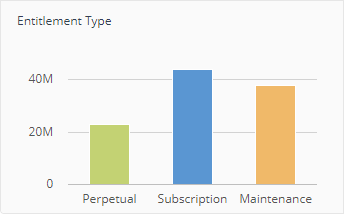
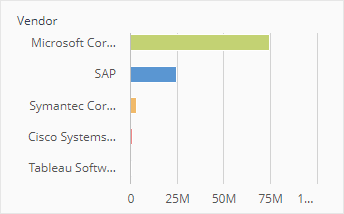
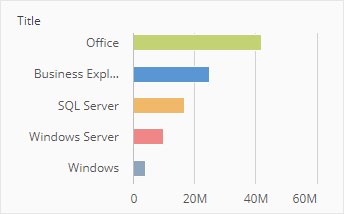
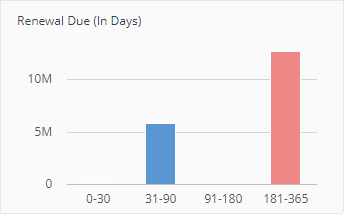
Costs Breakdown
Active Entitlements only toggle
Action Buttons
Export
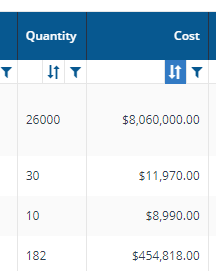
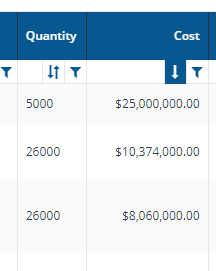
Entitlements table
Vendor
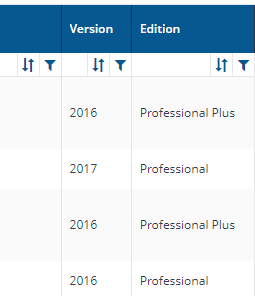
Title
Edition
Metric
Lic Qty
Mnt Qty
Total Cost
Spend (%)
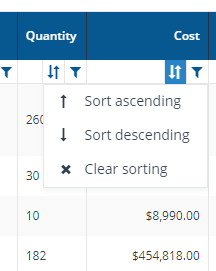
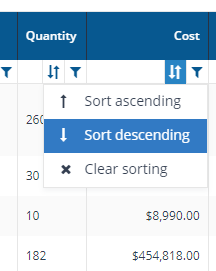
Column actions
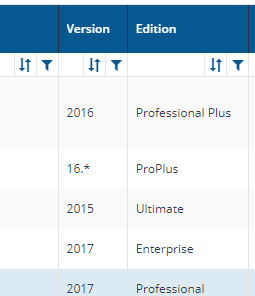
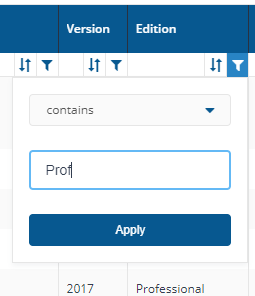
Column sort
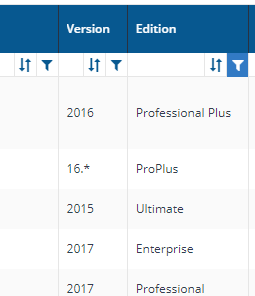
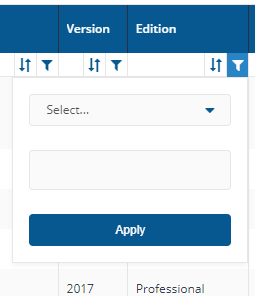
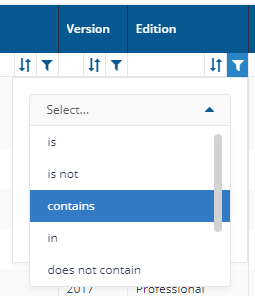
Column filter
Field | Description | ||||||||||||||||||||||||||||||||||||||
|---|---|---|---|---|---|---|---|---|---|---|---|---|---|---|---|---|---|---|---|---|---|---|---|---|---|---|---|---|---|---|---|---|---|---|---|---|---|---|---|
This field lets you select the repository where the entitlements data displayed on the page comes from. By default this is set to Default Entitlements. If you have created your own entitlements repositories, click on the name to select any of these from the drop-down list. | |||||||||||||||||||||||||||||||||||||||
This chart shows the percentage of the total number of Entitlements Records in the selected Entitlements repository that are currently being displayed on this page as a result of the applied filters. The figures below the chart show the number of Entitlements Records being displayed over the total number of Entitlements Records in the selected Entitlements repository. 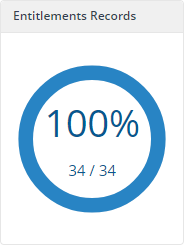 | |||||||||||||||||||||||||||||||||||||||
These charts show the costs breakdown for various aspects of the Entitlements in the currently selected Entitlements repository.
| |||||||||||||||||||||||||||||||||||||||
The Active Entitlements only toggle adds a filter when it's turned on that filters the table to only display the entitlements that have been published and not the ones that are in draft. | |||||||||||||||||||||||||||||||||||||||
The following table describes the action buttons displayed on theSummary Reportpage.
| |||||||||||||||||||||||||||||||||||||||
The following table describes the columns displayed in the Entitlements table:
The following column actions are available on some columns in the table.
|