Integrating the Tachyon PowerShell Toolkit with Microsoft Power BI
How to use the Tachyon PowerShell Toolkit with Microsoft Power BI desktop.
Power BI desktop is a free data analysis and visualization tool which provides you with huge flexibility in processing data from various sources.
You can use Power BI to perform analysis on data returned by Tachyon instructions. This page discusses how to take the results from an instruction and bring them into Power BI.
Getting started
You can download the Power BI desktop application from Microsoft's site here https://powerbi.microsoft.com/en-us/downloads/
Once installed, when you start Power BI, you are prompted to get data for your report.
Creating a dataset for use with a report
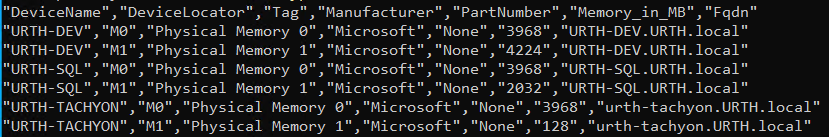
We will invoke an instruction which returns memory details for each device, as shown below. Because this is an aggregating instruction, we specify the -Drilldown parameter to retrieve detailed per-device memory information. Our target scope is defined as our lab domain, which in this scenario returns data for three devices.

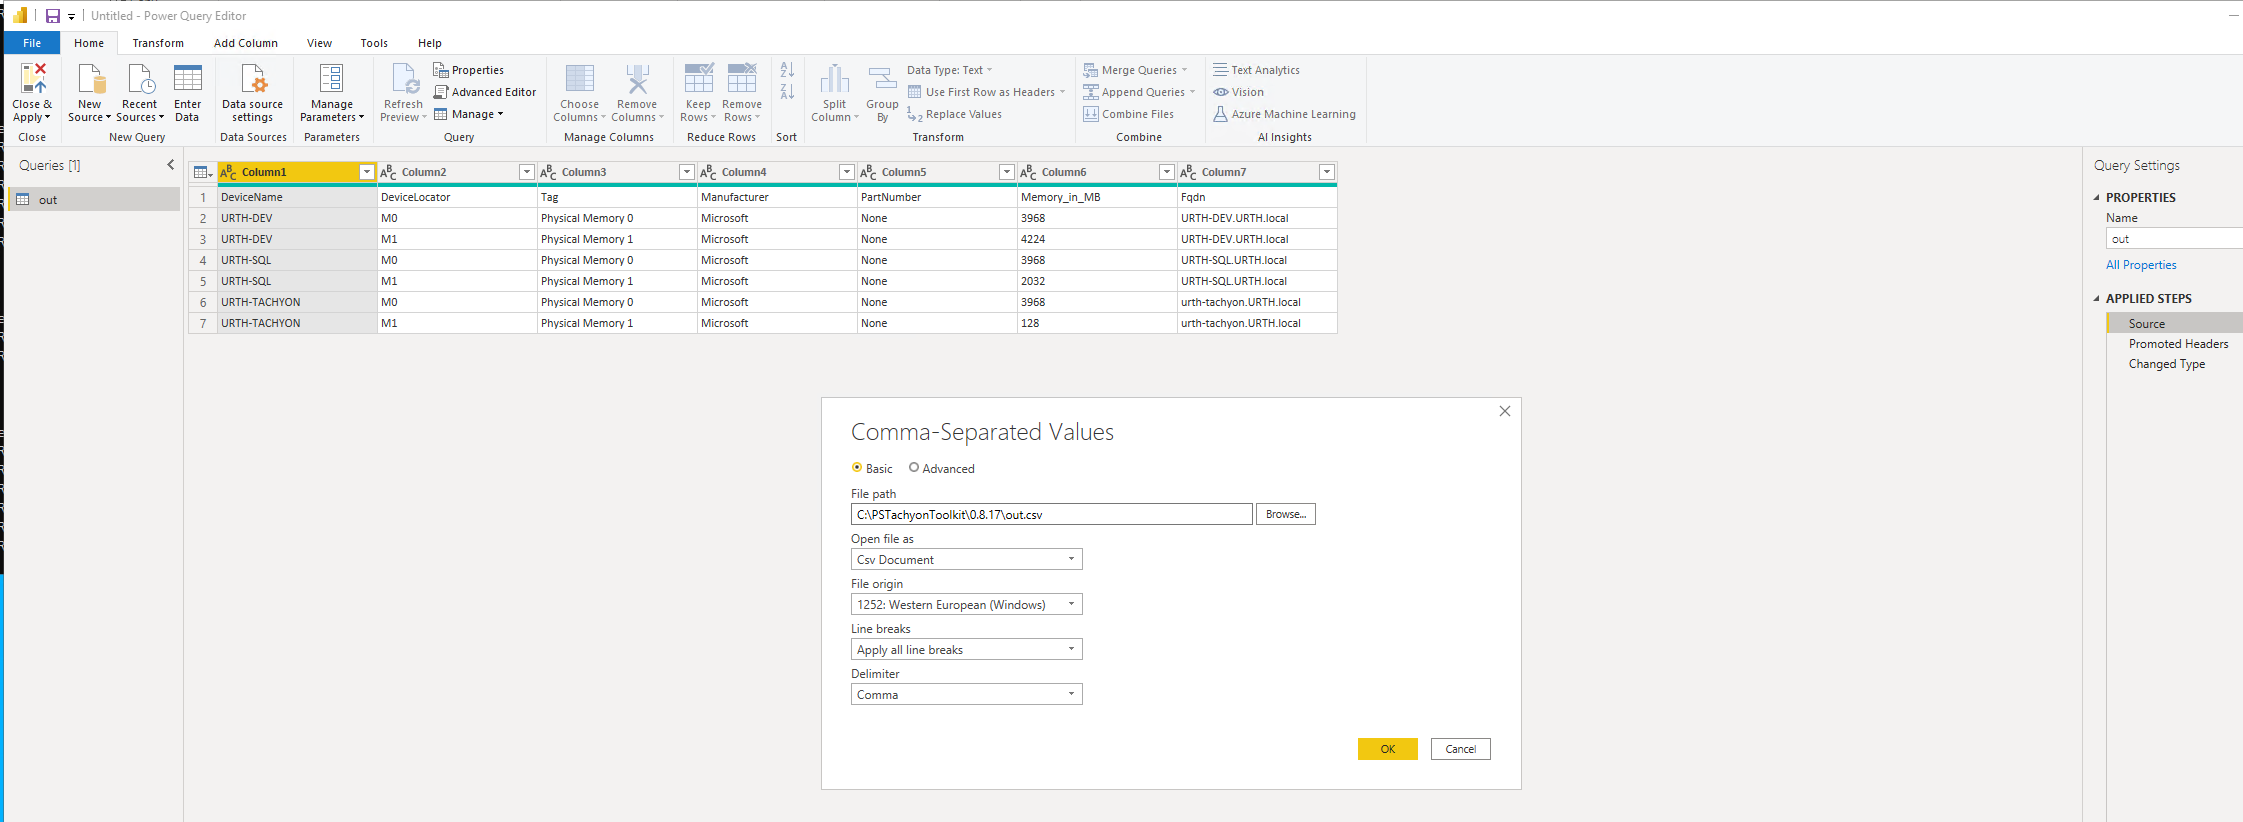
This will create a CSV file as output, whose contents look like this.
Create a datasource
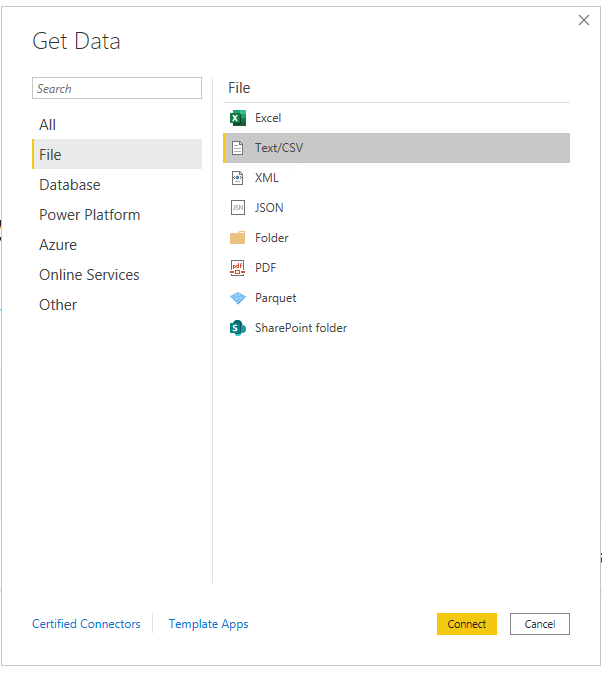
Now in Power BI, create a new data source based on a CSV file.
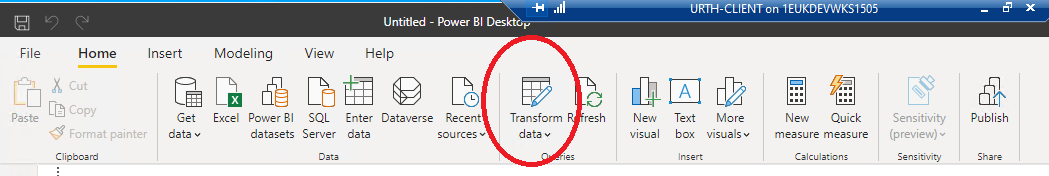
Click Transform Data to open the Query Editor window
When you have browsed to the file and pressed Load, you are taken back to the visualization screen. Click on Transform Data on the ribbon.
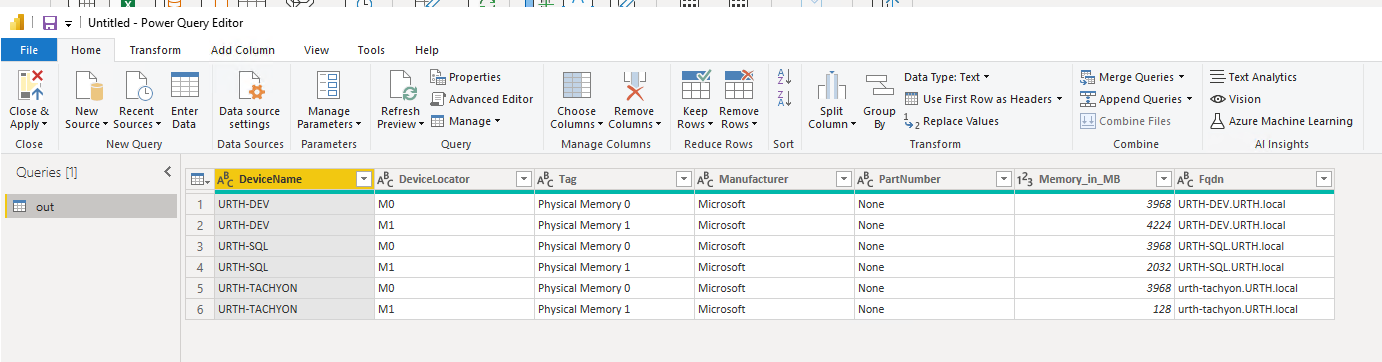
The data from the CSV file should appear in the Query Editor window.
Note
If the column headers were not automatically chosen as the column names, you can force this by clicking 'Use first row as headers' in the ribbon
Click 'Apply and Close' to return to the visualization screen.
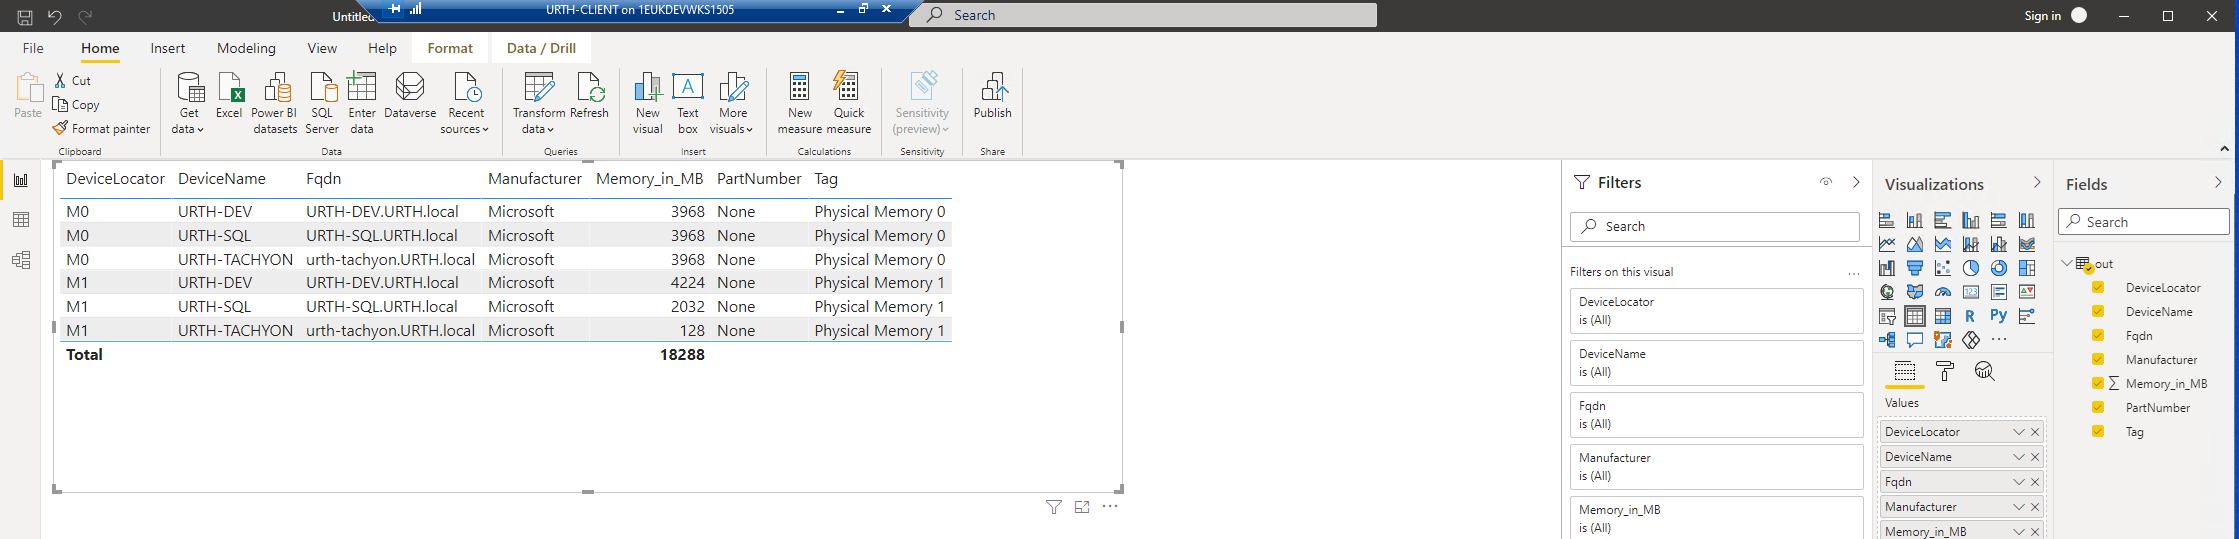
Select the fields to visualize
On the right-hand side in the 'Fields' pane you will see the data source, named in this case 'out'.
Click on each column in the source. You should now see a table on the visualization screen.
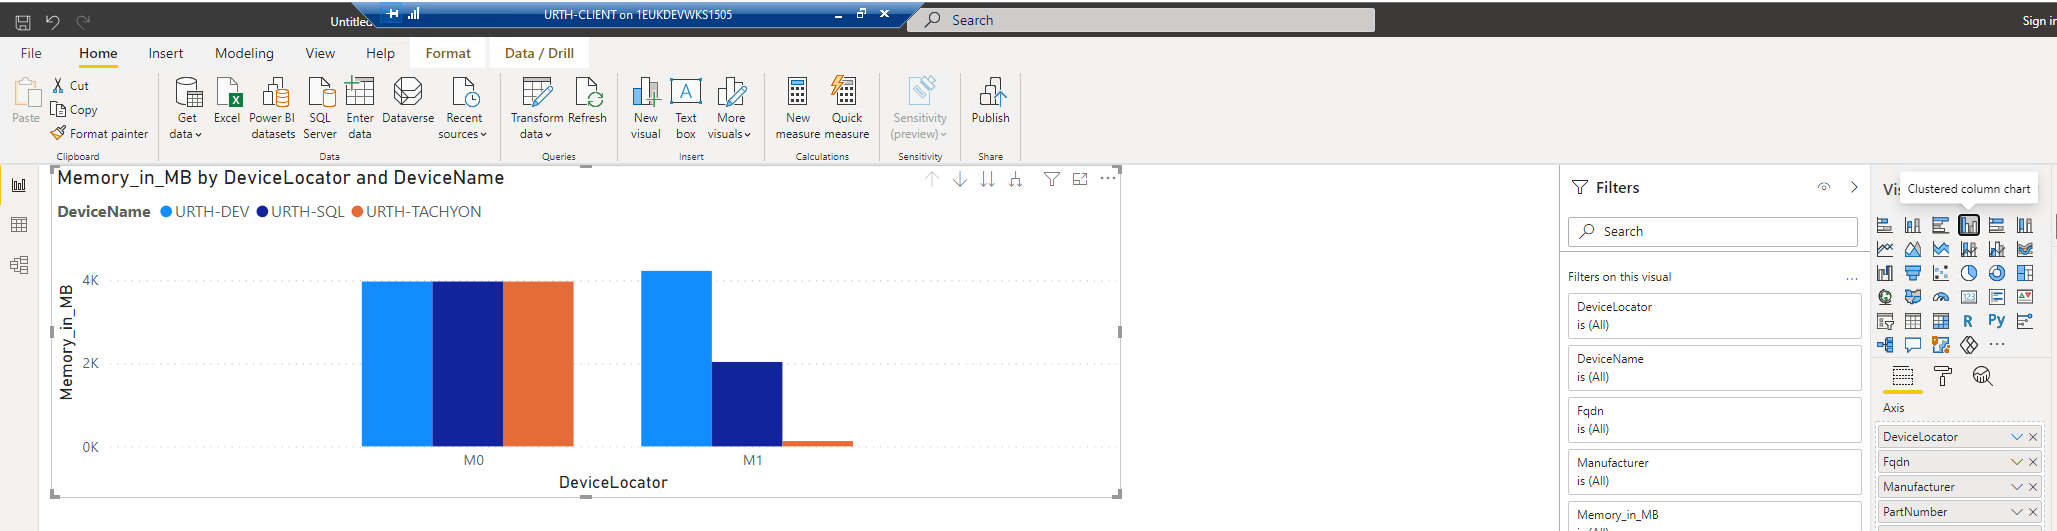
Select a chart type
Now click on 'clustered column chart' from the Visualizations pane. Your data should now be visualized.
Refreshing the data
To refresh the data from the file source, click Refresh in the ribbon. If you had re-rerun the instruction using the PowerShell invoke-tachyoninstruction cmdlet, then the refreshed data would now be displayed.
Modifying the data source
It's not immediately obvious how you modify the data source e.g to point to a different csv file. To modify the data source, click Transform Data to re-open the Query Editor window.
Then in the Query Settings pane on the far right, click Source in the Applied Steps section. You can now modify the data source file.
Creating a report with multiple data sources
You can create more data sources, for example, associated with the results of other Tachyon instructions. You do this by clicking New Source from the ribbon in the Query Editor window and defining the additional sources, just as you did the first.
Normally, you would set up the Tachyon instructions to send data to uniquely named CSV files, corresponding to the data sources that you have set up. Then you can visualize each of these sources.
Note
Power BI is an enormously sophisticated product, and we have just scratched the surface here. One interesting possibility is to use Power BI to 'join' multiple data sources together. This allows you to explore data patterns such as correlations etc. across multiple data sources and Tachyon instructions.
Another possibility is to set up a Windows scheduled task that runs cmdlets to retrieve Tachyon instructions at regular intervals, thus automatically providing fresh data to your reports.